Vessel Risk Calculator: Graphical User Interface User's Manual - OCS Study BOEM 2021-035
←
→
Page content transcription
If your browser does not render page correctly, please read the page content below
OCS Study
                                      BOEM 2021-035

Vessel Risk Calculator: Graphical User
Interface User’s Manual

U.S. Department of the Interior
Bureau of Ocean Energy Management
Office of Renewable Energy Programs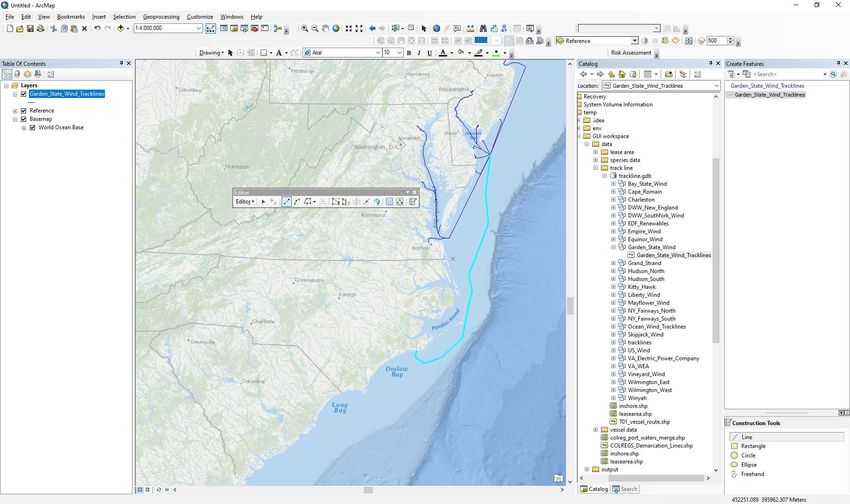
OCS Study
                                          BOEM 2021-035

Vessel Risk Calculator: Graphical User
Interface User’s Manual

April 2021

Authors:
Amit Malhotra (Geo Horizons)
Mark Fonseca, Ph.D. (CSA)
Mary Jo Barkaszi (CSA)
Kim Olsen (CSA)

Prepared under Task Order 140M0119F0033

By
CSA Ocean Sciences Inc.
8502 SW Kansas Avenue
Stuart, Florida 34997

U.S. Department of the Interior
Bureau of Ocean Energy Management
Office of Renewable Energy Programs
DISCLAIMER
Study concept, oversight, and funding were provided by the U.S. Department of the Interior, Bureau of
Ocean Energy Management (BOEM), Environmental Studies Program, Washington, D.C., under Contract
Number 140M0119F0033. This report has been technically reviewed by BOEM, and it has been approved
for publication. The views and conclusions contained in this document are those of the authors and should
not be interpreted as representing the opinions or policies of the U.S. Government, nor does mention of
trade names or commercial products constitute endorsement or recommendation for use.

                                  REPORT AVAILABILITY
To download a PDF file of this report, go to the U.S. Department of the Interior, Bureau of Ocean Energy
Management Data and Information Systems webpage (http://www.boem.gov/Environmental-Studies-
EnvData/), click on the link for the Environmental Studies Program Information System (ESPIS), and
search on 2021-035. The report is also available at the National Technical Reports Library at
https://ntrl.ntis.gov/NTRL/.

                                             CITATION
Malhotra A, Fonseca M., Barkaszi MJ., and Olsen, K. 2021. Vessel Risk Calculator: Graphical User
   Interface User’s Manual. Sterling (VA): U.S. Department of the Interior, Bureau of Ocean
   Energy Management. OCS Study BOEM 2021-035. 46 p. + Appendices.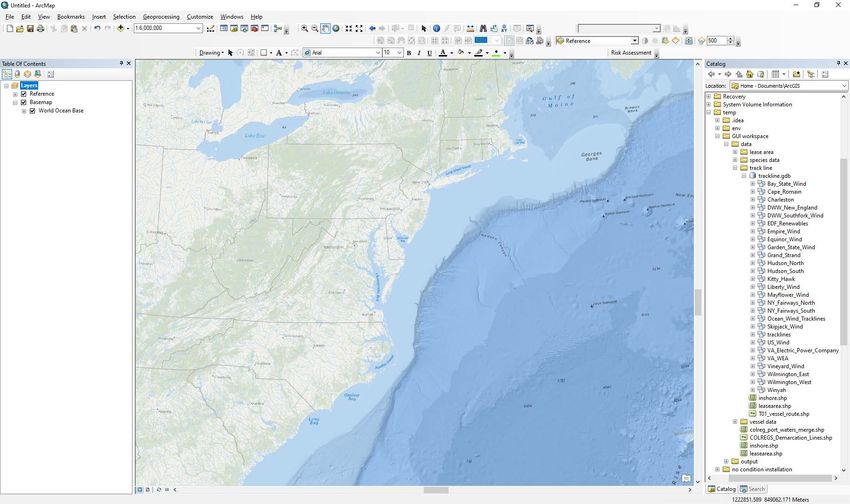
Contents
List of Figures ................................................................................................................................................ ii
List of Tables ................................................................................................................................................ iv
List of Abbreviations and Acronyms.............................................................................................................. v
1 Introduction ........................................................................................................................................... 1
1.1 Scope/Goals of Project ................................................................................................................. 1
1.2 Approach and Methods ................................................................................................................. 2
1.3 Model Basics ................................................................................................................................. 3
2 Installation ............................................................................................................................................. 4
2.1 System Requirements ................................................................................................................... 4
2.2 Installation Files............................................................................................................................. 5
2.3 Installation Steps ........................................................................................................................... 5
3 Getting Started .................................................................................................................................... 13
3.1 Calculator File Structure .............................................................................................................. 13
3.2 Calculator Steps .......................................................................................................................... 15
3.2.1 Inputs for Vessel Transit Total ............................................................................................ 16
3.2.2 Inputs for Daily Wind Farm Vessel Risk .............................................................................. 31
3.3 Aggregator Module ...................................................................................................................... 37
3.4 Editing Data Files ........................................................................................................................ 39
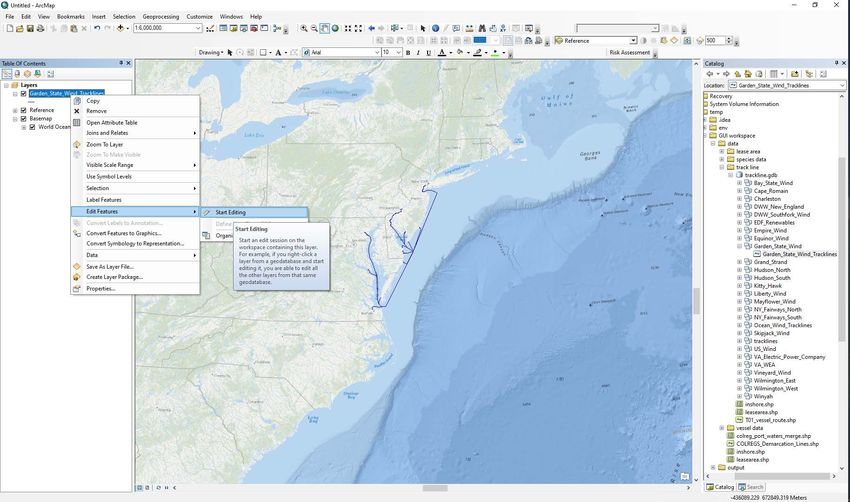
3.4.1 Adding Track Lines ............................................................................................................. 39
Appendix A: Wind Energy Area GIS Data Table....................................................................................... A-1
Appendix B: Pre-Drawn Vessel Track Line Figures .................................................................................. B-1
i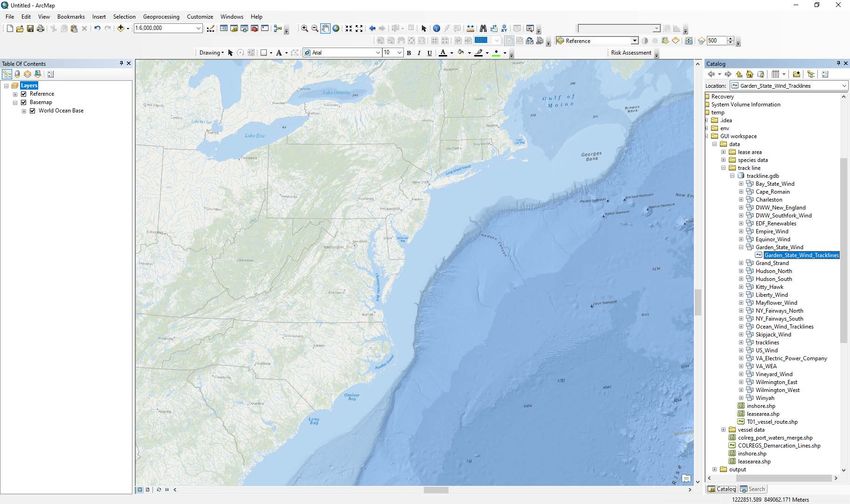
List of Figures
Figure 1.    Atlantic outer continental shelf .............................................................................. 3

Figure 2.    Screenshot of Vessel Risk Calculator Setup ......................................................... 5

Figure 3.    Screenshot of Vessel Risk Calculator Setup completion....................................... 6

Figure 4.    Screenshot of ArcGIS Add-In Installation Utility to install Vessel Risk
             Calculator add-in ................................................................................................... 7

Figure 5.    Screenshot showing the ‘Installation Succeeded’ once the Vessel Risk
             Calculator successfully installs .............................................................................. 7

Figure 6.    GUI Tool.mxd document ....................................................................................... 8

Figure 7.    ArcMap Add-In Manager showing GUI Calculator Add-In installed in
             ArcMap .................................................................................................................. 9

Figure 8.    ArcMap Calculator bar menu showing how to access the Vessel Risk
             Calculator toolbar ................................................................................................ 10

Figure 9.    Vessel Risk Calculator toolbar initiated in ArcMap .............................................. 12

Figure 10.   Calculator file structure ........................................................................................ 14

Figure 11.   Calculator ‘Project Folder Setting’ tab for selecting the GUI Workspace
             folder ................................................................................................................... 16

Figure 12.   Calculator GUI ‘Transit Monthly’ tab for starting vessel transit total .................... 17

Figure 13.   Track line select tab in vessel transit total ........................................................... 18

Figure 14.   Vessel parameter screen to enter vessel parameters and their number of
             trips in the vessel transit total .............................................................................. 20

Figure 15.   Animal parameters screen to enter foraging, migration, SAGs and
             calf/cow percentages, along with likelihood of animal aversion .......................... 22

Figure 16.   Message box showing the output for vessel transit total ..................................... 22

Figure 17.   Vessel transit total geospatial format heat map displayed in ArcMap ................. 31

Figure 18.   Screenshot showing ‘Wind Farm Daily’ tab for starting Wind Farm total ............. 32

Figure 19.   Vessel parameter screen to enter vessel parameters and their number of
             vessels in Wind Farm total .................................................................................. 34

Figure 20.   Animal parameter screen to enter animal parameters ........................................ 35

Figure 21.   Message box showing the output for Wind Farm Calculator total ....................... 37

Figure 22.   Aggregator tab screen to select zone .................................................................. 38

                                                               ii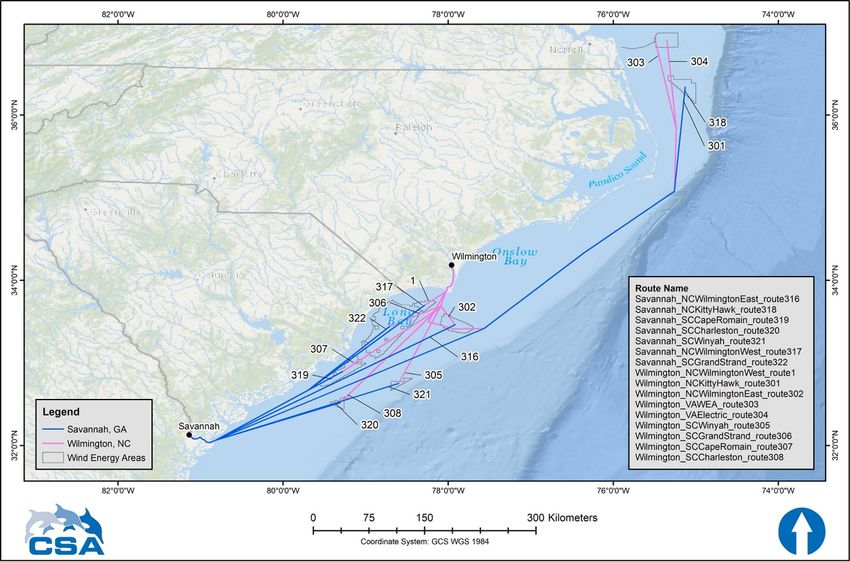
List of Figures
(Continued)
Figure 23.    Aggregator tab screen to select project and queries ........................................... 38

Figure 24.    ArcMap screenshot showing track line geodatabase in ArcCatalog
              window ................................................................................................................ 40

Figure 25.    ArcMap screenshot showing selected feature dataset in ArcCatalog
              window ................................................................................................................ 41

Figure 26.    ArcMap screenshot showing the navigation to start editing the track line
              feature class ........................................................................................................ 42

Figure 27.    ArcMap screenshot showing the edited track line feature class .......................... 43

Figure 28.    ArcMap screenshot showing the way to stop editing the track line feature
              class .................................................................................................................... 44

Figure 29.    Attribute table screenshot showing the new track line added to the feature
              class with ‘null’ attributes ..................................................................................... 45

Figure 30.    Attribute table screenshot showing the new track line added to the feature
              class with filled-in attributes ................................................................................. 46

Figure 31.    Vessel transit GUI aggregator Track line screenshot showing the new
              trackline added to the list of available track lines ................................................ 46

Figure B-1.   Pre-drawn vessel routes from Montaup, MA; Boston, MA; and Vineyard
              Haven, MA to the wind energy areas ................................................................ B-1

Figure B-2.   Pre-drawn vessel routes from Brayton Point, MA and New Bedford, MA to
              the wind energy areas ....................................................................................... B-2

Figure B-3.   Pre-drawn vessel routes from Fall River, MA; Old Harbor, RI; and
              Providence, RI to the wind energy areas........................................................... B-2

Figure B-4.   Pre-drawn vessel routes from New Harbor, RI; Point Judith, RI; and
              Quonset, RI to the wind energy areas ............................................................... B-3

Figure B-5.   Pre-drawn vessel routes from New London, CT; Montauk, NY; and
              Shinnecock Fish Dock, NY to the wind energy areas........................................ B-3

Figure B-6.   Pre-drawn vessel routes from Bridgeport, CT and Greenport Harbor, NY
              to the wind energy areas ................................................................................... B-4

Figure B-7.   Pre-drawn vessel routes from New Haven, CT and Port Jefferson, NY to
              the wind energy areas ....................................................................................... B-4

Figure B-8.   Pre-drawn vessel routes from Cape May, NJ and Port Elizabeth, NJ to the
              wind energy areas ............................................................................................. B-5

Figure B-9.   Pre-drawn vessel routes from Dorchester, NJ and Baltimore, MD to the
              wind energy areas ............................................................................................. B-5

                                                               iii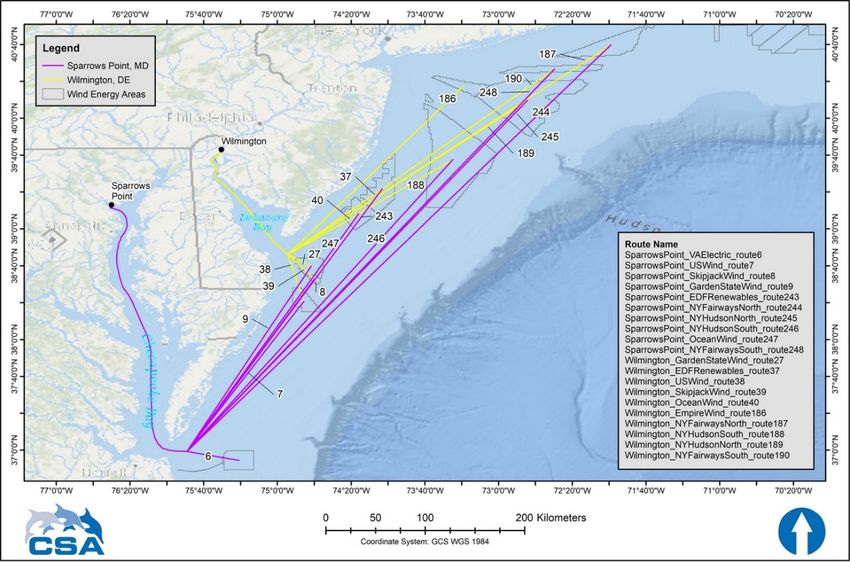
List of Figures
(Continued)
Figure B-10.   Pre-drawn vessel routes from Atlantic City, NJ and Lewes, DE to the wind
               energy areas ..................................................................................................... B-6

Figure B-11.   Pre-drawn vessel routes from Ocean City, MD and Philadelphia, PA to
               the wind energy areas ....................................................................................... B-6

Figure B-12.   Pre-drawn vessel routes from Sparrows Point, MD and Wilmington, DE to
               the wind energy areas ....................................................................................... B-7

Figure B-13.   Pre-drawn vessel routes from Piney Point, MD and Rehoboth, DE to the
               wind energy areas ............................................................................................. B-7

Figure B-14.   Pre-drawn vessel routes from Hope Creek, NJ and Cape Charles, VA to
               the wind energy areas ....................................................................................... B-8

Figure B-15.   Pre-drawn vessel routes from Paulsboro, NJ and Hampton Roads, VA to
               the wind energy areas ....................................................................................... B-8

Figure B-16.   Pre-drawn vessel routes from Moorehead City, NC and Charleston, SC to
               the wind energy areas ....................................................................................... B-9

Figure B-17.   Pre-drawn vessel routes from Wilmington, NC and Savannah, GA to the
               wind energy areas ............................................................................................. B-9

List of Tables
Table 1.       Monthly Vessel transit total example table format output text file........................ 24

Table 2.       Monthly Vessel transit total example table converted using Excel Import
               Wizard ................................................................................................................. 27

                                                                iv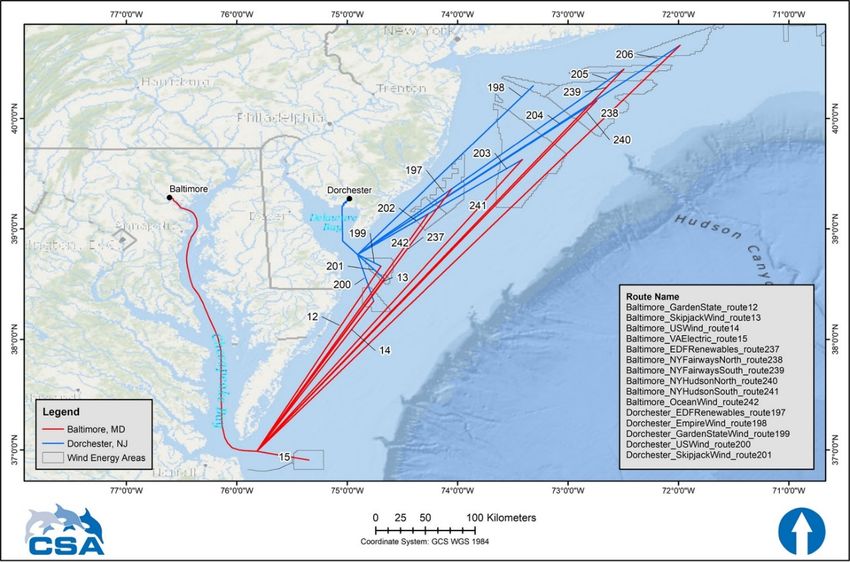
List of Abbreviations and Acronyms

AIS       Automatic Identification System
BOEM      Bureau of Ocean Energy Management
CSA       CSA Ocean Sciences Inc.
GUI       graphical user interface
km        kilometer
kn        knot
m         meter
NARW      North Atlantic right whale
NEPA      National Environmental Policy Act
NMFS      National Marine Fisheries Service
OCS       outer continental shelf
RAM       random access memory
SAG       surface-active group
U.S.      United States
UME       unusual mortality event
WEA       wind energy areas

                                       v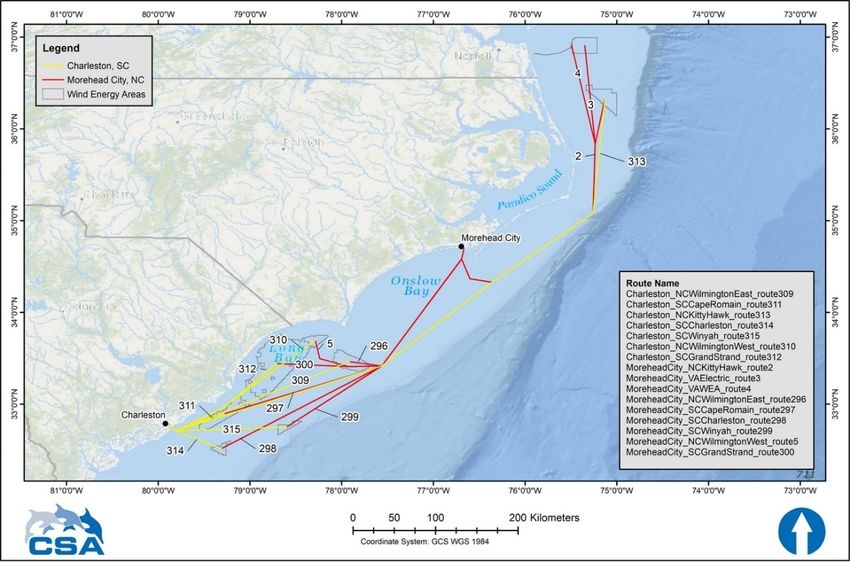
1     Introduction
With the development of offshore wind projects, the Bureau of Ocean Energy Management (BOEM)
must evaluate the environmental risks of the projects. One risk identified is the potential impacts of vessel
operations on marine mammals and sea turtles. Vessel strike has been identified as a source of injury and
mortality of both large whales and sea turtles. Current qualitative assessments of expected encounter rates
and/or strike numbers are often based on highly localized evaluations and better assessment Calculators
are needed to better evaluate the spatial and temporal risks from wind development vessel operations.

An associated report 1, describes a new Vessel Risk Calculator (Calculator) with its underlying encounter
prediction and graphical user interface (GUI) was developed to evaluate these risks and visualize the
results. This document provides user guidance for the utilization of the Calculator.

1.1     Scope/Goals of Project
The objective of this study was to characterize the risk of a strike on large whales or sea turtles by the
different vessel types operating to support of offshore wind energy and develop a model that can account
for geospatial, temporal, and species-specific parameters for any wind energy areas on the Outer
Continental Shelf (OCS) of the Atlantic.

The study was conducted in four stages, the first characterized the baseline conditions for vessel traffic
along the Atlantic OCS and within the “wind farms” 2 and includes selection options for vessel types,
operational parameters, and vessel actions during different stages of wind area development (i.e., surveys,
construction, operations). Also developed was an analytical framework that utilized existing data to
calculate encounter rates based on species’ information including behavior, vessel parameters, geographic
area, and stage of wind area development. See Section 2.3 of the associated report1 for further discussion
regarding matrices. The second phase assessed and identified the quantitative parameters and developed
the model that evaluated the encounter rates and estimation for large whales and sea turtles. See Section
3.0 of the associated report1 for further discussion regarding the model development. In the third phase, a
user-friendly GUI was developed that operates with the Vessel Risk Calculator to allow users to create
complex scenarios of vessel activity as it interacts with animal density distributions. The GUI provides
the user with text reports of the encounter numbers generated by the users’ scenario and produces
encounter risk-based heat maps that correspond to the scenario tabular data, displayed in a geographic
context. The combined predictive model and GUI is described here as the ‘Calculator’. See Section 5 of
the associated report1 for further discussion regarding Calculator application. A fourth stage was added
after delivery of a draft version and that was to add a capacity to the GUI to allow aggregation and
summation of model results from multiple, user-defined scenarios.

1
  Barkaszi MJ, Fonseca M., Foster T, Malhotra A, Olsen, K. 2020. Risk Assessment to Model Encounter Rates
Between Large Whales and Vessel Traffic from Offshore Wind Energy on the Atlantic OCS. Sterling (VA):
U.S. Department of the Interior, Bureau of Ocean Energy Management. OCS Study BOEM 2020. 86p.
2
  Here, the term “wind farm” is used generically and includes all the destinations that the user will be able to select
in the Calculator. This list is composed of data compiled from BOEM data sources
(BOEM_Lease_Areas_4_13_2020 and BOEM_Wind_Planning_Areas_4_13_2020) and includes Wind Planning /
Wind Energy Areas, Call Areas, Lease Areas and actual wind farm designations within Lease Areas.

                                                           1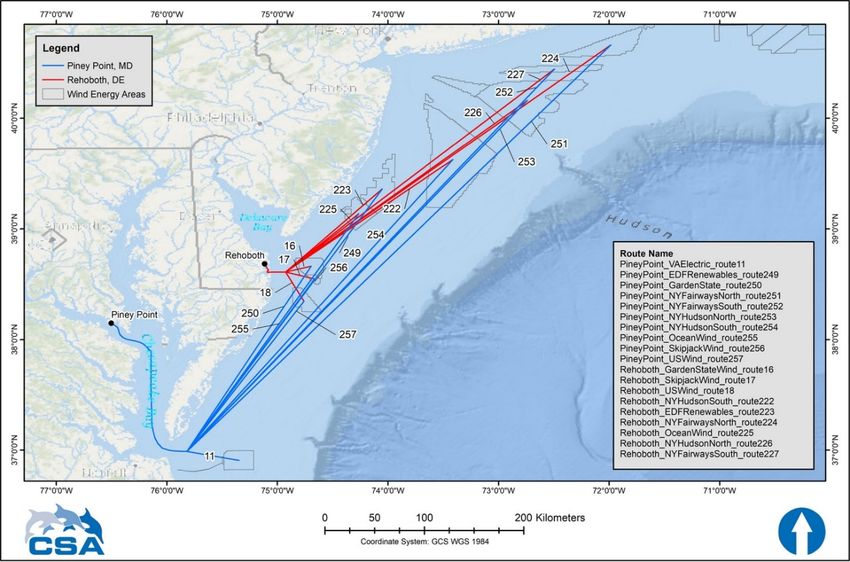
The Calculator can be used to assess the expected encounter 3 numbers and, to some degree by utilizing
aversion selections, potential vessel strike numbers for large whales and sea turtles over spatial and
temporal scales indicative of the current and future offshore wind energy project development. While
project-based assessments of vessel traffic and potential vessel strike impacts are required from the wind
energy developers, no comprehensive assessment of the vessel strike risk takes place over all phases of a
single development or across multiple projects. While individual project risk to vessel strikes is likely
very low, the outlook for development along the eastern seaboard demands that vessel strike risk be
assessed on a more comprehensive basis to inform National Environmental Policy Act (NEPA)
compliance and the public.

This study has identified sensitive parameters for vessel type, operation, and species activity, including
expected animal swim depths, that allow for a robust analytical framework that allows users to assess
vessel encounters and animal strikes associated with vessels serving offshore wind development. The
aforementioned associated report contains a detailed risk assessment has been conducted to establish
critical parameters from both vessels and species that are included in the predictive model.

1.2     Approach and Methods
Assessing the strike risk from vessels operating in support of offshore wind development is necessary
under NEPA requirements and assists managers in identifying vessel activities that present risk that could
be mitigated, under the purview of agencies that oversee wind development. Through the GUI, the user
will set up a series of scenarios 4 of their choice that will provide an expected number of encounters for the
input parameters. Scenarios themselves can then be accumulated to provide multi-year or multi-route
encounter predictions or compared to one another to assess strike risk against several options.

The risk of a strike has several components. The first-order component of that risk is the frequency of a
vessel encountering an animal. Subsequent risk components, including whether or not that encounter
becomes an actual strike (e.g., did the animal or vessel detect one or the other and avert and avoid a
strike) or the consequences of that strike (e.g., animal mortality) are not explicitly modeled here.
However, users of the graphical user interface provided with this encounter model are allowed to create
theoretical scenarios that begin to consider actual strike risk. This is accomplished by allowing the user to
vary the effectiveness of aversion (by both a vessel and an animal from each other) at the point of
encounter within each scenario. Through the creation of these scenarios, built on the first-order issue
(encounter frequency), users may begin to assess the overall likelihood of strike risk. See Section 2.4 of
the associated report1 for further discussion regarding encounter factors.

Importantly, this risk assessment, as a predictor of animal-vessel encounters, required a spatial scale of
the Atlantic OCS (Figure 1). As no large-scale commercial wind farms have yet been constructed in the
U.S., it was necessary to identify the factors influencing encounter risk for the Calculator using the best
available information but with the flexibility to adapt to changing vessel and biological data as well as
ongoing and future wind development activities.

3
  An encounter refers to an event during which a vessel and an animal are in close proximity such that a “strike”
could occur. An encounter describes a precursor situation that could result in a strike unless either the animal, vessel,
or both averts and thus is a measure of strike risk.
4
  A scenario for the GUI is defined as a single set of input parameters that include a single species of interest, a
single month, up to seven vessel types, a single transit route to a wind farm area or a wind farm area traversed by the
vessels, and user-specified number of transits.

                                                           2
Figure 1. Atlantic outer continental shelf
1.3 Model Basics
The overall methodology for GUI development was to separate vessel encounter computations into two
components:
1. Vessel encounters during a transit to and from a wind farm area (round trip); and
2. Vessel encounters within a wind farm area (e.g., lease area).
Transit speed between the port and the wind farm is assumed constant with the model defaulting to a
normal operating speed for the selected vessel that can be adjusted by the user. The constant speed
assumption removes the complexity (and inaccuracy) of adjusting the aversion coefficients as a function
of speed along a single track line. Within a wind farm area, vessel behavior is more complex and can
often not be predicted simply based on its task. Consequently, the vessel behavior (by vessel category)
within the wind farm area is represented by the percent time the vessel was at operating speed; there is no
spatial representation of a vessel’s behavior in a wind farm area given the boundless combinations of
movement patterns. Consequently, only one value for encounter risk is returned for a wind farm area.
In order to provide the user with a total number of predicted encounters for a user-defined scenario, a
summing operation in the Calculator totals the encounter numbers computed by the underlying model,
utilizing the user-defined conditions as well as various parameters such as vessel speed, animal density,
etc. to produce a count of animal encounters. This summing operation provides two types of total
encounter numbers, one for the total number of encounters during a single transit (round-trip; out and
back) from a user-selected port to a wind farm area. The transit is composed of the vessel moving across
sequential 1 km2 blocks within each of which the risk of encounter is computed. All the blocks along the
transit route are summed which is called the vessel transit total. The second type of summing operation
3provides a total number of encounters within an entire wind farm area over a 24-hour period which is
composed of multiple km2 transit blocks within the wind farm area for any user-defined scenario. Each
scenario is computed independently of any other 5. Both values (transit and wind farm encounter sums) are
returned to the user for each scenario. Importantly, these summing operations in the Calculator do not
total across scenarios; that function is performed by the Aggregator Module which is discussed in
Section 3.3.
To review and clarity, several terms are defined in this manual as follows: A scenario is the compilation
of the individual parameters that the user wants to evaluate and that is submitted for a model run in the
Calculator (for example a transit route from 1 port to 1 wind farm for 1 species, for 1 set of vessels for
1 month, with no aversion selected). A project is made up of as many scenarios as the user desires that
are named the same and filed in the same project folder. For example, a project can be 4 different transit
scenarios to a wind farm or multiple wind farms plus the vessels within the wind farm for all species for
all months. A project can include any set of scenarios for which a cumulative total risk value is desired.
The Aggregator module then allows the user to select which scenarios in a project that may be summed
together to gain a larger scale (both in space and time, as defined by the scenarios selected) perspective.
Thus, the user is strongly advised to plan a strategy of scenario selection and project building to address a
defined question at the outset.
2 Installation
The Calculator has been created as an ArcMap add-in using Python 2.7 and ArcGIS 10 architecture. To
run the Calculator, the computer should have ArcGIS 10.5 or higher installed with Python 2.7.
2.1 System Requirements
The operation of the Calculator has not been systematically tested on combinations of platform
configurations. Therefore, the Calculator may run faster or slower on different systems and potentially,
for substantially older systems, not at all. Other versions of Windows may be suitable but have not been
tested. These are the recommended minimum system requirements to run the Calculator on a machine
running ArcGIS 10.5:
• Windows 10+
• ArcGIS version 10.5 or higher.
o Basic License
o Spatial Analyst
• Processor speed: 2.0 GHz
• Cores: 4
• OS: Windows 10 64 bits
• RAM: 16 GB
• Hard drive: 500 GB
The Calculator can be installed on a stand-alone computer that meets the above requirements or will work
from a network-based configuration with a workstation meeting the above system requirements.
5
Note: given the extreme range in values that can be generated among user scenarios, the color ramps representing
the encounter numbers in a scenario are scaled only to that scenario and color ramps are NOT directly comparable
with any other scenario.
42.2 Installation Files
The GUI Calculator is distributed using the ‘GUI Calculator Installer.exe’ file. Click the file to start the
installation of the Calculator.
2.3 Installation Steps
The Calculator is distributed as a zip folder with installation files and data folders, which can be
downloaded on a local computer for installation.
Installation steps:
1. Download the ‘Vessel Risk Calculator Installer.zip’ file and un-compress the zipped file and
extract to a local folder.
2. Click on Vessel Risk Calculator Installer.exe and follow the installation steps to install
Calculator’s necessary modules on the computer (Figure 2). Either install it as admin status or
local user only depending on privileges. Pick a local folder to install the files. The completion of
the Vessel Risk Calculator setup screen is illustrated in Figure 3.
3. Default installation location is ‘C:\Program Files (x86)’.
Figure 2. Screenshot of Vessel Risk Calculator Setup
5Figure 3. Screenshot of Vessel Risk Calculator Setup completion
4. Once installed navigate to the folder where the user installed the Vessel Risk Calculator. The
folder will be named ‘Vessel Risk Calculator’
5. Inside the folder ‘Vessel Risk Calculator’, double click the file ‘arcaddin.esriaddin’ to install the
Calculator on ArcMap (Figure 4).
6Figure 4. Screenshot of ArcGIS Add-In Installation Utility to install Vessel Risk Calculator
add-in
6. Click ‘Install Add-In’ in the next window. ‘Installation succeeded’ message should confirm the
installation (Figure 5).
Figure 5. Screenshot showing the ‘Installation Succeeded’ once the Vessel Risk Calculator
successfully installs
77. Open GUI Tool.mxd by navigating to ‘GUI Workspace\data\mxd data’ folder (Figure 6).
Figure 6. GUI Tool.mxd document
88. Once ArcMap opens as shown in Figure 7 navigate to ‘Customize -> Add-in Manager’.
9. Open Add-in Manager to confirm the installation of Vessel Risk Calculator. Once confirmed,
close the Add-in Manager.
Figure 7. ArcMap Add-In Manager showing GUI Calculator Add-In installed in ArcMap
910. Click ‘Customize -> Toolbars -> Vessel Risk Calculator Toolbar’ to initialize the Calculator (Figure 8).
Figure 8. ArcMap Calculator bar menu showing how to access the Vessel Risk Calculator toolbar
1011. Open GUI Tool.mxd ArcGIS document file in the folder (Figure 9).
Next note that the overall methodology for the Calculator development was to decompose vessel
encounter computations into two separate components:
• During vessel transit to and from a wind farm area
• During vessel movement within a wind farm area
The GUI’s initial screen shows the ’Vessel Risk Calculator ‘button to calculate the vessel encounter
numbers as shown in Figure 9.
11‘Vessel Risk
Calculator”
button
Figure 9. Vessel Risk Calculator toolbar initiated in ArcMap
ArcMap needs to be restarted every time the Vessel Risk Calculator Add-in is installed or removed using the Add-In Manager.
123 Getting Started
Before utilizing the GUI, the user should first begin to identify a scenario. For example, the user should
be considering a scenario organized by the month, ports and wind farms, marine species of interest and
operational phase. The selection and file naming of scenarios is important for using the Aggregator
Module (Section 3.3) to aggregate the desired scenario total risk. Remember to open the .mxd in the ‘GUI
workspace\data\mxd data’ folder called GUI Tool.mxd. The Vessel Risk Calculator toolbar will open
automatically when the mxd opens, but it be turned off manually by clicking ‘Customize -> Toolbars ->
Vessel Risk Calculator Toolbar’ as shown in Figure 8.
3.1 Calculator File Structure
The Calculator is built as an ArcGIS add-in and all the supporting files, data, and output folders are
installed during the initial installation. Critical files are installed in the system folder. All files can be
viewed and accessed using Esri Desktop Software (e.g., ArcMap or ArcCatalog) and file names should
not be modified, or files deleted.
The GUI workspace (Figure 10) is where all the input and output data will be stored on the computer.
This is the directory where the GUI interacts with the data folder and creates the output. These data
folders provide the essential data on the risk factor matrix that help to forecast an encounter and
ultimately helps to determine the vulnerability of an animal to a vessel strike.
The GUI workspace is divided into two folders:
1. Data
The data folder is in turn divided into four separate data subfolders:
1. Wind Farm area: The wind farm data folder holds all the files about the wind farms and their
location.
2. Species data: All risk factor matrices related to species characteristics and behavior is stored in
this data folder.
3. Track line: Track line geodatabase stores all the track line datasets.
4. Vessel data: Data about vessel categories, characteristics, and their activities are stored in this
folder.
2. Output
This directory holds two the output geodatabase and the output text files from both the Transit and Wind
Farm area scenarios distinguished by prefix T and WF respectively. The user will develop scenarios for
each transit which provides a monthly risk value and a wind farm area which provides a 24-hr risk value.
13Figure 10. Calculator file structure
14Important Note: The Importance of File Structure
The project (see Section 1.3) can be thought of as a folder in which related scenarios are stored
to help the user to organize related output data and ensure proper filing of each scenario. In the
event no project name is assigned output file will have a ‘temp’ attached to the filename
instead of the project name and is stored in a default location. However, note that temp files
are replaced with similarly named files upon a new run; therefore, it is always recommended to
enter a project name when prompted to aid in saving and not overwriting Calculator-derived
scenarios. When choosing a project name, do not include an underscore (_) in the name or the
characters after the underscore will not be recognized in the Aggregator Module (Section 3.3).
It is recommended that for housekeeping purposes, like any ‘folder’ the project name provide
clues to its content and purpose of that particular compilation of scenarios.
If the user desired to ultimately have the sum of encounters for every month in, for example, a
3 year period, scenarios would need to be run for each month of the 3 year period and saved
under the project name, especially to allow subsequent summarization by the Aggregator
module (Section 3.3).
The assembly of scenarios under a project then allows for application of the Aggregator
module to compute the total number of encounters (and to some degree, risk, if aversion had
been applied in scenarios) across all the scenarios assembled in the project. However, the user
is of course free to manually sum up encounters among any individual scenarios at any time.
Note that both transit and wind farm scenarios can be placed under the same project name. The
user is prompted to choose either transit or wind farm data to sum across scenarios and the
Aggregator module automatically differentiates among transit and wind farm scenarios in its
aggregation process. The Aggregator module does not combine data from both transits and
wind farms.
3.2 Calculator Steps
Before running the Calculator, the users are required to select the GUI workspace in the ‘Project Folder
Settings’ tab (Figure 11). It is recommended that a new project subfolder be created that contains no
other files. If multiple scenarios will be modeled and risk probabilities later aggregated, each scenario
under this subfolder should be assigned a unique name to avoid overwriting of scenarios. The GUI
workspace is the location that all the input and output data will be stored on the computer; this will be the
location to which the user will navigate to obtain reports on their scenarios from the Calculator. The user
selects the output location in the ‘Project Folder Settings’ tab shown below. This will consist of ‘Data’
folder that contains the data used to run the Calculator, and an ‘Output’ folder that will contain the output
products of the Calculator. Figure 10 provides a diagram of the full file structure.
15‘Project Folder
Setting’ tab
‘Browse’ button
Figure 11. Calculator ‘Project Folder Setting’ tab for selecting the GUI Workspace folder
Click on the ‘Project Folder Setting’ tab, then click on the ‘Browse’ button and select the GUI Workspace
on the machine where the data folder and output folder will be created (Figure 11).
Note: Make sure the folder selected for the GUI Workspace is empty and the user has permission of read
and write in the folder.
Note: Make sure the folder location is NOT in the same folder where the tool was installed.
Before every run make sure to check that the GUI Workspace folder is selected; when selected that
should be displayed in the text control box.
3.2.1 Inputs for Vessel Transit Total
The Vessel Transit Total integrates the modeled number of encounters calculated for each 1 km2 block
along the vessel transit from a selected port to a wind farm area into a combined number of predicted
encounters along the entire vessel transit track. See Section 4.1 of the associated report1 for further
discussion regarding GUI inputs and model formulas.
Note that the Calculator determines the expected values along only one round-trip (out and back) vessel
transit track to a wind farm area per run although this track may be composed of multiple vessels using
that track. If the user needs to calculate for more than one vessel transit track, the track should be run
separately and then the user aggregates the values either manually by summing up the output from
individual scenarios or through use of the Aggregator module (See Section 3.3).
16After selection the output folder, proceed to set the parameters for the scenario:
1. The project name (Figure 12) helps in aggregating the scenarios together with similar parameters.
The project name is optional but highly recommended. In case no project name is assigned an
output file will have a ‘temp’ attached to the filename instead of the project name and temp files
are replaced with similar name files from previous scenarios; therefore, it is always recommended
to use a unique Project Name to ensure files are not overwritten. When choosing a project name,
do not include an underscore (_) in the name or the characters after the underscore will not be
recognized in the Aggregator Module (Section 3.3).
2. Select the desired wind farm area that the vessels will transit to from the drop-down list under the
‘Transit Monthly’ tab (Figure 12). Selecting the wind farm (i.e., Wind Energy / Planning Area,
Call Area, Lease Area, actual wind farm, etc.) destination narrows down the list of pre-
programmed tracks available.
Note: the wind farm areas available for selection are data from the BOEM Renewable Energy
GIS Data (BOEM_Lease_Areas_4_13_2020 and BOEM_Wind_Planning_Areas_4_13_2020).
Appendix A provides a table with the project names and lease numbers that is included in the
GIS data used. Additional project boundaries may be included within an existing lease boundary.
Note however, the user can also draw their own vessel transit track to model specific vessel
transit scenarios (See Section 3.4).
3. Once the wind farm destination is selected, in the same dialog box, click the ‘Select Track Line’
button to get to the pre-drawn ‘Track Line’ selection screen (Figure 12). Figures illustrating the
various pre-drawn Track Lines are included in Appendix B.
‘Transit Monthly’
Tab
‘Select Wind
Farm’ dropdown
‘Select Track Line’
Button
Figure 12. Calculator GUI ‘Transit Monthly’ tab for starting vessel transit total. Enter the wind
farm destination area, then select the available track line for the destination area
chosen.
174. Select a pre-drawn Track line from the drop-down and select the ‘Select Vessel Parameters’
button (Figure 13).
‘Select Track Line’
dropdown
‘Select Vessel
Parameters’ button
Figure 13. Track line select tab in vessel transit total
Vessel Parameters
Once the transit route is selected, the vessel parameters screen (Figure 14) lets users select the vessel
types to model, vessel speeds, and month of operation. Variable vessel speeds and months cannot be
selected but can be modeled independently under different scenarios for aggregation using the Aggregator
module (Section 3.3). To use this screen:
1. Select the month from the drop-down list (Figure 14).
2. Select the vessel categories from the drop-down list (Figure 14). Users need to select at least one
vessel category to calculate the encounter risk; multiple vessels may be run simultaneously but
the encounter numbers are pooled among all vessels selected. The typical scenario could range
from a single vessel run to a large number of vessels run in all the categories within the selected
month to get the aggregate strike risk of all vessels selected for that month.
3. Vessel speeds is same for the whole transit. All the speeds are initially filled by default values
based on each vessel category, though the Calculator lets users change these values accordingly
for running various scenarios.
4. Users can select the aversion coefficient for each vessel category by sliding the slider for each
vessel category to incorporate in the strike risk calculations (Figure 14), from aversion 0% of the
time to 100% of the time.
18Important Note: Vessel Speed and Encounter Rate Relationship
Reduction in vessel speed automatically results in an increased encounter number because the
vessel will now be spending more time in any unit (1 km2) area, creating more encounters.
However, it is recognized and supported in the literature that reduction in speed can mitigate
vessel strikes because of increased opportunity for aversions. Consequently, it is strongly
recommended that the User employ their best professional judgement and utilize, as desired, to
modify aversion using controls in the GUI to revise a given scenario to account for the real-
world possibility of aversion success (both by vessel and animal) especially when reducing
vessel speed.
5. The number of trips can be representative of the number of trips within any time period of interest
within the month chosen. Users are required to select at least one trip in either vessel category to
calculate strike risk. Users may select the number of trips in each vessel category chosen that
transits between a port and a wind farm area, transits within the wind farm area, and returns to
port. One trip within a route from a port is counted as one complete round trip.
6. After entering the desired Vessel Parameters, click the ‘Select Animal Parameters’ button
(Figure 14).
19‘Select
Month’
drop-down
list
‘Vessel
Category’
drop-down
lists
Vessel
‘Aversion
Coefficients’
sliders
‘Select
Animal
Parameters’
button
Figure 14. Vessel parameter screen to enter vessel parameters and their number of trips in the vessel transit total
20The animal Parameters screen (Figure 15) lets users select the animal species and their activity category
in that region; to use this screen:
1. Select the desired species from the drop-down list (Figure 15). Based on the selected species the
other parameters get default values. Only one species may be used at a time. To assess the
combined risk of multiple species, different scenarios, each with the desired species, must be run
separately and then those encounter risks summed manually or the scenarios organized under a
common project name for summation by the Aggregator module.
2. The animal population parameter lets users select the percentage of the population within each
activity category (Figure 15).
a) Foraging: the percentage of the marine mammal population in foraging activity can be
adjusted using the slider bar, though the foraging and migrating population sums to 100
minus population of calf rearing and surface-active groups (SAG). The foraging percent
for sea turtle species is set to 100.
b) Migrating: the percentage of the population in migrating activity can be adjusted using
and slider bar and like foraging. The slider moves automatically to adjust the other values
and always sums up to 100.
c) Calf rearing: The population percentage is fixed and is displayed in the text box based on
the species. This can, however, be changed by going in the data file and replacing the
number. More detail in Section 3.3.
d) SAG (Surface Active Group): SAG activity only applies to North Atlantic right whale
species in the Northeast and Mid-Atlantic zones and the population percentage number is
fixed. Here again, the population percentage can be changed by going into the data file
and replacing the number. More detail in Section 3.3.
3. Users can select the animal aversion coefficient for the species by sliding the slider (Figure 15) to
incorporate in the strike risk calculations (0 = no aversion [strike occurs]; 100 = full aversion
[no possibility of a strike]).
4. After entering the desired information, click the ‘Calculate Expected Encounter’ button
(Figure 15). This provides the round-trip expected number of animal strikes for that scenario,
adjusted by the aversion factor selection.
IMPORTANT NOTE:
To obtain just the expected number of encounters in the transit to and from the selected wind
farm area the aversion factors for BOTH vessels and animal (below) must be set to zero.
Otherwise, aversion can reduce the number of encounters and the returned value from the
Calculator and becomes more of a risk assessment than simply a count of encounters. While
setting aversion to 0 can be taken to simply mean the expected number of encounters it also
represents the highest potential estimate of strikes because with 0 aversion, every encounter
could be considered a strike.
21‘Species’
drop-down
list
‘Animal
Aversion’
slider
‘Calculate
Expected
Encounter’
button
Figure 15. Animal parameters screen to enter foraging, migration, SAGs and calf/cow
percentages, along with likelihood of animal aversion
The Calculator will go through the calculations of the strike risk with the selected species along the
selected vessel transit track for all the vessels selected by the user recursively and provide the output,
expected number of animal strikes along the route as a message box.
Figure 16 is an example screenshot of the total expected number of animal encounters; which with
aversions all set to zero, is also the number in which there is a likelihood of a strike. The number of
encounters for the user-defined scenario is displayed in this output box once computations are complete.
Setting all aversion (vessels and animal) to zero results in the most conservative (highest) strike
estimation.
Figure 16. Message box showing the output for vessel transit total
22The Calculator provides detailed output in two formats:
1. Table format: The Calculator creates a table output as a text file (Table 1). The file contains the
expected encounter values for each 1 km block of the track starting from port to the wind farm.
The file shows the contribution of each vessel category in expected encounter and also provides
cumulative expected encounter value for each 1 km2 block. The expected number of strikes
during the whole transit is shown at the bottom of the file. This text file can easily be formatted
into an Excel table by using the import wizard as shown in Table 2.
2. Heat map (Figure 17): The Calculator produces encounter risk-based heat maps that correspond
to the scenario tabular data, displayed in a geographic context that is color-scaled for the range of
expected encounter values for each 1 km block of the track starting from port to the wind farm.
These values are stored in the geodatabase located in GUI workspace output folder.
The Calculator-generated naming convention used for storing geospatial files where T stands for Transit
is structured as follows to keep it segregated from wind farm solutions:
T_Project Name_Port_Wind Farm_route#_Species_month.txt 6
6
The operator’s Windows operating system must be set up to show the file name extension to show the .txt portion
of the file name or no .txt will be shown in the file name; either way, the file type will be shown as text file.
23Table 1. Monthly Vessel transit total example table format output text file
Project Name = solotest_20201227
Track Route = NewHaven_BayStateWind_route50
Month = February
Species = Humpback whale
Foraging percentage = 10, Migrating percentage = 85, Cow/Calf percentage = 5.0, SAG percentage = 0.0
Animal Aversion = 0
High Speed Transfer,Lmtd Mobility or Companion,Mooring/Anchor & Eqpmt Handler,Multipurpose
Offshore,Survey,Cable & Similar,Large Lmtd Mobility,
number of trips:10,10,5,5,5,5,0,
Inshore Speed: 25,14,15,12,30,18,0,
Open Ocean Speed: 25,14,15,12,30,18,0,
Wind Farm Speed: 25,14,15,12,30,18,0,
Vessel Aversion: 0,0,0,0,0,0,0,
0.00118,0.00174,0.00243,0.00297,0.00223,0.00408,0.0,0.08781,
0.00118,0.00174,0.00243,0.00297,0.00223,0.00408,0.0,0.08781,
0.00118,0.00174,0.00243,0.00297,0.00223,0.00408,0.0,0.08781,
0.00118,0.00174,0.00243,0.00297,0.00223,0.00408,0.0,0.08781,
0.00118,0.00174,0.00243,0.00297,0.00223,0.00408,0.0,0.08781,
0.00118,0.00174,0.00243,0.00297,0.00223,0.00408,0.0,0.08781,
0.00118,0.00174,0.00243,0.00297,0.00223,0.00408,0.0,0.08781,
0.00118,0.00174,0.00243,0.00297,0.00223,0.00408,0.0,0.08781,
0.00118,0.00174,0.00243,0.00297,0.00223,0.00408,0.0,0.08781,
0.00118,0.00174,0.00243,0.00297,0.00223,0.00408,0.0,0.08781,
0.00101,0.0015,0.00209,0.00256,0.00191,0.00351,0.0,0.07545,
0.00101,0.0015,0.00209,0.00256,0.00191,0.00351,0.0,0.07545,
0.00101,0.0015,0.00209,0.00256,0.00191,0.00351,0.0,0.07545,
0.00101,0.0015,0.00209,0.00256,0.00191,0.00351,0.0,0.07545,
0.00101,0.0015,0.00209,0.00256,0.00191,0.00351,0.0,0.07545,
0.00101,0.0015,0.00209,0.00256,0.00191,0.00351,0.0,0.07545,
0.00101,0.0015,0.00209,0.00256,0.00191,0.00351,0.0,0.07545,
0.00101,0.0015,0.00209,0.00256,0.00191,0.00351,0.0,0.07545,
0.00101,0.0015,0.00209,0.00256,0.00191,0.00351,0.0,0.07545,
0.00101,0.0015,0.00209,0.00256,0.00191,0.00351,0.0,0.07545,
0.00053,0.00078,0.00109,0.00134,0.001,0.00183,0.0,0.03942,
0.00072,0.00107,0.00149,0.00182,0.00137,0.0025,0.0,0.05387,
0.00072,0.00107,0.00149,0.00182,0.00137,0.0025,0.0,0.05387,
0.00072,0.00107,0.00149,0.00182,0.00137,0.0025,0.0,0.05387,
0.00072,0.00107,0.00149,0.00182,0.00137,0.0025,0.0,0.05387,
0.00072,0.00107,0.00149,0.00182,0.00137,0.0025,0.0,0.05387,
0.00072,0.00107,0.00149,0.00182,0.00137,0.0025,0.0,0.05387,
0.00072,0.00107,0.00149,0.00182,0.00137,0.0025,0.0,0.05387,
0.00072,0.00107,0.00149,0.00182,0.00137,0.0025,0.0,0.05387,
0.00072,0.00107,0.00149,0.00182,0.00137,0.0025,0.0,0.05387,
0.00072,0.00107,0.00149,0.00182,0.00137,0.0025,0.0,0.05387,
0.00074,0.00109,0.00153,0.00187,0.0014,0.00256,0.0,0.05515,
0.00074,0.00109,0.00153,0.00187,0.0014,0.00256,0.0,0.05515,
0.00074,0.00109,0.00153,0.00187,0.0014,0.00256,0.0,0.05515,
0.00074,0.00109,0.00153,0.00187,0.0014,0.00256,0.0,0.05515,
0.00074,0.00109,0.00153,0.00187,0.0014,0.00256,0.0,0.05515,
240.00074,0.00109,0.00153,0.00187,0.0014,0.00256,0.0,0.05515,
0.00074,0.00109,0.00153,0.00187,0.0014,0.00256,0.0,0.05515,
0.00074,0.00109,0.00153,0.00187,0.0014,0.00256,0.0,0.05515,
0.00074,0.00109,0.00153,0.00187,0.0014,0.00256,0.0,0.05515,
0.00074,0.00109,0.00153,0.00187,0.0014,0.00256,0.0,0.05515,
0.00086,0.00127,0.00177,0.00217,0.00162,0.00298,0.0,0.06403,
0.00086,0.00127,0.00177,0.00217,0.00162,0.00298,0.0,0.06403,
0.00086,0.00127,0.00177,0.00217,0.00162,0.00298,0.0,0.06403,
0.00086,0.00127,0.00177,0.00217,0.00162,0.00298,0.0,0.06403,
0.00086,0.00127,0.00177,0.00217,0.00162,0.00298,0.0,0.06403,
0.00086,0.00127,0.00177,0.00217,0.00162,0.00298,0.0,0.06403,
0.00086,0.00127,0.00177,0.00217,0.00162,0.00298,0.0,0.06403,
0.00086,0.00127,0.00177,0.00217,0.00162,0.00298,0.0,0.06403,
0.00086,0.00127,0.00177,0.00217,0.00162,0.00298,0.0,0.06403,
0.00086,0.00127,0.00177,0.00217,0.00162,0.00298,0.0,0.06403,
0.00106,0.00156,0.00218,0.00266,0.00199,0.00365,0.0,0.07862,
0.00106,0.00156,0.00218,0.00266,0.00199,0.00365,0.0,0.07862,
0.00106,0.00156,0.00218,0.00266,0.00199,0.00365,0.0,0.07862,
0.00106,0.00156,0.00218,0.00266,0.00199,0.00365,0.0,0.07862,
0.00106,0.00156,0.00218,0.00266,0.00199,0.00365,0.0,0.07862,
0.00106,0.00156,0.00218,0.00266,0.00199,0.00365,0.0,0.07862,
0.00106,0.00156,0.00218,0.00266,0.00199,0.00365,0.0,0.07862,
0.00106,0.00156,0.00218,0.00266,0.00199,0.00365,0.0,0.07862,
0.00106,0.00156,0.00218,0.00266,0.00199,0.00365,0.0,0.07862,
0.00106,0.00156,0.00218,0.00266,0.00199,0.00365,0.0,0.07862,
0.00112,0.00165,0.0023,0.00281,0.00211,0.00386,0.0,0.08306,
0.00112,0.00165,0.0023,0.00281,0.00211,0.00386,0.0,0.08306,
0.00112,0.00165,0.0023,0.00281,0.00211,0.00386,0.0,0.08306,
0.00112,0.00165,0.0023,0.00281,0.00211,0.00386,0.0,0.08306,
0.00112,0.00165,0.0023,0.00281,0.00211,0.00386,0.0,0.08306,
0.00112,0.00165,0.0023,0.00281,0.00211,0.00386,0.0,0.08306,
0.00112,0.00165,0.0023,0.00281,0.00211,0.00386,0.0,0.08306,
0.00112,0.00165,0.0023,0.00281,0.00211,0.00386,0.0,0.08306,
0.00112,0.00165,0.0023,0.00281,0.00211,0.00386,0.0,0.08306,
0.00112,0.00165,0.0023,0.00281,0.00211,0.00386,0.0,0.08306,
0.00118,0.00174,0.00243,0.00298,0.00223,0.00408,0.0,0.08783,
0.00118,0.00174,0.00243,0.00298,0.00223,0.00408,0.0,0.08783,
0.00118,0.00174,0.00243,0.00298,0.00223,0.00408,0.0,0.08783,
0.00118,0.00174,0.00243,0.00298,0.00223,0.00408,0.0,0.08783,
0.00118,0.00174,0.00243,0.00298,0.00223,0.00408,0.0,0.08783,
0.00118,0.00174,0.00243,0.00298,0.00223,0.00408,0.0,0.08783,
0.00118,0.00174,0.00243,0.00298,0.00223,0.00408,0.0,0.08783,
0.00118,0.00174,0.00243,0.00298,0.00223,0.00408,0.0,0.08783,
0.00118,0.00174,0.00243,0.00298,0.00223,0.00408,0.0,0.08783,
0.00118,0.00174,0.00243,0.00298,0.00223,0.00408,0.0,0.08783,
0.00106,0.00156,0.00218,0.00267,0.002,0.00366,0.0,0.07871,
0.00106,0.00156,0.00218,0.00267,0.002,0.00366,0.0,0.07871,
0.00106,0.00156,0.00218,0.00267,0.002,0.00366,0.0,0.07871,
0.00106,0.00156,0.00218,0.00267,0.002,0.00366,0.0,0.07871,
0.00106,0.00156,0.00218,0.00267,0.002,0.00366,0.0,0.07871,
0.00106,0.00156,0.00218,0.00267,0.002,0.00366,0.0,0.07871,
250.00106,0.00156,0.00218,0.00267,0.002,0.00366,0.0,0.07871,
0.00106,0.00156,0.00218,0.00267,0.002,0.00366,0.0,0.07871,
0.00106,0.00156,0.00218,0.00267,0.002,0.00366,0.0,0.07871,
0.00106,0.00156,0.00218,0.00267,0.002,0.00366,0.0,0.07871,
0.00108,0.0016,0.00223,0.00273,0.00204,0.00374,0.0,0.08048,
26Table 2. Monthly Vessel transit total example table converted using Excel Import Wizard
Project Name = solotest_20201227 Column1 _1 _2 _3 _4 _5 _6
Track Route =
NewHaven_BayStateWind_route50
Month = February
Species = Humpback whale
Migrating Cow/Calf SAG percentage
Foraging percentage = 10
percentage = 85 percentage = 5.0 = 0.0
Animal Aversion = 0
Lmtd Mobility or Mooring/Anchor Multipurpose Large Lmtd
High Speed Transfer Survey Cable & Similar
Companion & Eqpmt Handler Offshore Mobility
Number of trips:10 10 5 5 5 5 0
Inshore Speed: 25 14 15 12 30 18 0
Open Ocean Speed: 25 14 15 12 30 18 0
Wind Farm Speed: 25 14 15 12 30 18 0
Vessel Aversion: 0 0 0 0 0 0 0
0.00118 0.00174 0.00243 0.00297 0.00223 0.00408 0 0.08781
0.00118 0.00174 0.00243 0.00297 0.00223 0.00408 0 0.08781
0.00118 0.00174 0.00243 0.00297 0.00223 0.00408 0 0.08781
0.00118 0.00174 0.00243 0.00297 0.00223 0.00408 0 0.08781
0.00118 0.00174 0.00243 0.00297 0.00223 0.00408 0 0.08781
0.00118 0.00174 0.00243 0.00297 0.00223 0.00408 0 0.08781
0.00118 0.00174 0.00243 0.00297 0.00223 0.00408 0 0.08781
0.00118 0.00174 0.00243 0.00297 0.00223 0.00408 0 0.08781
0.00118 0.00174 0.00243 0.00297 0.00223 0.00408 0 0.08781
0.00118 0.00174 0.00243 0.00297 0.00223 0.00408 0 0.08781
0.00101 0.0015 0.00209 0.00256 0.00191 0.00351 0 0.07545
0.00101 0.0015 0.00209 0.00256 0.00191 0.00351 0 0.07545
0.00101 0.0015 0.00209 0.00256 0.00191 0.00351 0 0.07545
0.00101 0.0015 0.00209 0.00256 0.00191 0.00351 0 0.07545
0.00101 0.0015 0.00209 0.00256 0.00191 0.00351 0 0.07545
0.00101 0.0015 0.00209 0.00256 0.00191 0.00351 0 0.07545
0.00101 0.0015 0.00209 0.00256 0.00191 0.00351 0 0.07545
0.00101 0.0015 0.00209 0.00256 0.00191 0.00351 0 0.07545
27Project Name = solotest_20201227 Column1 _1 _2 _3 _4 _5 _6
0.00101 0.0015 0.00209 0.00256 0.00191 0.00351 0 0.07545
0.00101 0.0015 0.00209 0.00256 0.00191 0.00351 0 0.07545
0.00053 0.00078 0.00109 0.00134 0.001 0.00183 0 0.03942
0.00072 0.00107 0.00149 0.00182 0.00137 0.0025 0 0.05387
0.00072 0.00107 0.00149 0.00182 0.00137 0.0025 0 0.05387
0.00072 0.00107 0.00149 0.00182 0.00137 0.0025 0 0.05387
0.00072 0.00107 0.00149 0.00182 0.00137 0.0025 0 0.05387
0.00072 0.00107 0.00149 0.00182 0.00137 0.0025 0 0.05387
0.00072 0.00107 0.00149 0.00182 0.00137 0.0025 0 0.05387
0.00072 0.00107 0.00149 0.00182 0.00137 0.0025 0 0.05387
0.00072 0.00107 0.00149 0.00182 0.00137 0.0025 0 0.05387
0.00072 0.00107 0.00149 0.00182 0.00137 0.0025 0 0.05387
0.00072 0.00107 0.00149 0.00182 0.00137 0.0025 0 0.05387
0.00074 0.00109 0.00153 0.00187 0.0014 0.00256 0 0.05515
0.00074 0.00109 0.00153 0.00187 0.0014 0.00256 0 0.05515
0.00074 0.00109 0.00153 0.00187 0.0014 0.00256 0 0.05515
0.00074 0.00109 0.00153 0.00187 0.0014 0.00256 0 0.05515
0.00074 0.00109 0.00153 0.00187 0.0014 0.00256 0 0.05515
0.00074 0.00109 0.00153 0.00187 0.0014 0.00256 0 0.05515
0.00074 0.00109 0.00153 0.00187 0.0014 0.00256 0 0.05515
0.00074 0.00109 0.00153 0.00187 0.0014 0.00256 0 0.05515
0.00074 0.00109 0.00153 0.00187 0.0014 0.00256 0 0.05515
0.00074 0.00109 0.00153 0.00187 0.0014 0.00256 0 0.05515
0.00086 0.00127 0.00177 0.00217 0.00162 0.00298 0 0.06403
0.00086 0.00127 0.00177 0.00217 0.00162 0.00298 0 0.06403
0.00086 0.00127 0.00177 0.00217 0.00162 0.00298 0 0.06403
0.00086 0.00127 0.00177 0.00217 0.00162 0.00298 0 0.06403
0.00086 0.00127 0.00177 0.00217 0.00162 0.00298 0 0.06403
0.00086 0.00127 0.00177 0.00217 0.00162 0.00298 0 0.06403
0.00086 0.00127 0.00177 0.00217 0.00162 0.00298 0 0.06403
0.00086 0.00127 0.00177 0.00217 0.00162 0.00298 0 0.06403
0.00086 0.00127 0.00177 0.00217 0.00162 0.00298 0 0.06403
0.00086 0.00127 0.00177 0.00217 0.00162 0.00298 0 0.06403
28You can also read