Model of User Data Analysis Complex for the Management of Diverse Web Projects during Crises - MDPI
←
→
Page content transcription
If your browser does not render page correctly, please read the page content below
Article
Model of User Data Analysis Complex for the
Management of Diverse Web Projects during Crises
Solomiia Fedushko 1,*, Oleg Mastykash 2, Yuriy Syerov 1 and Tomas Peracek 3
 1 Social Communication and Information Activity Department, Lviv Polytechnic National University,
   79000 Lviv, Ukraine; yurii.o.sierov@lpnu.ua
 2 Applied Mathematics Department, Lviv Polytechnic National University, 79000 Lviv, Ukraine;

   oleh.v.mastykash@lpnu.ua
 3 Faculty of Management, Comenius University in Bratislava, 81499 Bratislava, Slovakia;

   tomas.peracek@fm.uniba.sk
 * Correspondence: solomiia.s.fedushko@lpnu.ua

 Received: 10 November 2020; Accepted: 17 December 2020; Published: 20 December 2020

 Abstract: This article discusses the relevant task of analyzing user data in the process of managing
 various web projects. The results of this analysis will help to improve the management of diverse
 web projects during crises. The authors explore the concept of data heterogeneity in web projects,
 classify web projects by function and purpose, and analyze the search models and data display in
 web projects. The proposed algorithms for analyzing user data in the process of managing diverse
 web projects will improve the structuring and presentation of data on the web project platform. The
 model user data analysis complex developed by the authors will simplify the process of managing
 various web projects during crises.

 Keywords: diverse web project; web project management; data analysis; user; heterogeneous data

1. Introduction
      Web projects are mainly decentralized, unpredictable, multi-layered and difficult to manage.
Web project managers are constantly improving their functionality and consolidating a huge amount
of disparate user data. It is for these reasons that the management of large web projects during crises
is difficult. Therefore, it is necessary to research the current scientific guidelines of web project
analysis, paying closer attention to the approaches and complexities of identifying user data, and the
methods of diverse web project management.
      Considering the significant practical and theoretical results of research in related fields, web
projects should be analyzed as heterogeneous data environments [1–6] and as content sources [7–10].
As conventional messaging and news-distribution-oriented web projects are gradually being
transformed into video hosting with the ability to stream video online in real time [11–14], the speed
of information is measured in seconds. Therefore, the development of new practices and
management methods of diverse web projects during crises is an important task. A detailed analysis
of all the factors and influences that affect the management of web projects during crises [15,16] will
allow us to predict the direction of web service development and the key threats in the process of
web project management [17–20]. There are many different solutions for data discovery and analysis
in web projects. However, the task of forming methods and tools for the adaptive analysis of
heterogeneous interconnected databases in web projects (in a constantly changing data structure)
stands unresolved. All available web project analysis techniques [21–26] only partially solve the
problem of collecting information from such environments.
      Analyzing web projects is a rather complex task, the implementation of which does not have a
defined solution. The main reason for the complexity of web project analysis is the large volume,

Appl. Sci. 2020, 10, 9122; doi:10.3390/app10249122                           www.mdpi.com/journal/applsci
Appl. Sci. 2020, 10, 9122 2 of 12
diversity and heterogeneity of their data. The diverse web project heterogeneity can be attributed to
the complexity of the environment structure, which has all the necessary functionality for the
exchange of interconnected and multilayered data.
2. Materials and Methods
A web project platform [22] is a platform that provides functionality for users to communicate
and allows them to be grouped according to web project. A web project is a group of users [20] who
are functionally integrated within the platform, such as communities, friends, events, fan clubs, etc.
To study various web projects, we selected six main types of web projects and described their main
characteristics.
The six main types of web projects are described in Table 1.
Table 1. Types of web projects.
Example of an Active
Web Project Type Characteristic
Web Project
HGTV Discussion
Information web Created for people who are looking for
Forums, Do-It-Yourself
projects solutions to various problems.
Community
Allow communication between users through
Web projects for text and graphical information (messages, Facebook, Twitter,
communication posts, comments, publications, news, photos, Google+, Bado
videos), forming communities.
Focused on the distribution and exchange of
multimedia content. This type of platform
Multimedia web YouTube, Flickr, Shots,
allows users to upload their own videos,
projects Periscope, Instagram
process them, track their statistics and watch
other users’ videos.
Designed to quickly integrate users of web The Student Room
Educational web
projects into the learning process. These Group, ePALS School
projects
communities have specialized functionality. Blog
Created to promote career growth for users. A
community member’s profile is presented in
the form of a resume, which allows recruitment
specialists to directly assess the level of LinkedIn, Xing, Sumry,
Professional web
qualification and compliance with vacancies in ResearchGate,
projects
companies. Users can use infographics to Academia.edu
display their career history. Professional
communities also include academic web
communities.
Focused on the accumulation of diverse data.
Figshare, Open Science
Diverse web These web projects are a knowledge base or
Framework, Mendeley
projects repository of diverse information (photos,
Data, Zenodo
videos, mp3s, games, text, etc.)
The developed classification was formed according to the purpose of each diverse web project.
However, the automated analysis of user page data, the standardization of platform content, the
ability to access user data, the data presentation architecture, and crisis factors in web project
management are all equally important indicators. In different web projects of the same group of
communities, these indicators may differ dramatically.
The ability to identify each user is one of the most important features of a web project. In order
to be a full participant in a web project, one must register in this environment as a user. The procedure
for registering a new user involves filling in the user’s personal data. A personal profile with contactAppl. Sci. 2020, 10, 9122 3 of 12
data of the registered person is then created, along with a unique profile identifier and functionality
for communication with other users in this environment.
3. Methods and Techniques of Data Collection
The functionality and interface of diverse web projects are usually standardized [26], which
provides minimal variability in page design for optimal perception and input of user data, such as
personal data and content [15,25,27]. George Ritzer [28] has studied the notion of the
“McDonaldization” of society and the internet through four main components: efficiency,
calculability, predictability and control. The policy of data validation between individual web
projects is also only informally agreed upon [6]. In addition, in order to avoid complex situations that
provoke the emergence and deepening of crisis situations, administrators monitor the reality of
posted photos and other media content, blocking the pages of users who upload misleading content.
A feature of most web projects is the maximum correspondence of the user’s profile data to their
personal data and servitization [29–34]. In web projects, users are registered under their real names,
upload photos and videos in which they are depicted [35,36], and virtually communicate with friends
and people they know in real life.
A diverse web project has the following characteristics [9]:
• Discretion (user profiles are separate and linked).
• Similarity (web project profile characteristics are identical).
• Proximity (links between user profiles are in a single space-time cycle).
• Reciprocity (interaction between user profiles is symmetrical, which is one of the prerequisites
for the exchange of resources and information).
The diverse web project presentation model (Figure 1) sets the web project data display template
and selects the technology for presenting this data.
Figure 1. General diagram of the structure of connections between users of a diverse web project.
The areas where users can publish discussions are set by this model. These areas can be any of
the following: user pages, group pages, a dedicated part of a page, special pages, etc. The rules of
message distribution are also set by the presentation model; for example, one user’s post can be
placed on their page and can also be distributed on other pages through publications and messages.
This post may be shared by either the author or another user who has access to it. As a result, it isAppl. Sci. 2020, 10, 9122 4 of 12
possible to count each user who distributed the post and to whom it was distributed. One post by
one user can effectively be on many pages (1… *). However the post cannot have multiple authors.
It is also possible to track the importance of a post by receiving the number of messages relevant
to it. Based on the comment functionality, users can rate publications and posts. It is also possible to
build a schedule of a user’s activity by obtaining the number of comments on various posts on
different pages, and other actions.
A competently thought-out visual model with a comprehensive vision of the process of the
diverse web project’s functions will greatly simplify the management of this diverse web project.
The visual model defines the overall look of the diverse web project platform, and it may also
hide some components that are present in the functionality of the project. The rules for combining
page tags, their attributes, and the general appearance of the document object model of the pages are
set with the visual model. Whether the name and values of the attributes will change can be viewed
or set on this model.
Each user node on the platform has its own display. The visual representation of the user profile
looks like Equation (1):
{ }
N
UserView (VP ) = VisualElem j , (1)
j =1
where VisualElem belongs to a set of visual elements displayed on the platform user’s page.
The model of interaction organization of the web project server (2) with the user is organized as
follows:
• Client user (browser or application) accesses the web project platform through the navigation
bar;
• When the user accesses the navigation bar, specific parameters for each community node are
passed;
• Additional information is written in the headers and cookies of the request.
The body of the message records the basic user information needed to identify the user.
Request = < URL, [ variables ] , [ headers ] , [ cookies ] , [user info ] > , (2)
The result of the request is a response from the server to the client. The structure of responses to
customer inquiries is based on the navigation model (3):
Response = < [body ] , [ headers ] , [cookies ] , [ servers info ] > (3)
The answer includes:
• Body, which contains basic user information;
• Headers, which contain meta data about the web project and response;
• Cookies, which preferably contain user identification data, a session ID, and additional content
that is specific to each page of the system—cookies are stored on the client side;
• Server info, which contains specific data of the web project platform.
After forming models for presenting the web project and its information content, the modeling
of the software package for detection and analysis of user data in the web project can begin.
A web project platform consists of interconnected user pages. The visual model allows the
content of the platform page to be presented as a hierarchical tree of nodes that contain all of the data.
Analysis of this data opens the possibility of obtaining comprehensive information about the user of
the platform.
The process of submitting web project data with their subsequent analysis can be divided into
three stages (Figure 2):
• Obtaining information: At this stage the exact information is determined and in what way will
it be received. The raw input information is pre-processed.Appl. Sci. 2020, 10, 9122 5 of 12
• Filtering: Redundant information is discarded, and the input data set for the next stage is built.
• Data structuring: Data is built on the basis of structuring and classification/clustering. Nodes
that carry useful information are selected.
The stages of analysis are in a clearly defined order, are interconnected, and constantly intersect.
The intersection between these stages will be called zones. There are three such zones:
1. Zone 1 is an area where the received information is pre-filtered in order to select key features.
Zone 1 is intermediate between the first and second stages, here the information is converted
into data.
2. During data filtering there is a partial structuring of data and it is necessary to additionally check
the input set for correctness. These processes take place in Zone 2.
3. In Zone 3, data is formatted and supplemented. For correct structuring of the data it may be
necessary to receive additional information, and in this case it is necessary to pass to a stage of
reception of the information. These processes run cyclically until a complete data structure is
obtained. The combination of these three stages forms the concept of data analysis in a web
project.
Figure 2. Components of web project analysis.
The prerequisites for analyzing web communities are as follows:
• Presenting search criteria for relevant information;
• Presenting the algorithm for analyzing the user page on the web project;
• Presenting the algorithm for forming a structural tree of page searches;
• Full access to the functionality of the web project platform for the software;
• Access to the environments of the received information storage for the software.
To implement the conditions, it is necessary:
• To build the functionality for user-submitted input data that will set the search criteria for
information;
• To have the presence of existing research on the structure of the user page in the web project;
• To use third-party libraries and analyze the main nodes of the user page on the web project;
• To build a software authorization mechanism in each web project.
The analysis of each page of the diverse web project is carried out in stages:
• Stage 1. Analysis of web project page headers and metadata.
• Stage 2. Working with page areas. There are four main areas of the page, namely: personal
information, multimedia content, direct links and posts. Since the presented zones are isolatedAppl. Sci. 2020, 10, 9122 6 of 12
and structurally independent units of the page content itself, the analysis of zones is carried out
in several different ways that are parallel to each other.
• Stage 3. Direct retrieval of data from the elements of each zone. The list of elements and metadata
for their analysis must be stored in a database.
• Stage 4. Saving the received data to the database and system resources.
The personal information area contains regions with personal photos of the profile owner. One
way to analyze a photograph is to read the attributes of that photograph in order to obtain its
metadata (e.g., time and date the photograph was created, coordinates). If the recorder has a built-in
GPS receiver and geotagging is enabled at the time the photo was taken, it is also possible to retrieve
the coordinates of where the image was taken.
Detailed analysis of photography can be performed using deep neural network learning
algorithms. The presented software complex uses computer vision, which is used to analyze all
available photos on the user’s profile page. The computer vision algorithms used are based on
technology that represents the visual image in the form of a branched tree-like hierarchical structure,
which accounts for the results of its learning process at the nodes of the tree and retains the
probability of transition to the appropriate level of the tree. This structure is stored as an XML file,
which is processed at every step of the algorithm.
The algorithm of diverse web project page analysis is shown in Figure 3. The basis of the
implemented algorithm is a constructed model of available content.
Figure 3. Algorithm for analyzing the custom content of a diverse web project page.
Special attention should be paid to the analysis of user posts on the diverse web project. The
algorithm for analyzing a diverse web project user message is shown in Figure 4.
Existing algorithms can be used to obtain a page tree of users of this diverse web project, and
their post structure can be obtained in this way. The posts’ addresses will be submitted instead of the
user addresses during the algorithm’s initialization.Appl. Sci. 2020, 10, 9122 7 of 12
Get a link to Generate metadata Send inquiries and
the post and post’ headers receiving answers
Analyze and
Preserve of Answer
structurize of post
structured content analysis
content
Obtain the structure [Error]
of reactions to the
post
Analyze and
Preserve of reactions
structure of reactions
Figure 4. Web project user post analysis.
The organization of links between posts corresponds to the organization of links between users
of the diverse web project. After receiving the data from the web pages of the diverse web project,
they need to be fitted to the desired form by deleting unnecessary information and getting rid of
garbage. These actions are performed at the data filtering stage, before directly saving the information
in the database.
The filtering stage can be divided into three components: normalization, filtering, thinning and
division of the tree into zones.
Normalization and filtering are required to remove information debris, that is, information that
is of no use and is clogging up relevant data for analysis. The initial stage of document normalization
is the verification for compliance and correctness of encoding.
To facilitate the work with the obtained data, they need to be reduced to a standardized form
(case, word structure, removal of extra spaces, removal of repetitions). Next, it is necessary to clean
the data by removing additional tags (, , , ), leaving only the elements
that are directly related to the content.
The data normalization stage stabilizes the data (errors will not arise in the following stages). In
this way, unnecessary information is removed, ensuring better performance in the following steps.
In turn, the filtering stage ensures the removal of unnecessary information. The thinning step reduces
the amount of information to be read by deleting duplicates. Once the data has been thinned and
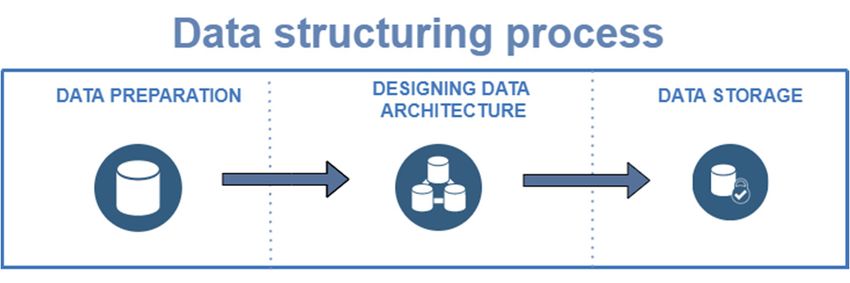
filtered, the next step is the structuring of the data (Figure 5).
Figure 5. Data structuring process.
How well and quickly the page analysis software will work depends heavily on this stage . The
first step is the data submission process.Appl. Sci. 2020, 10, 9122 8 of 12
Data from the text format should be converted to another, more machine-readable, format. These
formats can be XML, JSON, Excel documents, etc.
The developed model of the user data analysis complex for the management of diverse web
projects is a multilevel web service. This complex is built based on the principles of SOLID (object-
oriented computer programming).
The model of the user data analysis complex is shown in Figure 6.
Figure 6. Model of the user data analysis complex for the management of diverse web projects.
The developed model consists of the following layers: visual layer, business layer, data layer,
layer of background processes and support component.
The visual layer helps users to interact with the software-analytical complex with a client
application. The data received from the user on the visual layer will be sent in the form of requests
for the business layer. The visual layer consists of software solutions: web client (submitted by a
website), mobile phone application and desktop application. A web client is a web application built
on the principle of MVC (Model-View-Controller) design pattern. The business layer contains the
main functionality of the software-analytical complex. The basic unit of the business layer is the
essence.
Essence is an element of software that describes a particular type of data and consists of
properties and methods. The essences of the business layer are consequently built with the
methodologies of object-oriented analysis and design and the paradigm of object-oriented
programming. This layer is divided into three levels: the level of controllers, the level of services and
the intermediate level. Requests that come from the client are received and analyzed at the level ofAppl. Sci. 2020, 10, 9122 9 of 12
controllers, which is represented by the set of RESTful: the nature of the controller type, routing
system and security provider.
Query analysis at this level includes the following steps:
• Receiving the request URL by the routing system;
• Forwarding the request to the appropriate controller;
• Query header analysis;
• Identification of the client by the security provider;
• Analysis of the request’s input parameters;
• Forwarding the request further on the stack of calls to functionality and services;
• Calling the appropriate services to form a response to the client.
The level of services is represented by a set of services. A service is an entity that receives a
request from a controller, analyzes it and generates an appeal to an external microservice and to
intermediate-level entities. The level of services is built on the scheme of a standardized design
template facade. The intermediate level is represented by a set of ORM (object-relational mapping)
systems. The main task of the entities of this level is to equalize the differences between object-
oriented programming and functionality designed to store data. The Entity Framework system is
used to work with the database. Entities that represent work with database tables are built on the
principles of the design templates Unit of Work and Repository. The background process layer is an
independent layer, the processes of which work autonomously and independently of the user’s
actions. This layer is represented by a finite set of processes. Each component solves a separate
definite task. The frequency of running each component depends on the event scheduler settings. The
main task of the background process layer is to periodically update the data in the database. The
main advantage of component independence is the ability to expand the functionality of the software
algorithm by adding an additional component. The support component is an additional functionality
that expands the functionality of the system to include data provider and auxiliary microservice. The
data layer is represented by a set of relational databases and resource storage systems. System
resources are stored in separate repositories, which are categorized as multimedia data repositories,
configuration file repositories and document storage.
4. Results and Discussion
The main result of this investigation is the modeling of the process of searching and analyzing
heterogeneous user data to improve the functioning of diverse web projects. This model was tested
by analyzing diverse web projects implemented on popular platforms, namely: Facebook, YouTube,
Instagram, LinkedIn, Pinterest and TikTok.
The following approaches were used for testing:
• Search for user data in diverse platforms of web projects with further consolidation into a single
profile for each user;
• Quantitative analysis of users of each web project platform.
The period of active research on the diverse web project management system was September
2020–November 2020. During this period, a total of 959,485 user profiles of web projects and 7684
web projects were researched and analyzed (see Figure 7 and Table 2), including:
• 347,255 profiles and 2631 web projects on the Facebook platform;
• 293,283 profiles and 1984 web projects on the Instagram platform;
• 90,726 profiles and 797 web projects on the TikTok platform;
• 137,821 profiles and 1395 web projects on the YouTube platform;
• 60,228 profiles and 529 web projects on the LinkedIn platform;
• 30,172 profiles and 348 web projects on the Pinterest platform.
The age of users of diverse web projects was determined by examining the relevant field of the
user’s profile in the area of personal information of the user. If such a field was not provided whenAppl. Sci. 2020, 10, 9122 10 of 12
developing user profiles in a diverse web project, then the age of users was automatically determined
by the system based on the analysis of uploaded personal photos in the user profile.
(a) (b)
Figure 7. Quantitative characteristics of the functioning of the diverse web project management
system: (a) number of diverse web projects, (b) number of web project users.
Table 2. The results of the analysis of the age of users of diverse web projects.
Web Project Platform [≤;17] [18;24] [25;34] [35;44] [45;54] [55;≤] Sum
Facebook 12% 29% 38% 13% 4% 4% 347,255
Instagram 15% 30% 34% 16% 3% 2% 293,283
TikTok 43% 21% 20% 14% 1% 1% 90,726
YouTube 10% 18% 28% 20% 15% 9% 137,821
LinkedIn 8% 19% 39% 26% 5% 3% 60,228
Pinterest 5% 17% 29% 24% 16% 9% 30,172
Total 959,485
Determining the age of the participant by searching and analyzing the data of web project users
helps to reduce the level of conflict in projects where there are age restrictions for users (projects only
for adults/children/adolescents).
5. Conclusions
The unprecedentedly large amount of information available in diverse web projects, the large
number of their users, the complexity of building relationships between users and the extremely wide
scope of diverse web projects have made web project management a complex activity with many
risks and unforeseen critical situations. In this article we analyzed the concept of heterogeneity in
these web projects, and the process of their structuring. Algorithms for user data analysis for
managing various web projects were developed. The developed model of the user data analysis
complex for the management of various web projects represents a multilevel web service. The use of
this model for diverse web project activities will simplify the management process, reduce the cost
of maintaining a community, increase cost-effectiveness, and reduce the number of crisis situations.
Author Contributions: Conceptualization, O.M., S.F., Y.S.; software, O.M., Y.S.; validation, O.M., S.F., Y.S.;
formal analysis, O.M., S.F., Y.S.; investigation, O.M., S.F., Y.S. and T.P.; resources, S.F.; data curation, O.M., S.F.,
Y.S.; writing—original draft preparation, O.M., S.F., Y.S. and T.P.; writing—review and editing, S.F., Y.S.;
visualization, S.F., Y.S.; supervision, T.P.; project administration, S.F. All authors have read and agreed to the
published version of the manuscript.Appl. Sci. 2020, 10, 9122 11 of 12
Funding: This research is supported by National Research Foundation of Ukraine within the project “Science
for the safety of human and society”, grant number 94/01-2020 “Methods of managing the web community in
terms of psychological, social and economic influences on society during the COVID-19 pandemic”.
Conflicts of Interest: The authors declare no conflicts of interest.
References
1. Zhao, T.; Cheng, G.; Liu, H. A partially linear framework for massive heterogeneous data. Ann. Stat. 2016,
44, 1400.
2. Wang, B.; Song, Y.; Sun, Y.; Liu, J. Analysis model for server consolidation of virtualized heterogeneous
data centers providing internet services. Clust. Comput. 2019, 22, 911–928.
3. Loorak, M.H.; Perin, C.; Collins, C.; Carpendale, S. Exploring the possibilities of embedding heterogeneous
data attributes in familiar visualizations. Trans. Vis. Comput. Graph. 2016, 23, 581–590.
4. Tovletoglou, K.; Mukhanov, L.; Nikolopoulos, D.S.; Karakonstantis, G. HaRMony: Heterogeneous-
Reliability Memory and QoS-Aware Energy Management on Virtualized Servers. In Proceedings of the
International Conference on Architectural Support for Programming Languages and Operating Systems,
Providence, RI, USA, 17 December 2020; pp. 575–590.
5. Noor, A.; Jha, D.N.; Mitra, K.; Jayaraman, P.P.; Souza, A.; Ranjan, R.; Dustdar, S. A framework for
monitoring microservice-oriented cloud applications in heterogeneous virtualization environments. In
Proceedings of the 12th International Conference on Cloud Computing (CLOUD), Milan, Italy, 8–13 July
2019; pp. 156–163.
6. Xu, Z.; Liu, Y.; Yen, N.; Mei, L.; Luo, X.; Wei, X.; Hu, C. Crowdsourcing based description of urban
emergency events using social media big data. IEEE Trans. Cloud Comput. 2020, 8, 387–397,
doi:10.1109/TCC.2016.2517638.
7. Izonin, I.; Kryvinska, N.; Tkachenko, R.; Zub, K. An approach towards missing data recovery within IoT
smart system. Procedia Comput. Sci. 2019, 155, 11–18.
8. Shakhovska, N.; Kaminskyy, R.; Zasoba, E.; Tsiutsiura, M. Association rules mining in big data. Int. J.
Comput. 2018, 17, 25–32.
9. Ghani, N.A.; Hamid, S.; Hashem, I.A.T.; Ahmed, E. Social media big data analytics: A survey. Comput. Hum.
Behav. 2019, 101, 417–428.
10. Haustein, S. Grand challenges in altmetrics: Heterogeneity, data quality and dependencies. Scientometrics
2016, 108, 413–423.
11. Castano, S.; de Antonellis, V. Global viewing of heterogeneous data sources. Trans. Knowl. Data Eng. 2001,
13, 277–297.
12. Wang, L. Heterogeneous data and big data analytics. Autom. Control Inf. Sci. 2017, 3, 8–15.
13. Thomas, J.; Sael, L. Overview of Integrative Analysis Methods for Heterogeneous Data. In Proceedings of
the International Conference on Big Data and Smart Computing (BIGCOMP), Jeju, South Korea, 9–11
February 2015; pp. 266–270.
14. Shi, C.; Li, Y.; Zhang, J.; Sun, Y.; Philip, S.Y.A. Survey of heterogeneous information network analysis.
Trans. Knowl. Data Eng. 2016, 29, 17–37.
15. Fedushko, S.; Benova, E. Semantic analysis for information and communication threats detection of online
service users. Procedia Comput. Sci. 2019, 160, 254–259, doi:10.1016/j.procs.2019.09.465.
16. Markovets, O.; Pazderska, R.; Horpyniuk, O.; Syerov Y. Informational Support of Effective Work of the
Community Manager with Web Communities. CEUR Workshop Proc. 2019, 2654, 710–722.
17. Lodhia, S.; Stone, G. Integrated reporting in an internet and social media communication environment:
Conceptual insights. Aust. Account. Rev. 2017, 27, 17–33.
18. Iavich, M.; Gnatyuk, S.; Fesenko, G. Cyber security european standards in business. Sci. Pract. Cyber Secur.
J. 2019, 3, 36–39.
19. Hu, Z., Gnatyuk, S., Okhrimenko, T., Tynymbayev, S., Iavich, M. High-speed and secure PRNG for
cryptographic applications. Int. J. Comput. Netw. Inf. Secur. 2020, 12, 1–10.
20. Wu, Y. J.; Outley, C.; Matarrita-Cascante, D.; Murphrey, T.P. A systematic review of recent research on
adolescent social connectedness and mental health with internet technology use. Adolesc. Res. Rev. 2016, 1,
153–162.
21. Daoust, F. Report from the world wide web consortium. SMPTE Motion Imaging J. 2018, 127, 72–73.Appl. Sci. 2020, 10, 9122 12 of 12
22. Wang, P.; Chaudhry, S.; Li, L.; Cao, X.; Guo, X.; Vogel, D.; Zhang, X. Exploring the influence of social media
on employee work performance. Internet Res. 2016, 26, 529–545.
23. Krishen, A.S.; Berezan, O.; Agarwal, S.; Kachroo, P. The generation of virtual needs: Recipes for satisfaction
in social media networking. J. Bus. Res. 2016, 69, 5248–5254.
24. Hjorth, L.; Hinton, S. Understanding Social Media; SAGE Publications Limited: Thousand Oaks, CA, USA,
2019. p.232.
25. Korzh, R.; Peleshchyshyn, A.; Syerov, Y.; Fedushko, S. Principles of university’s information image
protection from aggression. In Proceedings of the 2016 XIth International Scientific and Technical
Conference Computer Sciences and Information Technologies (CSIT), Lviv, Ukraine, 6–10 September 2016;
pp. 77–79.
26. Rodriguez, F.S.; Pabst, A.; Luck, T.; König, H.-H.; Angermeyer, M. C.; Witte, A. V. Social network types in
old age and incident dementia. J. Geriatr. Psychiatry Neurol. 2018, 31, 163–170.
27. Fedushko, S.; Syerov, Y.; Kolos, S. Hashtag as а way of archiving and distributing information on the
internet. CEUR Workshop Proc. 2019, 2386, 274–286.
28. Ritzer, G. The McDonaldization of Society, 20th ed.; SAGE Publications Limited: Thousand Oaks, CA, USA,
2013; p. 237.
29. Borgatti, S.; Everett, M.; Johnson, J. Analyzing Social Networks; SAGE Publications Limited: Thousand Oaks,
CA, USA, 2018; p. 384.
30. Molnár, E.; Molnár, R.; Kryvinska, N.; Greguš, M. Web intelligence in practice. J. Serv. Sci. Res. 2014, 6,149–
172.
31. Poniszewska-Maranda, A.; Kaczmarek, D.; Kryvinska, N.; Xhafa, F. Studying usability of AI in the IoT
systems/paradigm through embedding NN techniques into mobile smart service system. Computing 2019,
101, 1661–1685, doi:10.1007/s00607-018-0680-z.
32. Kryvinska, N.; Bickel, L. Scenario-based analysis of IT enterprises servitization as a part of digital
transformation of modern economy. J. Appl. Sci. 2020, 10, 1076, doi:10.3390/app10031076.
33. Poniszewska-Maranda, A.; Matusiak, R.; Kryvinska, N. A real-time service system in the cloud. J. Ambient
Intell. Hum. Comput. 2020, 11, 961–977, doi:10.1007/s12652-019-01203-7.
34. Gregus, M.; Kryvinska, N. Service Orientation of Enterprises-Aspects, Dimensions, Technologies; Comenius
University in Bratislava: Bratislava, Slovakia, 2015.
35. Briciu, V.A., Nechita, F., Demeter, R., Kavoura, A. Minding the gap between perceived and projected
destination image by using information and communication platforms and software. Int. J. Comput. Methods
Herit. Sci. 2019, 3, 1–17, doi:10.4018/IJCMHS.2019070101.
36. Balomenou, N.; Garrod, B. Photographs in tourism research: Prejudice, power, performance and
participant-generated images. Tour. Manag. 2019, 70, 201–217, doi:10.1016/j.tourman.2018.08.014.
Publisher’s Note: MDPI stays neutral with regard to jurisdictional claims in published maps and institutional
affiliations.
© 2020 by the authors. Licensee MDPI, Basel, Switzerland. This article is an open access
article distributed under the terms and conditions of the Creative Commons Attribution
(CC BY) license (http://creativecommons.org/licenses/by/4.0/).You can also read