Modern Dataflow in Experimental Nuclear Science and Tcl - Tcl/Tk
←
→
Page content transcription
If your browser does not render page correctly, please read the page content below
Modern Dataflow in Experimental Nuclear
 Science and Tcl
 Ron Fox, Giordano Cerizza, Sean Liddick, Aaron Chester
 National Superconducting Cyclotron Laboratory
 Michigan State University

 A. Nuclear Science with Rare Isotope Beams at NSCL
 Abstract— Advances in nuclear electronics can result in data
rates several orders of magnitude higher than those of traditional, The bulk of experimental nuclear science is done by colliding
legacy electronic systems. Several technical developments are an accelerated beam of ions onto a target or, in the case of
therefore required for both online and offline data handling. colliders, accelerated ions moving the opposite direction. For
Included in those developments is a new Tcl MPI package and the much of the history of experimental nuclear science, the
retrofitting of NSCLSpecTcl to use that package to perform
 accelerated particles have been stable isotopes that are common
massively parallel histogramming.
 in nature.

 Two techniques accelerate isotopes that are not stable;
 I. INTRODUCTION projectile fragmentation [MOR98], and isotope separation
 online (ISOL)[LIN04]. In projectile fragmentation, a stable
T his paper will introduce the types of science done at the
 National Superconducting Cyclotron Laboratory (NSCL).
Analog data acquisition electronics will be described and
 beam strikes a production target conservation of momentum
 implies that the resulting reaction products will continue in the
contrasted with modern “digital” electronics. Modern beam direction with most of the stable beam momentum. A
electronics support experiments that we are not able to reaction product separator then selects the desired isotope
perform with legacy analog electronics. This capability comes which is transported to the experiment. With ISOL, the reaction
at a cost. Digital electronics can result in significantly higher products from the production target are stopped in a thick target,
data rates than legacy analog electronics. chemically extracted and then re-accelerated. The NSCL
 produces its rare isotope beams via projectile fragmentation.
An upcoming experiment at the NSCL focused on decay
spectroscopy will be instrumented with modern digital Rare isotope beams provide for several areas of scientific study
electronics and cannot be performed with traditional that are not possible with stable beams. These include
electronics. This experiment is anticipated to take data at explorations of nuclear structure and shape far from stability.
continuous rates of up to 200MB/sec resulting in an aggregate Furthermore, many of the isotopes we experiment with are
data set of over 100TB of data. The planned online and "near- believed to exist in the dense matter of supernova formed from
line" data flow of this experiment provides challenges stellar core collapse as well is in the crusts of neutron stars.
(pronounced opportunities) to explore methods of handling These environments are where astrophysicists believe that
data both online and "near-line". This experiment will be elements heavier than iron are formed.
described, as well as the data flow and the challenges it
presents.
 B. The NSCL
Massively parallel computing will feature heavily in data for The NSCL is a running experimental facility on the campus of
digital electronics. We have written libraries and frameworks
to support parallel computation that can be easily switched
between threaded parallelism and massively parallel cluster
parallelism. We have also written an extended Tcl shell that
supports massively parallel Tcl driven applications.

 II. THE NSCL AND THE SCIENCE WE DO
 In this section we’ll describe rare isotope experimental
nuclear science performed at the NSCL.

 This work is supported by the National Science Foundation grant
PHY-1565546
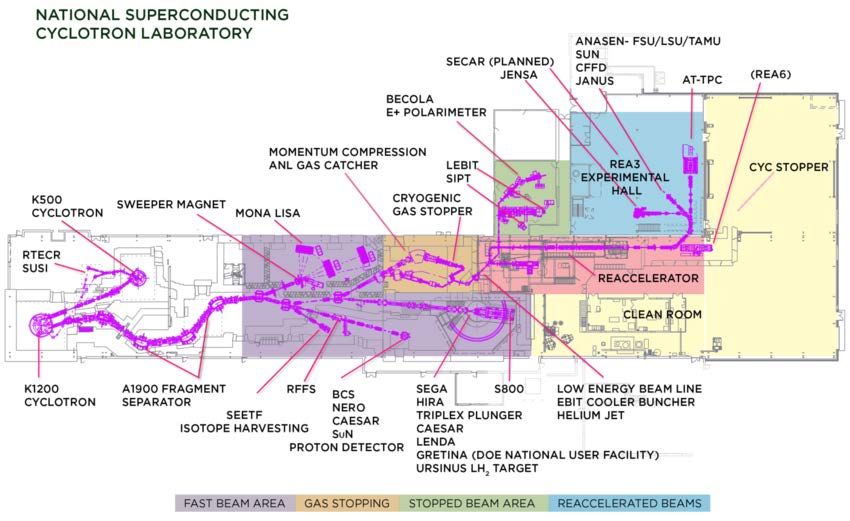
Figure 1 Facility layout for the National Superconducting Cyclotron Laboratory along with many of the available experimental devices. Colors
indicate the energy of the rare isotope delivered to experimental systems in those areas.

Michigan State University. A schematic of the facility is shown The products of nuclear collisions are not directly
in Figure 1. Funding for the operation of the NSCL is provided
by the National Science Foundation.

The coupled cyclotrons at the left of Figure 1 produce stable
primary beams of elements ranging from Oxygen to Uranium
at energies from 80MeV/A to 170MeV/A. The ions from these
stable beams strike a production target, typically Be, near the
entrance of the A1900 fragment separator[Mor03]. The A1900
selects the desired rare isotope which is then transported to one
of several expermiental areas shown to the right of the A1900
in Fig. 1.

 Figure 2 Chart of the nuclides showing beams produced at the
Figure 2 shows a chart of the nuclides with the stable primary NSCL to date.
beams that have been produced and used at the NSCL. The
black squares on that diagram represent stable isotope beams. observable. Instead we rely on the interaction of those products
The gray squares represent unstable beams of rare isotopes. with bulk matter. For example, charged particles passing
Over 900 rare isotope beams have been used in experiments through detectors leave behind an ionization trail due to the
while a total of about 1000 have been produced or observed. Of electrons they knock out of atoms in the detector material. An
these beams 47 have been stopped and used either in stopped electric field can then be used to cause those electrons to drift
beam experiments or reaccelerated low energy experiments. and be collected. The result of this collection is an electric
 pulse.
 These pulses are quite weak and fast, perhaps on the order of
 nanoseconds (10-9 seconds) wide. In traditional “analog”
 systems, these pulses are amplified and shaped into pulses a few
 volts high and perhaps a microseconds across. In a parallel
 electronics path, discriminators are used to convert the analog
 III. DATA ACQUISITION THEN AND NOW pulses into logic pulses that are suitable as inputs to trigger logic
 This section will examine how data taking has evolved in and, with proper timing, as gates to peak sensing or charge
nuclear science. We start by describing how data taking has integrating ADCs. Each of those ADCs produces one value per
been historically done. We then describe advances in pulse and then, only if the pulse lies within the ADC gate. The
electronics that we believe will push our data rates to as much electronics required to condition raw detector signals and time
as two orders of magnitude faster than they are at the NSCL. gates appropriately can be quite complex.
The advent of fast, high resolution flash ADCs (100+ MHz experiment and look at the experimental apparatus. We’ll then
at 14 bits wide) and large FPGAs has made it possible to discard examine the full online and near-line data processing chain and
most of the analog electronics described above, replacing it its performance requirements. Online processing refers to
with flash ADCs and logic and digital signal processing analysis done on the data as it passes through the data
implemented in FPGAs. This results in a simplified signal acquisition system. Near-line data processing refers to analysis
chain for one channel that looks like Figure 3 done during the experiment on data files already acquired.
 Finally we will describe some of the methods we will use to
 meet the performance requirements of those demands. This
 part will segue into the next part which describes in detail
 mpitcl, which provides support for massively parallel
 computing for Tcl based applications.

 A. Experimental aims and setup
 Understanding the interplay between single-particle and
 collective effects is a continuing thrust in nuclear science to
 address questions articulated in the recent long range plan
 Figure 3Modern digital electronics chain
 regarding the organization of subatomic matter and the
 emergence of simple patterns in complex nuclei. The relative
 In this design, the FADC is continuously digitizing. When energies between different single-particle orbits is a continuing
the FPGA determines a trigger condition has occurred, it can question and the size of the energy gap located at a neutron
look back in time at the samples recorded to ensure the full number of N = 50 shell gap is of interest for its role in the r-
signal pulse is captured. This ability to look back in time at a process [Bar08] and nuclear existence [Erl12]. The energy gap
digitized waveform eliminates most, if not all signal timing can be probed by identifying nuclear states corresponding to the
delays. The FPGA can then perform the peak sensing and peak normal filling of single-particle levels and those that involved
integration operations performed by early analog digitizers. If an excitation of neutrons across the N = 50 energy gap. The
needed, the full signal trace is also available for further coexistence of such states at similar excitation energies has
processing. These electronics chains are called digital been observed in the 80Ge nucleus [Got16]. The two types of
electronics by experimental nuclear scientists because the states to be studies both have a spin and parity of 0+ and can be
FADC and FPGA replace what used to be complex chains of populated through the beta decay of a neutron-rich 80Ga
analog electronics. nucleus. The beta-decay process will turn a neutron in 80Ga
 It is the ability, and sometimes need, to capture signal traces into a proton and convert it to 80Ge while populating a range of
that inflates the bandwidth and storage requirements of modern excited nuclear states that will subsequently decay emitting
nuclear science experiments. Instead of providing one or two photons or, potentially, electrons.
values for each event or each channel, each channel may Rare isotope research facilities such as the NSCL can create
provide 100 or more trace samples depending on the length of these neutron rich nuclei and allow researchers to perform
the capture interval and the frequency of the FADC. The ability experiments with them.
to capture traces allows us to perform experiments that are not E17011 examines the properties of 80Ge, a neutron rich
possible otherwise. isotope of Germanium. A beam of 80Ga( neutron-rich
 While a typical NSCL experiment lasts one week and Gallium) will be brought to rest in a monolithic CeBr3 (Cerium
captures between 10GB and 10TB of data, we anticipate that Bromide) scintillator detector read out with a 16 by 16 pixelated
experiments with digital electronics that same week will photomultiplier detector.
capture between 1TB and 1PB of raw data. Furthermore, The β- emitted by the decay of 80Ga will result in a pulse in
during an experiment it’s important to process this data online the CeBr3 and occasionally the beta-decay process will
and near-line (near-line processing refers to the analysis of data populated the excited 0+2 state. When the 02+ state de-excites it
that was taken in an early stage of the experiment while the will emit a second electron that will result in a pulse slightly
experiment is still running). This processing is used, not only delayed in time with respect to the beta-decay electron (see
to ensure the experimental systems are working but also to Figure). Measuring the time between these two pulses gives an
enable mid-run decision making. exponential distribution from which the lifetime of the 02+ state
 can be extracted as has been done previously [Cri16, Suc14].
 This lifetime provides information about difference in the mean
 square charge radius between these two states in 80Ge.
 IV. E17011 – LIFETIME MEASUREMENTS IN NEUTRON RICH Theory predicts that this lifetime is about 50ns. Since
 NUCLEI traditional analog digitizers have dead-times of microseconds,
 they cannot easily be used to perform this measurement. What
 E17011[Cri] is an experiment scheduled to run at the NSCL we can do, however, is capture signal traces from the CeBr3
in early 2020. We’ll first examine the science goals of this
detector using modern digitizers of the sort shown in Figure 3. is known as event building. Note that the digitizers
 we use emit data we call hits that is timestamped but
 these hits are not guaranteed to be time ordered
 • The data flow can be reduced by requiring that PIN
 detector hits have a minimum threshold energy
 indicating the particle was a heavy ion. This process
 is known as software triggering. We do not know in
 advance the fraction of data software triggering will
 retain.
 • The traces from the CeBr3 detectors must be analyzed
 to determine if they are single or double pulses (the
 bulk will be single pulses). For the double pulses, the
 Figure 4 Detector trace from a similar experiment showing the time between pulses and the heights of both pulses
 beta-decay electron between 68Co populating the excited 02+ must be determined.
 state in 68Ni which decays a short time later through the • Implantation events must be correlated with the
 emission of an internal conversion electron or internal pair corresponding decays.
 formation [Cri16].
 • Live data must be recorded to disk for near-line and
 offline analysis. The files recorded contain time
 sequenced data for each event allowing a complete
 The originally proposed experimental setup is shown
 reconstruction of the experiment in offline analysis.
schematically in Figure 5. The beam goes from left to right in
this figure. The CeBr3 detector is at the center of 16 detectors
 Figure 6 Shows our proposed online data flow. While the
of the Segmented Germanium (SeGa) array [Mue01] shown as
 trigger rates are expected to be a relatively modest 3 KHz, the
the blue cylinders. SeGA, and an array of 16 LaBr3 [Lon19]
 data flow is expected to be about 200MB/sec. This is due to
detectors are used to directly measure the gamma-ray transition
 traces we will take and the high expected channel multiplicities.
energies.
 Note that the NSCLDAQ data flow scheme allows us to treat
 each of the data flow arrows in Figure 6 as a test point with no
 impact on data flow. Note that the pulses shown in Figure 4 can
 overlap heavily.

 Figure 5 E17011 experimental setup

 Upstream of SeGA a stack of PIN diode detectors that do Figure 6: Data flow for E17011
particle-by-particle identification of the beam particles being
deposited in the CeBr3 detector based on energy loss and time- C. Meeting rate requirements
of-flight measurements. This particle identification allows us
 The first bottleneck in Figure 6 is the process labeled
to know exactly what is being implanted into the CsBr3
detector since the beam delivered to the final setup will (“Append fits for 1, 2 pulses to the sum signal”). In addition to
contain a range of isotopic species signals for each pixel, digitized at 250MHz, the detector
 provides a signal summing the energies in all pixels which we
B. The online and near-line analysis chains. will digitize at 500MHz. Online, our goal is only to fit the
 energy sum signal. The pixel signals will be fitted in near-line
 analysis.
In order to understand the data from the experiment Fitting the traces is used both to extract the key features of
sufficiently to know if the experiment is working properly we those pulses (time and peak height) as well as to provide
need to perform the following analysis in a combination of determine if the traces contain a single or double pulse. The
online and near-line processes. following empirical functional forms are used to fit the pulses:
 • Hits from the digitizers must be combined in time − 1( − 0)
 coincidence into events varying in size depending on = +
 1+ − 2( − 0)
 experimental need between a few hundred (2)
 nanoseconds and a few microseconds. This process
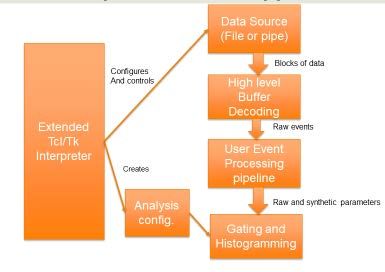
 1 − 1( − 0) 2 − 3( − 1) Two programs we use in the online data flow are:
 = + +
 1+ − 2( − 0) 1+ − 4( − 1) • A classifier: User code assigns a uint32_t value for
 each event. This is the first stage of event selection.
The first of these functions represents a single pulse and the The second stage is a generic selection of events
second a double pulse. The trace has a DC offset C. For each whose classifications meet specific criteria.
pulse, the denominator is a logistic function that is used to Classification can be arbitrarily complex while
model the rising edge of the pulse, the numerator contains a selection is usually quite simple.
scale factor related to the pulse height and an exponential decay
 • An event editor. User code is given an event fragment
that models the falling edge of the pulse. The values of
 and generates a replacement for that fragment. This is
importance are A, A1, A2, x0 and x1. For a single pulse the
 used online to append fits information to hits and
actual pulse amplitude is gotten by evaluating the pulse formula
 offline to strip traces from event fragments that have
at:
 already been fit.
 2
 = 0 + ln � � / 2 (3) Since for all of our programs, events can be processed
 1
 independently, the framework programs all have the same
Fitting the sum trace requires in excess of 3ms/trace using the general structure shown in Figure 7
Levenberg-Marquardt[Lev] fit routines in the GNU Scientific
Library. The ratios of the chi square errors of the fit between
the single and double pulse provide a heuristic for determining
if the pulses are double or single.

The next bottleneck is our ability to extract parameters and
implantation/decay correlations from the data so that
histograms can be generated and visualized. The actual
histogram operations are not a bottleneck. It is clear that to
achieve our online analysis goals we’ll need to make use of
parallel processing.
 Figure 7: Structure of event parallel programs.
1) Parallel libraries and programs – classifying and fitting

In order to meet the performance requirements of online The programs are parallel pipelines with data flowing from
analysis while allowing us to re-use code for near-line analysis, left to right. The data distributor, fans out blocks of events to
we have written libraries to support parallel processing and workers that operate on them in parallel. The workers fan in
framework programs that hide the nature of parallel processing blocks of modified events to a thread/process that re-sorts the
from the user. While these are targeted at E17011 they are, in data by timestamp and then passes them on to a thread/process
fact quite general. that outputs them.
 • In most cases each event can be operated on
The libraries themselves abstract communication into independently of all other events allowing the workers
communication patterns (e.g. fanout, fanin, and pipeline) and to be embarrassingly parallel.
separate these patterns from the underlying transport. At • In order to efficiently balance messaging and
present we support 0MQ[Zmq] and the Message Passing processing, the programs have a command option to
Interface[Mpi] (MPI) as transports. 0MQ and its high let the user select the number of events in each block
performance inproc transport targets threaded parallelism while of events sent to workers.
MPI targets process parallelism on massively parallel cluster • A pull protocol is used by the workers to get data from
computing. Note that nothing in our libraries precludes the use the distributor.
of 0MQ in distributed parallel computing. • To allow the correlation of implantations with
 corresponding decays, we re-sort the data back into its
Online analysis will use threaded parallelism, while near-line original order before outputting it.
and offline will use MPI parallelism. The libraries allow single
programs to be written that can select their parallelization
strategy (threaded/0MQ or cluster/MPI) at run-time. We have
written several programs that provide the capability to plug-in
user, application specific code that is unaware of the parallel
nature of the underlying program. These programs can be told
on the command line whether or not to use threaded or MPI
parallelism. These framework programs accept user code built
into a shared object library which is loaded at run-time.
We used the event editor with user code that fits the energy applications with more than 64 processes unreliable. ICER is
sum signal to check the online performance of the fitting part of in the process of updating their singularity runtime to allow us
the dataflow. The program was run on a system with 40 cores to extend our scaling measurements.
of Xeon 6148 clocked at 2.4Ghz. This is a system we intend to
 Fireside
use for the experiment. Figure 8 shows the event processing MPI Fit performance (NSCL)
rate as a function of the number of worker threads:
 ICER
 30000

 Events/sec vs workers 25000

 14000 20000

 Events/sec
 12000
 15000
 10000
 EVents/sec

 8000 10000
 6000
 5000
 4000
 2000 0
 0 0 50 100 150 200 250 300
 0 50 100 Workers
 Workers
 Figure 8: Threaded fit performance Figure 9MPI fit performance

 This figure shows that:
 • We meet the online rate requirements using between 2) Parallel online histograming – NSCLSpecTcl.
 4 and 6 worker threads.
 • There is a knee when we hit the number of actual At NSCL, our primary histograming and visualization tool
 processor cores. Additional performance gains due to for online data analysis is NSCLSpecTcl[Fox04]. This is a Tcl
 hyper threading don’t add nearly as much as driven program. The experimenter supplies a logical pipeline
 additional cores do. of code that accepts raw events as input and produces
 parameters, both raw and synthetic as output. A generic
Near-line, we’d like to fit all 256 pixels at least at the incoming histograming kernel increments histograms. NSCLSpecTcl
data rate. Due to the monolithic nature of the central CeBr3 specific commands allow users to dynamically create
detector, most pixels are expected to trigger for each event. histograms, create conditions and apply arbitrary logical
This will require about 2500 cores. The event editing program combinations of those conditions to control which events cause
fitting can run either threaded parallel or MPI parallel on a histograms to be incremented. Tk allows users to create
massively parallel cluster. The NSCL has a modest cluster of sophisticated application specific GUIs.
around 200 cores called Fireside.
 Michigan State University, has a unit called the Institute for The structure of NSCLSpecTcl is shown in Figure 10.
Cyber Enabled Research[Icer] (ICER). Among other things,
ICER provides a cluster of over 23,000 cores available for use
by MSU researchers. We hope to make use of this facility for
near-line analysis during the run.
 Figure 9 shows the performance of the same fit program
using cluster parallel computing both on Fireside and at ICER.

 Several points to note:
 • The ICER cores are faster than the NSCL cores.
 • Both plots have performance knees. This is because
 the cluster nodes are heterogeneous. As the number of
 cores required increases we get relegated to the more
 plentiful, older cores.
 Figure 10 NSCL SpecTcl block diagram
Our performance measurements at ICER duplicated the NSCL
software environment using Singularity[Sylabs] containers. Geordano Cerizza has forked the NSCLSpecTcl codebase and
Singularity is MPI aware. Unfortunately the version of created a threaded version of NSCLSpecTcl that completely
singularity available at ICER has a bug that makes running MPI retains its interactive nature. His work allocates one thread to
the data source and buffer decoding. User event then become a A. Message Passing Interface
set of parallel workers. Each worker gets a block of events and, The message passing interface, or MPI is a distributed
when parameters for that block of events have been extracted, parallel programming system. MPI programs run the same
the resulting lists of event parameters are sent to the main thread process in parallel on multiple nodes or cores within those
via Tcl_ThreadQueueEvent. nodes. MPI is supported on virtually all massively parallel
 One problem with this and other event parallel schemes is cluster computing environments. OpenMPI and MPICH are the
that for these implantation/decay experiments, events are not two common implementations of the MPI specification. Both
completely independent of each other. At some point in the are open source implementations of the MPI standard. Our tests
analysis, implantation events must be correlated with their all use the OpenMPI libraries.
associated decays. In this and other fully event parallel In MPI processes exchange messages using an opaque
programs, implantations may have their decays in different structure called a “communicator” When the MPI program is
blocks of events, processed by other workers. run a single communicator: MPI_COMM_WORLD is defined.
 For E17011, where the 80Ga half-life is a bit less than 1.7 Subsequently the program can define additional communicators
seconds, we can make the blocks of data sufficiently large (an and use these communicators to create process groups that
800Mbyte data block represents about 4 seconds of data) to communicate internally.
allow a sufficient number of implantation and decay Within a communicator a process has a rank. A process’s
correlations to be made to understand the experiment online and rank is just an integer number that runs from 0 to n-1 where n
near-line. is the number of processes in that communicator.
 Figure 11 shows the performance of threaded SpecTcl on a Sending a message requires:
simple analysis. This analysis just unpacks the raw parameters • A communicator.
from the fragments of each built event. Note that the actual • The rank of the receiving process within the
online analysis will be quite a bit more complex. communicator.
 • A message tag that can be used to identify the type of
 3500 message being sent.
 • A buffer.
Processing Speed (Mb/s)

 3000 • A data type indicating the type of data in the block
 2500 • The number of data items in the block.
 2000
 When receiving messages, processes can either specify exactly
 1500 the tag and rank from which to receive a message, allowing
 1000 for complex application protocols, or provide wild cards for
 either the tag or the rank (note that even with a wild card
 500
 source rank messages receipt will be restricted to those
 0 processes within the communicator specified in the receive
 0 10 20 30 40 50 call.
 Number of Processors
Figure 11Threaded SpecTcl performance
 MPI defines primitive data types and allows users to define
 their own data types.

 1) Existing MPI Tcl packages.
The roll-off after about 16 processors at about 3.5-3Gbytes/Sec
 The MPI Specification is large, rich and complex. Version 3
represents data transfer limits from the local SSD on which the
 of the specification defines approximately 600 API functions.
event data were stored.
 The size and complexity of MPI that requires some choices
 when exposing the MPI to Tcl applications.
 V. MPITCL AND MASSIVELY PARALLEL TCL PROGRAMMING Axel Kohlmeyer created a Tcl MPI package[Kohl]. He
 decided to encapsulate a subset of the MPI specification. His
 This section introduces an MPI aware Tcl interpreter. The work is somewhat SWIG providing Tcl verbs that represent
Message Passing Interface (MPI) is introduced. We’ll describe bindings to raw MPI calls.
existing work to make MPI accessible to Tcl. We’ll then Kohlmeyer’s tclmpi package provides Tcl bindings to 21
describe the features of mpitcl and provide simple examples of MPI API functions. Tclmpi also provides a tclmpi namespace
mpitcl scripts. Finally we’ll present a real application of mpitcl with values for the predefined communicators as well as MPI
to an existing program, NSCLSpecTcl allowing it to run in a data types and a Tcl specific data type.
cluster parallel environment. MPI consists of a specification
and language bindings that make the functions and data types While the subset of MPI implemented by tclmpi reduces
described by that specification available to specific somewhat the complexity of of the MPI specification, raw MPI
programming languages. is still exposed to script writers.
2) mpitcl – NSCL style. (including the sender) and in all other processes
 respectively.
In designing the specification for mpitcl, an MPI aware shell,
we wanted to hide MPI as much as possible from the script • send rank data – sends data to rank the special
author. We thought a bit about what Tcl-ish MPI values all and others are supported with the same
encapsulation might allow script to do. meaning as the execute subcommand.
 We came up with the following requirements:
 • handle script – invokes script the process receives
 • Tcl processes must be able to send each other scripts data. script is invoked with two parameters, the
 to execute. These scripts would be executed sender’s rank and the data that was received.
 asynchronously. Sending these scripts is the primary
 mechanism that will be used to initiate computations • stopnotifier – Only legal in rank 0 – stops the event
 in the application. loop message notification thread.

 • Tcl processes must be able to send each other Tcl • startnotifier – Only legal in rank 0 – starts the event
 data. The receiving process must be able to establish loop message notification thread (starts by default).
 a Tcl script to handle the receipt of data.
 In mpitcl,
 • Applications must be able to determine the number of
 processes in the application and each process should Only rank 0 runs an interpreter main loop. All other ranks
 be able to determine its rank within the application. will run a loop probing for messages and handling them.
 Tags are used to distinguish between message types. In this
 • Compiled code must be able to take over the implementation there is only support for the
 messaging completely. Most Tcl MPI applications MPI_COMM_WORLD communicator and therefore no
 will actually be Tcl driven with compiled cores. support for the creation of process groups.

Our mpitcl interpreter provides an mpi namespace which, in
 When rank 0 initializes, it starts a thread that probes for
the current version defines an mpi command ensemble. The
 MPI messages. When a message is received,
subcommands of this ensemble are:
 Tcl_ThreadQueueEvent is used to notify the interpreter’s
 event loop a message is available for processing. The event
 • size - returns the number of processes in the handler reads and processes the MPI messages in exactly the
 application. same manner as non-rank 0 threads. Once the main thread
 processes this event, the notification thread is restarted. A
 • rank – returns the rank of the process in the special MPI tag tells the notification thread to stop without
 MPI_COMM_WORLD communicator. notifying the interpreter event loop.

 • execute rank script - executes the script in the rank Thus we have a model where the interpreter in rank 0 is a
 specified by rank two special values for rank are all master and all other ranks are slaves. Initially rank 0 will
 and others. These execute the script in all processes send scripts and data to other ranks. Those scripts may direct
 non rank 0 processes to communicate with each other in
 order to collaborate on the required computation.

 Note that the execute and send commands don’t use
 message passing when the target is the invoking process.
 Instead we just directly perform the operation. EXAMPLE 1
shows a minimal mpitcl script. This application just exits • analyze – takes chunks of events from the data
 after starting. source passing them to the data sink until the data
 mpi::mpi stopnotifier source is exhausted.
 mpi::mpi execute all exit
 This batch version of SpecTcl was turned into a Tcl loaded
 Example 1A mimimal mpitcl script package called spectcl. The user analysis pipeline invoked by
 the analysis sink was isolated into a shared library the user
 The script shown in EXAMPLE 2 is a bit more complex. It created from a skeleton and loaded as a Tcl package. The
 shows how mpitcl scripts gather data sent to them from other pipeline elements do not require any code changes from
 nodes. This script demonstrates a pattern commonly used by interactive NSCLSpecTcl. Note that the analysis
 the rank 0 process to get the contributions to the result of a configuration is a Tcl script that can be created with
 computation. interactive SpecTcl.

 set slaves [mpi::mpi size] Batch then was made to run under mpitcl. This was done by
 incr slaves -1; # number of slave processes. creating another package called mpispectcl. This package
 added the following commands:
 • mpisource specifies the data source to be blocks of
 proc receiver {rank data} { events received via MPI messages.
 puts "Received from $rank '$data'" • mpisink specifies that the data sink was a distributor
 incr ::slaves -1 using MPI messaging to send data to processes on
 } request from MPI data sources.

 mpi::mpi handle receiver In MPI Spectcl each rank has a complete copy of
 NSCLSpecTcl. A run of MPI NSCLSpecTcl is involves the
 mpi::mpi execute others { rank 0 process:
 mpi::mpi send 0 "Rank [mpi::mpi rank] is alive" 1. Ensuring all required packages are loaded in the all
 } ranks.
 2. Ensuring the analysis configuration script is loaded
 while {$slaves} { into all ranks.
 vwait slaves 3. Configuring all non-rank 0 processes to use an mpi
 data source and an analysis data sink.
 } 4. Configuring rank 0 to use a file data source and an
 mpi data sink
 mpi::mpi2 Requesting
 Example stopnotifierand receiving data. 5. Analyzing the file.
 mpi::mpi execute all exit 6. Collecting, summing and writing the histograms
 produced by all non-rank 0 processes. These
 Each process is told to execute a script that sends a sign on histogram files can then be visualized using
message back to rank 0. The rank 0 then enters the event loop interactive Spectcl.
while there are still slaves that have not responded. As data
are received, the receiver proc is invoked from the event loop. Example 3 shows how this is done with mpitcl:
It handles the data and terminates the vwait command. The
program then stops the notifier thread and tells al processes to
exit.
B. Massively parallel NSCLSpecTcl
This section describes what was necessary to take the existing
interactive NSCLSpecTcl application and port it to run under
the mpitcl MPI aware tcl shell.

 Our first task was to create a batch version of
NSCLSpecTcl. We replaced the vertical boxes in Figure 10
NSCL SpecTcl block diagram with an abstract data source and
an abstract data sink. We initially implemented a file data
source and a data sink that contained the analysis pipeline and
histogramming. We added the following commands:
 • filesource sets the data source to be the file data
 source connected to a specific data file.
 • analysissink specified the data sink to be the the
 analysis pipeline and histograming engine.
VI. CONCLUSIONS
mpi::mpi execute all { Modern data acquisition electronics have the potential to
package require spectcl increase the data flow requirements of experiments in nuclear
package require mpispectcl science. Experiment E17011 is an example of this trend.
package require MyPipeline In order to meet the demands, of that, and other
source defs.tcl experiments, we have developed parallel libraries and
} programs that make it easy for people not experience in
mpi::mpi execute others { developing parallel software to make use of either threaded or
mpisource cluster parallelism. We will be applying these techniques to
analysissink E17011 specifically and adapting them to even more complex
} experiments in the future.
filesource run-0003-00.evt
mpisink
mpi::mpi stopnotifier
mpi::mpi execute others analyze REFERENCES
analyze
[MOR98] Radioactive Nuclear Beam Facilities Based on
mpi::mpi startnotifier Projectile Fragmentation, D.J. Morrissey and B.M. Sherrill,
Proc. Royal Soc. A 356 (1998) 1985
writeSpectra
[LIN04] Review of ISOL-Type Radioactive Beam Facilities M.
mpi::mpi stopnotifier; Lindroos Proceedings of EPAC 2004 online at
mpi::mpi execute others exit https://accelconf.web.cern.ch/accelconf/e04/PAPERS/TUXCH
exit 01.PDF
[Cri] Experimental proposal for E17011, B. Crider et al.
Example 3 MPI SpecTcl anlayzing a data file.
unpublished.
The proc writeSpectra is not shown. It uses the technique [Lev] A Method for the Solution of Certain Non-Linear
demonstrated in Example 2 to request all non-rank0 processes Problems in Least Squares K. Levenberg Quarterly of Applied
send the histograms they have computed. Histogram Mathematics 2(2) 164-168
contributions from each rank are summed and then written to [Zmq] http://zeromq.org
file. [Mpi] https://www.mpi-forum.org/docs/mpi-3.0/mpi30-
report.pdf
NSCLSpecTcl’s MPI scaling is shown in Figure 12 NSCL [Icer] https://icer.msu.edu/
SpecTcl MPI scaling. We reached I/O bandwidth limits after
[Sylabs] https://sylabs.io/singularity/
8 workers (9 processes). The analysis was the same simplistic
[Fox04] NSCLSpecTcl Meeting the needs of Preliminary
event unpacking software used in Figure 11: Threaded SpecTcl
Nuclear Physics Data Analysis R. Fox et al. Tcl 2004 New
performance. During E17011, the analysis pipeline will be
Orleans available online at
considerably more complex.
https://www.tcl.tk/community/tcl2004/Papers/RonFox/fox.pdf
Events/sec [Kohl] https://sites.google.com/site/akohlmey/software/tclmpi
800000 [Cri16] B.P. Crider, et al., Phys. Lett. B 763, 108-113 (2016).
[Suc14] S. Suchyta et al.,Phys Rev C 89, 067303 (2014).
600000
Events/sec
[Mue01] W. F. Mueller, et al., Nucl. Instrum. Methods Phys.
400000 Res. A 466, 492 (2001).
[Mor03] D. J. Morrissey, B. M. Sherrill, M. Steiner, A. Stolz,
200000
and I.Wiedenhoever, Nucl. Instrum. Methods Phys. Res. B 204,
0 90 (2003).
0 2 4 6 8 10 [Bar08] S. Baruah et al., Phys. Rev. Lett. 101, 262501 (2008).
workers [Got16] A. Gottardo et al., Phys. Rev. Lett. 116, 182501 (2016).
Figure 12: NSCL SpecTcl MPI scalingYou can also read


