Systematic evaluation of normalization methods for glycomics data based on performance of network inference - bioRxiv
←
→
Page content transcription
If your browser does not render page correctly, please read the page content below
bioRxiv preprint first posted online Oct. 24, 2019; doi: http://dx.doi.org/10.1101/814244. The copyright holder for this preprint
(which was not peer-reviewed) is the author/funder, who has granted bioRxiv a license to display the preprint in perpetuity.
                              It is made available under a CC-BY-NC-ND 4.0 International license.

   Systematic evaluation of normalization methods for glycomics
   data based on performance of network inference
   Elisa Benedetti1,10, Nathalie Gerstner1, Maja Pučić-Baković2, Toma Keser3, Karli R. Reiding4, L. Renee Ruhaak4, Tamara
   Štambuk3, Maurice H.J. Selman4, Igor Rudan5, Ozren Polašek6,7, Caroline Hayward8, Marian Beekman4, Eline
   Slagboom4, Manfred Wuhrer 4, Malcolm G Dunlop 9, Gordan Lauc 2,3, Jan Krumsiek1,10

   1
    Institute of Computational Biology, Helmholtz Zentrum München - German Research Center for Environmental Health, 85764
   Neuherberg, Germany
   2
       Genos Glycoscience Research Laboratory, Zagreb, Croatia
   3
       University of Zagreb Faculty of Pharmacy and Biochemistry, Zagreb, Croatia
   4
       Leiden University Medical Center, 2333 ZC Leiden, the Netherlands
   5
       Usher Institute of Population Health Sciences and Informatics, University of Edinburgh, EH8 9AG Edinburgh, UK
   6
       University of Split School of Medicine, 21000 Split, Croatia
   7
       Gen-info Ltd., 10000 Zagreb, Croatia
   8
     Medical Research Council Human Genetics Unit, Institute of Genetics and Molecular Medicine, University of Edinburgh, EH4 2XU
   Edinburgh, UK
   9
     Colon Cancer Genetics Group, Institute of Genetics and Molecular Medicine, University of Edinburgh and Medical Research
   Council Human Genetics Unit, Edinburgh, UK
   10
    Institute for Computational Biomedicine, Englander Institute for Precision Medicine, Department of Physiology and Biophysics,
   Weill Cornell Medicine, New York, USA
bioRxiv preprint first posted online Oct. 24, 2019; doi: http://dx.doi.org/10.1101/814244. The copyright holder for this preprint
(which was not peer-reviewed) is the author/funder, who has granted bioRxiv a license to display the preprint in perpetuity.
It is made available under a CC-BY-NC-ND 4.0 International license.
Abstract
Glycomics measurements, like all other high-throughput technologies, are subject to technical variation due
to fluctuations in the experimental conditions. The removal of this non-biological signal from the data is
referred to as normalization. Contrary to other omics data types, a systematic evaluation of normalization
options for glycomics data has not been published so far. In this paper, we assess the quality of different
normalization strategies for glycomics data with an innovative approach. It has been shown previously that
Gaussian Graphical Models (GGMs) inferred from glycomics data are able to identify enzymatic steps in the
glycan synthesis pathways in a data-driven fashion. Based on this finding, we here quantify the quality of a
given normalization method according to how well a GGM inferred from the respective normalized data
reconstructs known synthesis reactions in the glycosylation pathway. The method therefore exploits a
biological measure of goodness. We analyzed 23 different normalization combinations applied to six large-
scale glycomics cohorts across three experimental platforms (LC-ESI-MS, UHPLC-FLD and MALDI-FTICR-MS).
Based on our results, we recommend normalizing glycan data using the ‘Probabilistic Quotient’ method
followed by log-transformation, irrespective of the measurement platform.bioRxiv preprint first posted online Oct. 24, 2019; doi: http://dx.doi.org/10.1101/814244. The copyright holder for this preprint
(which was not peer-reviewed) is the author/funder, who has granted bioRxiv a license to display the preprint in perpetuity.
It is made available under a CC-BY-NC-ND 4.0 International license.
1 Introduction
Glycans have been recognized to contribute to the pathophysiology of every major disease1. To keep up with
the increasing interest to better understand the involvement of glycans in biological processes at a molecular
level, high-throughput platforms have been developed in the recent past. These platforms allow to profile
glycans in large-scale datasets and from a wide variety of biospecimens.
Similar to all other omics data types, glycomics samples need to be preprocessed prior to statistical analysis
in order to minimize intrinsic, non-biological variation. This variation can arise, for example, from fluctuations
in the instrument settings, sample preparation, or experimental conditions. The process that aims at
reducing technical variations from the data is referred to as normalization. Different normalization
procedures have substantially different assumptions regarding the nature of the non-biological variation,
which, however, is unknown in most practical cases. Systematic comparisons of commonly implemented
preprocessing strategies for various omics technologies have been published in recent years, including
transcriptomics2, proteomics3, as well as metabolomics4–6. An analogous study for glycomics data is, to the
best of our knowledge, currently still unavailable.
This need for a glycomics-specific evaluation is further supported by the observation that the de facto
standard for large-scale glycomics data preprocessing is Total Area (TA) normalization7, which describes each
glycan intensity in a sample as a percentage of the total. Following this transformation, the normalized
intensities of a sample sum up to one (or 100%) by definition, leading to the loss of one degree of freedom.
The division of each value by the sum of all values in a sample is referred to as a closure operation, and the
resulting dataset is known as a compositional dataset8. Notably, these types of data normalization alter the
structure of the covariance matrix, subsequently affecting any downstream correlation-based analysis (for
details on this phenomenon, see Methods). Compositional datasets are not unique to glycomics, but widely
occur in other fields, prominently in microbiome profiling9, where percentages are used to describe the
relative abundance of different microbial species. Notably, regular multivariate methods are not appropriate
to treat these types of data, and specific statistical techniques need to be employed10–14. Most of such
techniques require the definition of new variables, typically defined as ratios between the original
compositional values15–17. This makes interpretation of the results in terms of the original quantities
challenging18,19.
In order to be able to infer biological interactions from the analysis of large-scale glycomics data, the
selection of a more suitable alternative to TA normalization is therefore necessary. Given the variety of
possible preprocessing strategies available, we need to define a criterion to quantitatively evaluate the
performance of each method to select the most appropriate normalization method.
Common evaluation schemes for the performance of preprocessing strategies are mostly based on two
approaches: 1. Minimizing the variation between technical replicates20,21; 2. Maximizing the variation across
groups6. Consistency across technical replicates is a desirable outcome, but alone is not sufficient to
guarantee good data quality, and technical replicates might not always be available. The maximization of
variation across groups, on the other hand, is based on the assumption that the measured variables associate
strongly to an arbitrarily chosen phenotype, which might or might not be the case for specific data. This
criterion does therefore not necessarily reflect the true underlying biology.bioRxiv preprint first posted online Oct. 24, 2019; doi: http://dx.doi.org/10.1101/814244. The copyright holder for this preprint
(which was not peer-reviewed) is the author/funder, who has granted bioRxiv a license to display the preprint in perpetuity.
It is made available under a CC-BY-NC-ND 4.0 International license.
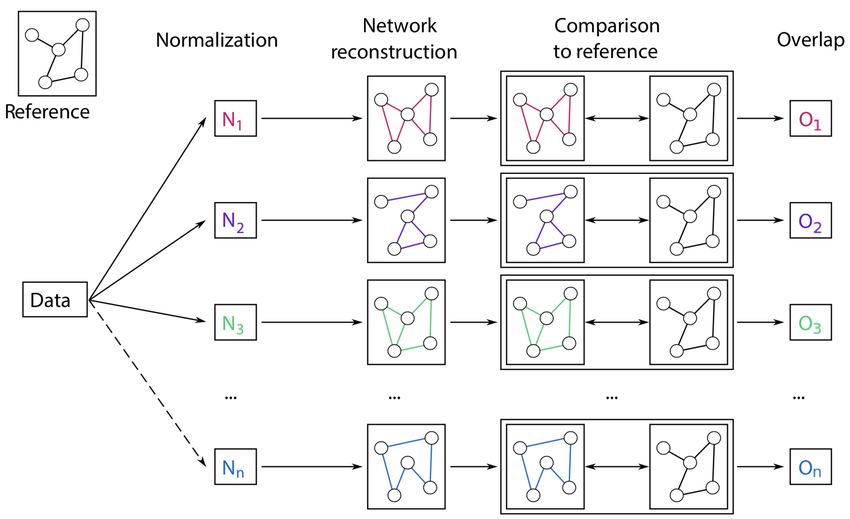
In this paper, we address the question of evaluating different normalization strategies for glycomics data
with a different, innovative approach. We assess the quality of a normalized dataset through its ability to
reconstruct a biochemically correct pathway using statistical network inference. The idea is based on the
observation that Gaussian Graphical Models (GGMs) are able to selectively identify single enzymatic steps in
metabolic pathways22. Thus, we compare the GGMs inferred from data normalized with different approaches
to the known biochemical pathway of glycan synthesis and evaluate the quality of each normalization
according to how well the corresponding GGM retrieves known synthesis reactions (Figure 1). By computing
the overlap between estimated GGM and glycosylation pathway, we rely on a biological measure of quality,
as a higher overlap indicates data whose correlations are able to better reflect known biochemical
interactions. Hence, the normalization that produces the highest overlap is defined as the best. Glycomics
data provide an ideal test case to demonstrate the validity of this approach, as the known biochemical
pathway of synthesis is well characterized.
In the following, we compared the performance of different variations of seven commonly implemented
normalization methods on data from six cohorts across three different glycomics platforms, including
measurements of IgG Fc, total IgG or total plasma N-glycans.
2 Results
2.1 Data
We analyzed six large-scale glycomics datasets (Table 1), measured on three different platforms:
(1) In four cohorts (Korčula2013, Korčula2010, Split, Vis)23, N-glycans from the Fc region of IgG were
measured via liquid chromatography - electroSpray ionization – mass spectrometry (LC-ESI-MS). This
platform allows to quantify glycopeptides, i.e. short amino acid sequences in proximity of the glycosylation
site in combination with the attached glycans. Since IgG has four isoforms (also referred to as subclasses),
which differ in their amino acid sequences24,25, the LC-ESI-MS technology is able to distinguish among glycans
bound to different IgG subclasses. In total, 50 N-glycopeptide structures were quantified: 20 for IgG1, 20 for
IgG2 and IgG3 (which have the same glycopeptide composition and hence are not distinguishable by
mass24,25) and 10 for IgG4. In the main manuscript, we show results for the Korčula 2013 cohort, which
included 669 samples.
(2) In one cohort (Study of Colorectal Cancer in Scotland; SOCCS)26, IgG N-glycans were measured via ultra-
high-performance liquid chromatography with fluorescence detection (UHPLC-FLD). In this case, all glycans
bound to the IgG protein are first released and then measured, including the ones in the Fab region (see
Methods), but no information about the IgG subclass of origin is retained. Peaks in the chromatogram reflect
chemical-physical properties of the measured molecules and not necessarily single glycan structures. In the
specific case of IgG N-glycans, however, each UHPLC peak typically includes one highly predominant
structure27. For the purpose of the analyses presented in this paper, we only considered the most abundant
structure within each peak. The final UHPLC cohort consisted of 24 glycan peaks quantified in 535 samples.
(3) In the last cohort (Leiden Longevity Study; LLS)28, N-glycans from the whole set of human plasma proteins
were measured via matrix-assisted laser desorption/ionization – Fourier-transform ion cyclotron resonance
– mass spectrometry (MALDI-FTICR-MS). In this setting, glycans from all plasma proteins are released andbioRxiv preprint first posted online Oct. 24, 2019; doi: http://dx.doi.org/10.1101/814244. The copyright holder for this preprint
(which was not peer-reviewed) is the author/funder, who has granted bioRxiv a license to display the preprint in perpetuity.
It is made available under a CC-BY-NC-ND 4.0 International license.
measured together. Therefore, glycans originating from highly abundant and highly glycosylated proteins will
be predominant. Notably, this platform only identifies molecular masses, so structural information is not
directly available from the data. Therefore, within each mass multiple glycan structures can be present, and
this has to be taken into account. In the analyzed cohort, 61 distinct masses were quantified in 2,056 samples.
2.2 Overview of normalization methods
Seven basic preprocessing approaches were considered, all of which are commonly used in omics data
analysis (Table 2): (1) Raw (unprocessed) data were included for comparison; (2) Quantile29 and (3) Rank30
normalization are widely used in microarray data analysis; (4) Total Area (TA) is often used to preprocess
large-scale glycomics31 and microbiomics data9; (5) Median centering4, (6) Probabilistic Quotient
normalization applied to raw and (7) to TA-normalized data are popular methods for the preprocessing of
metabolomics data32,33.
Since omics data have frequently been reported to follow an approximately log-normal distribution34,35, and
since GGMs assume normally distributed data, log-transformation of normalized data was also included in
the analysis when applicable (indicated by a check mark in the second column of Table 2. This resulted in a
total of 13 different preprocessing strategies. For LC-ESI-MS IgG data, 10 additional variations were included,
as in this case data normalization can be performed over the full dataset or per IgG subclass separately (third
column in Table 2. A detailed description of each normalization procedure can be found in the Methods.
2.3 Prior knowledge-based evaluation
Once all normalizations were applied to the data, partial correlation coefficients were computed with the
GeneNet algorithm, which has been proven to give more reliable and stable estimates of partial correlation
coefficients than the analytical method36. Statistical significance of coefficients was determined by applying
a False Discovery Rate (FDR) of 0.01. The resulting partial correlation network, or Gaussian Graphical Model
(GGM), was then compared to the respective biochemical pathway of glycan synthesis. As a quantitative
measure of overlap between the calculated GGM and the pathway, we chose the Fisher test p-value (see
Methods), where lower p-values correspond to a higher overlap between inferred network and prior
knowledge, thus corresponding to a better normalization. The biochemical pathway for IgG was taken from
Benedetti et al. 201737, while the reference pathway for the total-plasma N-glycome was based on the
measured glycan masses (see Methods). Schematics of the pathways used for the evaluation can be found
in Figure S1-S4.
2.4 LC-ESI-MS – IgG Fc N-glycopeptides
For the LC-ESI-MS platform, most methods produced networks with high overlap to the biochemical pathway
of synthesis, indicated by low Fisher’s test p-values (Figure 2, left).
Interestingly, the unprocessed data (Raw) were among the best-performing methods, which might be related
to the fact that, with this platform, the ionization is dominated by the peptide, which might serve as an
internal standard for the glycan quantification. As expected, TA-based normalizations performed significantly
worse than all other considered strategies, probably due to the alteration of the covariance matrix induced
by closure operation. Moreover, we observed that, in most cases, log-transformation did not improve
performance (Figure 2, center). Given the assumption of normality of the Gaussian graphical models, webioRxiv preprint first posted online Oct. 24, 2019; doi: http://dx.doi.org/10.1101/814244. The copyright holder for this preprint
(which was not peer-reviewed) is the author/funder, who has granted bioRxiv a license to display the preprint in perpetuity.
It is made available under a CC-BY-NC-ND 4.0 International license.
expected log-transformed data, which are more normally distributed, to perform better than their non-
transformed counterparts. This might indicate that GGMs, although formally only suitable for normally
distributed data, are effective also for non-Gaussian data. An exception to this observation was the TA-log
normalization, for which log-transformation appears to neutralize the constraints imposed by TA and hence
improving performance. Normalizing per total IgG or per IgG subclass did not result in substantial differences
in performance, except for TA (Figure 2, right).
The results of the evaluation were consistent across all four cohorts (Figure S5-S7).
In summary, we showed that for LC-ESI-MS IgG Fc glycomics data, all considered preprocessing performed
comparably except TA, which was significantly worse than the rest. Moreover, non-log-transformed data did
not perform worse than the transformed data, and normalizing per total IgG or per IgG subclass did not make
a significant difference.
2.5 UHPLC-FLD – Total IgG N-glycans
For the UHPLC-FLD dataset, contrary to the previous case, the performance was highly affected by the chosen
normalization method (Figure 3, left), with TA Probabilistic Quotient and Probabilistic Quotient ranking at
the top. In this case, the unprocessed data performed poorly. Moreover, in contrast to what we observed in
the LC-ESI-MS case, for UHPLC-FLD data, the log-transformation had a significant impact on the performance
of normalizations, although with opposite effects depending on the methodology: for some it substantially
enhanced performance (Quantile, Total Area), while for others it was detrimental (Rank, Raw data) (Figure
3, right).
2.6 MALDI-FTICR-MS – Total plasma N-glycans
The MALDI dataset included 61 glycan peaks. Similar to the LC-ESI-MS case, most methods perfom
comparably (Figure 4, left). Log-transformed unprocessed data yielded the worst performance, although in
all other cases log-transformation did not significantly affect the normalization performance (Figure 4, right).
In conclusion, for MALDI data most normalization methods performed comparably. Log-transformation did
not significantly alter performance, except when considering log-transformed unprocessed data, which was
the worst performing approach.
3 Discussion
Several systematic evaluations of preprocessing methodologies have been recently published for different
omics data types, but glycomics has received little attention so far in this regard. In order to address this gap,
we developed an innovative approach to assess the quality of different normalization strategies applied to
glycomics data. The main feature of our procedure lies in the definition of a biological measure of quality.
More specifically, we quantify how well significant correlations in the data normalized with a given technique
represent known biochemical reactions in the pathway of glycan synthesis. Our quantitative measure of
choice for this evaluation was the p-value of a Fisher’s exact test, which allows for an intuitive interpretation
of overlap between correlations and biochemical pathway.bioRxiv preprint first posted online Oct. 24, 2019; doi: http://dx.doi.org/10.1101/814244. The copyright holder for this preprint
(which was not peer-reviewed) is the author/funder, who has granted bioRxiv a license to display the preprint in perpetuity.
It is made available under a CC-BY-NC-ND 4.0 International license.
We performed a systematic analysis of 23 preprocessing strategies applied to six large-scale glycomics
cohorts across three platforms, with measurements ranging from single protein and single glycosylation site
(LC-ESI-MS), to total plasma N-glycome (MALDI-FTICR-MS). The observed normalization ranking was
consistent across platforms: overall, the Probabilistic Quotient appeared to be the most reliable method, as
all variations of this procedure ranked consistently in the top performers in all cohorts and across platforms.
Log-transformation and normalization per IgG subclass or per total IgG did not seem to significantly affect
the ability of this method to correctly retrieve the glycan synthesis pathway. Interestingly, while Total Area
normalization did not rank high in comparison to other methods (as expected), the log-transformed Total
Area preprocessing was a well-performing method. In fact, TA Probabilistic Quotient was among the best
performing approaches overall, suggesting that additional transformations on TA normalized data can
neutralize the constraints imposed on the data correlation structure, as shown in Dieterle et al.32.
One interesting finding was the substantial difference of the evaluation results between MS- and UHPLC-
based platforms: While for MS most normalization approaches performed comparably, the variance among
the considered strategies was considerable for UHPLC. The origin of this discrepancy is not easy to trace, but
it could be due to the fact that UHPLC does not separate glycans according to their mass, like MS-based
techniques do, but according to their chemical and physical properties. This leads to most chromatographic
peaks to represent a mixture of glycan structures. Although it has been shown that there is a predominant
structure in the vast majority of IgG chromatographic peaks27, this contamination is likely to make the data
correlation structure noisier and thus more sensitive to different normalizations. Moreover, it is expected to
affect the comparison to the biological reference, which does not account for any structure mixture.
While the results presented here seem to suggest that log-transformation does not significantly affect
performance, it should be considered that data normality is an assumption for many other statistical tests
and approaches, and thus we still recommend to always log-transform omics data after normalization.
The same approach described here could moreover be employed to evaluate other preprocessing steps. For
example, it has been already shown that, for untargeted metabolomics data, different missing value
imputation strategies have a prominent impact on the results of the downstream analysis38. We could
investigate whether the same holds for glycomics data and quantitatively evaluate the performance of each
strategy. Similarly, our framework could be applied to the evaluation of batch correction approaches, which
aim at reducing the technical variation due to samples being measured at different times.
In conclusion, we recommend normalizing glycan data with the Probabilistic Quotient normalization followed
by log-transformation. This technique was robust and reliable regardless of the measurement platform.bioRxiv preprint first posted online Oct. 24, 2019; doi: http://dx.doi.org/10.1101/814244. The copyright holder for this preprint
(which was not peer-reviewed) is the author/funder, who has granted bioRxiv a license to display the preprint in perpetuity.
It is made available under a CC-BY-NC-ND 4.0 International license.
4 Materials and Methods
4.1 Datasets
4.1.1 LC-ESI-MS
Samples were collected from the Croatian islands of Vis and Korčula, and were obtained from the “10,001
Dalmatians” biobank23, while samples for a second cohort from Korčula and a cohort from Split were
collected separately a few years later. For this paper, we only considered unrelated individuals, as described
previously37. Samples with missing values were excluded from this analysis. The final datasets included 669
(Korčula2013), 504 (Korčula2010), 980 (Split), and 395 (Vis) samples.
The Croatian cohorts received ethical approval of the ethics committee of the University of Split School of
Medicine, as well as the South East Scotland Research. Written informed consent was obtained from each
participant.
A detailed description of the experimental procedure can be found in Selman et al. (2012)39 and Huffman et
al. (2014)40.
4.1.2 UHPLC-FLD
The Study of Colorectal Cancer in Scotland (SOCCS) study (1999–2006) is a case–control study designed to
identify genetic and environmental factors associated with nonhereditary colorectal cancer risk and survival
outcomes 41. Only the control samples with no missing values were considered for this analysis, for a total of
535 samples.
Approval for the study was obtained from the MultiCentre Research Ethics Committee for Scotland and Local
Research Ethics committee, and all participants gave written informed consent.
A detailed description of the experimental procedure can be found in Vučković et al. (2016)26.
4.1.3 MALDI-FTICR-MS
The Leiden Longevity Study (LLS) is a family-based study comprising 1,671 offspring of 421 nonagenarians
sibling pairs of Dutch descent, and the 744 partners of these offspring42. After removal of samples with
missing values, a total of 2,056 individuals were included in the current analysis.
The study protocol was approved by the Leiden University Medical Center ethical committee and an
informed consent was signed by all participants prior to participation in the study.
A detailed description of the experimental procedure can be found in Reiding et al. (2017)28.
4.2 Normalization methods
Prior to normalization, samples containing missing values were excluded from all cohorts.
Raw: These are the unprocessed, raw peaks intensities.bioRxiv preprint first posted online Oct. 24, 2019; doi: http://dx.doi.org/10.1101/814244. The copyright holder for this preprint
(which was not peer-reviewed) is the author/funder, who has granted bioRxiv a license to display the preprint in perpetuity.
It is made available under a CC-BY-NC-ND 4.0 International license.
Median Centering: The median value over all samples is subtracted from each glycan value in the dataset.
The underlying assumption is that the samples have a constant offset.
Total Area: The intensity of each glycan is normalized to the total area of the spectrum. This preserves the
relative intensities of each peak within the sample, at the cost of losing one degree of freedom due to the
constant sum constraint and giving rise to a so-called “compositional dataset”43. The underlying assumption
here is that only relative intensities are biologically relevant. This transformation, however, introduces
artifacts in the covariance matrix, which, just because of the constraint introduced by the normalization,
results with at least one negative value per each row8.
Probabilistic Quotient: This approach is based on the calculation of the dilution factor of each sample with
respect to a reference sample32. Here, the reference sample was calculated as the median value of each
glycan’s abundance across all measured samples. For each sample, a vector of quotients was then obtained
by dividing each glycan measure by the corresponding value in the reference sample. The median of these
quotients was then used as the sample’s dilution factor, and the original sample values were subsequently
divided by that value. The underlying assumption is that the different intensities observed across individuals
are imputable to different amounts of the biological material in the collected samples.
Quantile: This method forces the distributions of the glycans (columns) to be the same with respect to the
quantiles44. It requires replacing each point of a glycan with the mean of the corresponding quantile, resulting
in perfectly aligned distributions by construction.
Rank: Values are replaced with their corresponding ranks across the samples.
Log-transformation: Biological data have been observed to often follow a log-normal distribution34. Since
our correlation estimator assumes normally distributed data, we included both the non-transformed and the
log-transformed data for each considered normalization method, except the median centering.
Subclass-specific normalization: LC-ESI-MS measures IgG glycosylation at the glycopeptide level, which
means that the information about the IgG isoform is preserved. In Caucasian populations, as those
considered in this paper, the Fc glycopeptides of IgG2 and IgG3 have identical peptide moieties24,25, and are
therefore not distinguishable with this profiling method. Furthermore, only 10 glycoforms of IgG4 were
detectable due to the low abundance of this IgG subclass in human plasma. For this platform, each
normalization method was applied both on the 50 glycoform measurements together, as well as separately
per each IgG subclass.
4.3 Prior knowledge
The IgG N-glycan synthesis pathway considered in this analysis reflects the extended version established and
validated in Benedetti et al. (2017)37. For LC-ESI-MS data, the same glycosylation pathway was assumed for
all IgG subclasses (Figure S1). For UHPLC-FLD data, each peak was approximated to only be represented by
its most abundant structure, according to Pučić et al. (2011)27 (Figure S1).
For MALDI-FTICR-MS, the biochemical pathway was constructed based on current understanding of
glycosylation synthesis reactions45 (Figure S2). However, since the available data included only glycan masses
and not single structures, all the structures with the same mass were merged into a single node and massesbioRxiv preprint first posted online Oct. 24, 2019; doi: http://dx.doi.org/10.1101/814244. The copyright holder for this preprint
(which was not peer-reviewed) is the author/funder, who has granted bioRxiv a license to display the preprint in perpetuity.
It is made available under a CC-BY-NC-ND 4.0 International license.
not included in our dataset were removed (Figure S3). The resulting compositional pathway was then
adapted to match the masses in the dataset (Figure S4).
4.4 GGM estimation
Correlation networks were computed using the preprocessed glycan abundances. GGMs are based on partial
correlation coefficients, which represent pairwise dependencies in multivariate normally distributed data
when conditioned against all other variables. To obtain a reliable estimate for the partial correlation matrix,
we used the shrinkage-based GeneNet algorithm36. Multiple hypothesis testing was corrected for by
controlling the FDR at 0.01 using the Benjamini–Hochberg method46.
4.5 Overlap to the biological reference
The overlap between biological reference and correlation network was calculated using Fisher’s exact
tests47,48, which evaluate whether two categorical variables are statistically independent49, with low p-values
indicating a lack of independence. We classified all glycan pairs in a 2x2 contingency table, according to
whether they were connected by an edge in both the data-driven GGM and the biochemical pathway (true
positives), only in the GGM (false positives), only in the pathway (false negatives) or in neither (true
negatives). From these values, the computed Fisher’s exact test p-value can be interpreted as an overlap
measure between the two classifiers (in our case represented by the presence or absence of an edge in the
GGM and in the pathway). The lower the p-value, the higher the overlap. In the context of this paper, the
normalization with the lowest Fisher’s test p-value will produce the GGM with the highest overlap to the
biochemical pathway of glycan synthesis and will be ranked as the best normalization.
Acknowledgements
The CROATIA_Vis, CROATIA_Korčula, and CROATIA_Split studies were funded by grants from the Medical Research
Council (UK), European Commission Framework 6 project EUROSPAN (Contract No. LSHG-CT-2006-018947), FP7
contract BBMRI-LPC (grant No. 313010), Croatian Science Foundation (grant 8875) and the Republic of Croatia Ministry
of Science, Education and Sports (216-1080315-0302). We would like to acknowledge the staff of several institutions in
Croatia that supported the field work, including but not limited to The University of Split and Zagreb Medical Schools,
Institute for Anthropological Research in Zagreb and the Croatian Institute for Public Health. This work was funded in
part by grants from the German Federal Ministry of Education and Research (BMBF), by BMBF Grant No. 01ZX1313C
(project e:Athero-MED), by the European Commission MIMOmics (contract #305280), IMForFuture (contract #721815)
and CarTarDis (contract #602936) grants, and by the European Structural and Investment Funds grant to the Croatian
National Centre of Research Excellence in Personalized Healthcare (#KK.01.1.1.01.0010).
Authors Contributions
E.B. and J.K. conceived and designed the project. M.P.-B., T.K, K.R.R., L.R.R., T.Š., M.J.H.S., I.R., O.P., C.H., M.B., E.S.,
M.G.D., M.W., G.L. contributed the data. E.B. and N.G. performed the analyses on the glycomics data. E.B. and J.K.
wrote the primary manuscript. All authors approved the final manuscript.
Conflict of Interest
G.L. declares that he is a founder and owner of Genos, a private research organization that specializes in high-
throughput glycomics and has several patents in the field. M.P.-B. is an employee of Genos. The remaining authors
declare no competing financial interests.bioRxiv preprint first posted online Oct. 24, 2019; doi: http://dx.doi.org/10.1101/814244. The copyright holder for this preprint
(which was not peer-reviewed) is the author/funder, who has granted bioRxiv a license to display the preprint in perpetuity.
It is made available under a CC-BY-NC-ND 4.0 International license.
References
1. Walt, D. et al. Transforming Glycoscience: A Roadmap for the Future. Nantional Acad. Sci. 1–209
(2012).
2. Johnstone, D. M. et al. Evaluation of Different Normalization and Analysis Procedures for Illumina
Gene Expression Microarray Data Involving Small Changes. Microarrays (Basel, Switzerland) 2, 131–
152 (2013).
3. Välikangas, T., Suomi, T. & Elo, L. L. A systematic evaluation of normalization methods in
quantitative label-free proteomics. Brief. Bioinform. 19, bbw095 (2016).
4. van den Berg, R. A., Hoefsloot, H. C. J., Westerhuis, J. A., Smilde, A. K. & van der Werf, M. J.
Centering, scaling, and transformations: Improving the biological information content of
metabolomics data. BMC Genomics 7, 142 (2006).
5. Kohl, S. M. et al. State-of-the art data normalization methods improve NMR-based metabolomic
analysis. Metabolomics 8, 146–160 (2012).
6. Li, B. et al. Performance evaluation and online realization of data-driven normalization methods
used in LC/MS based untargeted metabolomics analysis. Sci. Rep. 6, 38881 (2016).
7. Houwing-Duistermaat, J. J., Uh, H. W. & Gusnanto, A. Discussion on the paper ‘Statistical
contributions to bioinformatics: Design, modelling, structure learning and integration’by Jeffrey S.
Morris and Veerabhadran Baladandayuthapani. Stat. Modelling 17, 319–326 (2017).
8. Aitchison, J. The Statistical Analysis of Compositional Data. Chapman Hall (1986).
9. Gloor, G. B., Macklaim, J. M., Pawlowsky-Glahn, V. & Egozcue, J. J. Microbiome datasets are
compositional: and this is not optional. Front. Microbiol. 8, 2224 (2017).
10. Xia, F., Chen, J., Fung, W. K. & Li, H. A logistic normal multinomial regression model for microbiome
compositional data analysis. Biometrics 69, 1053–1063 (2013).
11. Mandal, S. et al. Analysis of composition of microbiomes: a novel method for studying microbial
composition. Microb. Ecol. Health Dis. 26, 27663 (2015).
12. Gloor, G. B. & Reid, G. Compositional analysis: a valid approach to analyze microbiome high-
throughput sequencing data. Can. J. Microbiol. 62, 692–703 (2016).
13. Chen, E. Z. & Li, H. A two-part mixed-effects model for analyzing longitudinal microbiome
compositional data. Bioinformatics 32, 2611–2617 (2016).
14. Shi, P., Zhang, A., Li, H. & others. Regression analysis for microbiome compositional data. Ann. Appl.
Stat. 10, 1019–1040 (2016).
15. Aitchison, J. Logratios and natural laws in compositional data analysis. Math. Geol. 31, 563–580
(1999).
16. Aitchison, J., Barceló-Vidal, C., Mart\’\in-Fernández, J. A. & Pawlowsky-Glahn, V. Logratio analysis
and compositional distance. Math. Geol. 32, 271–275 (2000).bioRxiv preprint first posted online Oct. 24, 2019; doi: http://dx.doi.org/10.1101/814244. The copyright holder for this preprint
(which was not peer-reviewed) is the author/funder, who has granted bioRxiv a license to display the preprint in perpetuity.
It is made available under a CC-BY-NC-ND 4.0 International license.
17. Egozcue, J. J., Pawlowsky-Glahn, V., Mateu-Figueras, G. & Barcelo-Vidal, C. Isometric logratio
transformations for compositional data analysis. Math. Geol. 35, 279–300 (2003).
18. Aitchison, J. & Egozcue, J. J. Compositional data analysis: where are we and where should we be
heading? Math. Geol. 37, 829–850 (2005).
19. Tsilimigras, M. C. B. & Fodor, A. A. Compositional data analysis of the microbiome: fundamentals,
tools, and challenges. Ann. Epidemiol. 26, 330–335 (2016).
20. Callister, S. J. et al. Normalization approaches for removing systematic biases associated with mass
spectrometry and label-free proteomics. J. Proteome Res. 5, 277–286 (2006).
21. Rapaport, F. et al. Comprehensive evaluation of differential gene expression analysis methods for
RNA-seq data. Genome Biol. 14, 3158 (2013).
22. Krumsiek, J., Suhre, K., Illig, T., Adamski, J. & Theis, F. J. Gaussian graphical modeling reconstructs
pathway reactions from high-throughput metabolomics data. BMC Syst. Biol. 5, 21 (2011).
23. Rudan, I. et al. “10 001 Dalmatians:” Croatia Launches Its National Biobank. Croat. Med. J. 50, 4–6
(2009).
24. Jefferis, R. & Lefranc, M.-P. Human immunoglobulin allotypes: possible implications for
immunogenicity. MAbs 1, 332–338 (2009).
25. Balbin, M., Grubb, A., de Lange, G. G. & Grubb, R. DNA sequences specific for Caucasian G3m(b) and
(g) allotypes: allotyping at the genomic level. Immunogenetics 39, 187–193 (1994).
26. Vučković, F. et al. IgG Glycome in Colorectal Cancer. Clin. Cancer Res. 22, 3078–3086 (2016).
27. Pucić, M. et al. High throughput isolation and glycosylation analysis of IgG-variability and heritability
of the IgG glycome in three isolated human populations. Mol Cell Proteomics 10, M111.010090
(2011).
28. Reiding, K. R. et al. Human plasma N-glycosylation as analyzed by matrix-assisted laser
desorption/ionization-Fourier transform ion cyclotron resonance-MS associates with markers of
inflammation and metabolic health. Mol. Cell. Proteomics 16, 228–242 (2017).
29. Hansen, K. D., Irizarry, R. A. & Wu, Z. Removing technical variability in RNA-seq data using
conditional quantile normalization. Biostatistics 13, 204–216 (2012).
30. Tsodikov, A., Szabo, A. & Jones, D. Adjustments and measures of differential expression for
microarray data. Bioinformatics 18, 251–260 (2002).
31. Moh, E. S. X., Thaysen-Andersen, M. & Packer, N. H. Relative versus absolute quantitation in disease
glycomics. PROTEOMICS--Clinical Appl. 9, 368–382 (2015).
32. Dieterle, F., Ross, A., Schlotterbeck, G. & Senn, H. Probabilistic quotient normalization as robust
method to account for dilution of complex biological mixtures. Application in1H NMR
metabonomics. Anal. Chem. 78, 4281–4290 (2006).
33. Do, K. T. et al. Phenotype-driven identification of modules in a hierarchical map of multifluid
metabolic correlations. NPJ Syst. Biol. Appl. 3, 28 (2017).bioRxiv preprint first posted online Oct. 24, 2019; doi: http://dx.doi.org/10.1101/814244. The copyright holder for this preprint
(which was not peer-reviewed) is the author/funder, who has granted bioRxiv a license to display the preprint in perpetuity.
It is made available under a CC-BY-NC-ND 4.0 International license.
34. Koch, A. L. The logarithm in biology 1. Mechanisms generating the log-normal distribution exactly. J.
Theor. Biol. 12, 276–290 (1966).
35. Furusawa, C., Suzuki, T., Kashiwagi, A., Yomo, T. & Kaneko, K. Ubiquity of log-normal distributions in
intra-cellular reaction dynamics. Biophysics (Oxf). 1, 25–31 (2005).
36. Schäfer, J. & Strimmer, K. A shrinkage approach to large-scale covariance matrix estimation and
implications for functional genomics. Stat. Appl. Genet. Mol. Biol. 4, Article32 (2005).
37. Benedetti, E. et al. Network inference from glycoproteomics data reveals new reactions in the IgG
glycosylation pathway. Nat. Commun. 8, 1483 (2017).
38. Do, K. T. et al. Characterization of missing values in untargeted MS-based metabolomics data and
evaluation of missing data handling strategies. bioRxiv 260281 (2018). doi:10.1101/260281
39. Selman, M. H. J. et al. Fc specific IgG glycosylation profiling by robust nano-reverse phase HPLC-MS
using a sheath-flow ESI sprayer interface. J. Proteomics 75, 1318–1329 (2012).
40. Huffman, J. E. et al. Comparative performance of four methods for high-throughput glycosylation
analysis of immunoglobulin G in genetic and epidemiological research. Mol. Cell. Proteomics 13,
1598–1610 (2014).
41. Theodoratou, E. et al. Dietary flavonoids and the risk of colorectal cancer. Cancer Epidemiol.
Biomarkers Prev. 16, 684–93 (2007).
42. Schoenmaker, M. et al. Evidence of genetic enrichment for exceptional survival using a family
approach: the Leiden Longevity Study. Eur. J. Hum. Genet. 14, 79–84 (2006).
43. Aitchison, J. A Concise Guide to Compositional Data Analysis. CDA Work. Girona 24, 73–81 (2003).
44. Bolstad, B. M., Irizarry, R. ., Astrand, M. & Speed, T. P. A comparison of normalization methods for
high density oligonucleotide array data based on variance and bias. Bioinformatics 19, 185–193
(2003).
45. Taniguchi, N., Honke, K. & Fukuda, M. Handbook of glycosyltransferases and related genes.
(Springer Science & Business Media, 2012).
46. Benjamini, Y. & Hochberg, Y. Controlling the false discovery rate: a practical and powerful approach
to multiple testing. J. R. Stat. Soc. B 57, 289–300 (1995).
47. Seneta, E. & Phipps, M. C. On the Comparison of Two Observed Frequencies. Biometrical J. 43, 23–
43 (2001).
48. Phipps, M. C. Inequalities Between Hypergeometric Tails. J. Appl. Math. Decis. Sci. 7, 165–174
(2003).
49. Routledge, R., Routledge & Rick. Fisher’s Exact Test. in Encyclopedia of Biostatistics (John Wiley &
Sons, Ltd, 2005). doi:10.1002/0470011815.b2a10020bioRxiv preprint first posted online Oct. 24, 2019; doi: http://dx.doi.org/10.1101/814244. The copyright holder for this preprint
(which was not peer-reviewed) is the author/funder, who has granted bioRxiv a license to display the preprint in perpetuity.
It is made available under a CC-BY-NC-ND 4.0 International license.
Figures
Figure 1: Pipeline for the evaluation of different normalization methods for glycomics data. First, data are normalized
with various approaches. From each processed dataset, a GGM is inferred and compared to the known biochemical
pathway of glycan synthesis. The result of this comparison is a quantitative overlap value that describes how well the
estimated GGM represents known synthesis reactions. This overlap is the used to evaluate the normalization approach,
where higher overlap corresponds to a better data normalization.bioRxiv preprint first posted online Oct. 24, 2019; doi: http://dx.doi.org/10.1101/814244. The copyright holder for this preprint
(which was not peer-reviewed) is the author/funder, who has granted bioRxiv a license to display the preprint in perpetuity.
It is made available under a CC-BY-NC-ND 4.0 International license.
Figure 2: LC-ESI-MS normalization analysis results (Korčula 2013 cohort). Results in the panels are colored according
to type of normalization (left), log-transformation (center), or normalization per IgG subclass or total IgG (right). Bars
represent the median of the Fisher’s exact test p-values over 1,000 bootstrap samples, and error bars indicate the
corresponding 95% confidence intervals.bioRxiv preprint first posted online Oct. 24, 2019; doi: http://dx.doi.org/10.1101/814244. The copyright holder for this preprint
(which was not peer-reviewed) is the author/funder, who has granted bioRxiv a license to display the preprint in perpetuity.
It is made available under a CC-BY-NC-ND 4.0 International license.
Figure 3: UHPLC-FLD normalization analysis results (CRC cohort). Results in the panels are colored according to type
of normalization (left), or log-transformation (right). Bars represent the median of the Fisher’s exact test p-values over
1,000 bootstrapping, and error bars the corresponding 95% confidence intervals.
Figure 4: MALDI-FTICR-MS normalization analysis results (LLS cohort). Results in the panels are colored according to
type of normalization (left), or log-transformation (right). Bars represent the median of the Fisher’s exact test p-values
over 1,000 bootstrapping, and error bars the corresponding 95% confidence intervals.bioRxiv preprint first posted online Oct. 24, 2019; doi: http://dx.doi.org/10.1101/814244. The copyright holder for this preprint
(which was not peer-reviewed) is the author/funder, who has granted bioRxiv a license to display the preprint in perpetuity.
It is made available under a CC-BY-NC-ND 4.0 International license.
Tables
Table 1: Summary of datasets.
LC-ESI-MS UHPLC-FLD MALDI-FTICR
Korčula Korčula
Dataset name Split Vis CRC controls LLS
2013 2010
Glycans measured IgG Fc IgG Fc IgG Fc IgG Fc IgG total Total plasma
Number of peaks 50 50 50 50 24 61
Number of samples
669 504 980 395 535 2,056
for analysisbioRxiv preprint first posted online Oct. 24, 2019; doi: http://dx.doi.org/10.1101/814244. The copyright holder for this preprint
(which was not peer-reviewed) is the author/funder, who has granted bioRxiv a license to display the preprint in perpetuity.
It is made available under a CC-BY-NC-ND 4.0 International license.
Table 2: Evaluated normalization methods.
Normalization Label Group
Raw Raw Basic
Normalizations
Quantile per glycan Quantile
Rank per glycan Rank
Total Area TA
Median Centering Median
Probabilistic Quotient Quotient
Total Area + Probabilistic Quotient TAQuotient
log(Raw) Raw log Logarithm
log(Quantile per glycan) Quantile log
log(Rank per glycan) Rank log
log(Total Area) TA log
log(Probabilistic Quotient) Quotient log
log(Total Area + Probabilistic Quotient) TAQuotient log
(Quantile per glycan) per IgG subclass Quantile subclass Per Subclass
(Rank per glycan) per IgG subclass Rank subclass
(Total Area) per IgG subclass TA subclass
(Probabilistic Quotient) per IgG subclass Quotient subclass
(Total Area + Probabilistic Quotient) per IgG subclass TAQuotient subclass
(log(Quantile per glycan)) per IgG subclass Quantile log subclass
(log(Rank per glycan) per IgG subclass Rank log subclass
(log(Total Area)) per IgG subclass TA log subclass
(log(Probabilistic Quotient)) per IgG subclass Quotient log subclass
(log(Total Area + Probabilistic Quotient)) per IgG subclass TAQuotient log subclassYou can also read


