Forecasting recovery from COVID-19 using financial data - An application to Viet Nam - UNU-WIDER
←
→
Page content transcription
If your browser does not render page correctly, please read the page content below

WIDER Working Paper 2021/84

Forecasting recovery from COVID-19 using
financial data

An application to Viet Nam

Jesse Lastunen1 and Matteo Richiardi2

May 2021
Abstract: We develop a new methodology to nowcast the effects of the COVID-19 crisis and
forecast its evolution in small, export-oriented countries. To this aim, we exploit variation in
financial indexes at the industry level and relate them to the expected duration of the crisis for
each industry, under the assumption that the main shocks to financial prices in recent months have
come from COVID-19. Starting from the latest information available on the size of the shock at
the industry level, often a few months old, we predict the ensuing recovery trajectories using the
most recent financial data available, monitoring how subsequent waves of infections and
information about new vaccines have impacted expectations about the future. We apply our
method to Viet Nam, one of the most open economies in the world, and obtain predictions that
are close to (though more optimistic than) later projections by the International Monetary Fund
and other international forecasters. Our claim is that this better-than-expected performance was
visible in stock market data early on but was largely missed by conventional methods. The
Vietnamese application hence supports the validity of our method, showing that financial
information can be used to accurately nowcast recovery paths following a large economic shock
such as a global pandemic.
Key words: COVID-19, pandemic, economic recovery, nowcasting, financial markets, Viet Nam
JEL classification: C53, F47, G01, G17
Acknowledgements: We thank our colleagues at UNU-WIDER and the University of Essex for
their valuable feedback and comments.

1 UNU-WIDER, corresponding author: lastunen@wider.unu.edu; 2 Centre for Microsimulation and Policy Analysis, University of

Essex, Colchester, UK
This study has been prepared within the UNU-WIDER project on Academic excellence.
Copyright © UNU-WIDER 2021
UNU-WIDER employs a fair use policy for reasonable reproduction of UNU-WIDER copyrighted content—such as the
reproduction of a table or a figure, and/or text not exceeding 400 words—with due acknowledgement of the original source,
without requiring explicit permission from the copyright holder.
Information and requests: publications@wider.unu.edu
ISSN 1798-7237 ISBN 978-92-9267-024-5
https://doi.org/10.35188/UNU-WIDER/2021/024-5
Typescript prepared by Joseph Laredo.
United Nations University World Institute for Development Economics Research provides economic analysis and policy advice
with the aim of promoting sustainable and equitable development. The Institute began operations in 1985 in Helsinki, Finland, as
the first research and training centre of the United Nations University. Today it is a unique blend of think tank, research institute,
and UN agency—providing a range of services from policy advice to governments as well as freely available original research.
The Institute is funded through income from an endowment fund with additional contributions to its work programme from
Finland, Sweden, and the United Kingdom as well as earmarked contributions for specific projects from a variety of donors.
Katajanokanlaituri 6 B, 00160 Helsinki, Finland
The views expressed in this paper are those of the author(s), and do not necessarily reflect the views of the Institute or the United
Nations University, nor the programme/project donors.
1 Introduction

COVID-19 has caused havoc worldwide, in both health and economic terms. In its World
Economic Outlook published in October 2020 the International Monetary Fund (IMF) predicted
a contraction of -4.4 per cent in global real GDP in 2020, against an average real growth rate of
3.8 per cent in the period 2000–19 (IMF 2020). This will be the deepest recession since 1945/46,
and more than twice as deep as the recession associated with the 2007–09 global financial crisis
(World Bank 2020). While there is large national and industry variation, with some countries
experiencing far more limited negative outcomes than others and some sectors even benefiting
from COVID (generally, everything online, and logistics), there is no doubt that the COVID-19
crisis is a globally defining event that obscured almost everything else that happened in 2020.

One of the many issues on which COVID-19 has found the world unprepared is availability of
data. Important decisions on the type and timing of restrictions are based on readily available
health data, but their impact on the economy is monitored only with a lag. This implies that policies
to support the economy are also delayed, or implemented under political pressures but not based
on clear evidence. Nowcasting, a set of techniques to update older data using more recent external
information, has therefore come to the front stage. Nowcasting exploits co-movements between
economic variables, typically in the form of dynamic factor models, to predict changes in some
unobserved variables based on changes in observed ones (Banbura et al. 2013; Stock and Watson
2016). The variables used for prediction typically become available at different frequencies and
with different delays—some measured in weeks or months; others, financial variables in particular,
almost in real time. Nowcasting is, however, typically used to help predict short-term dynamics,
not to forecast the longer-term evolution of the economy. Even financial variables, which are
forward-looking by nature and have generally been found useful to improve the accuracy of the
predictions (Andreou et al. 2013; Knotek et al. 2019), are rarely exploited for longer-term forecasts.

Yet, particularly in a crisis, policy-makers need projections a few months ahead, as these provide
crucial information both on how much support the economy needs and on how sustainable that
support is for public finances. The business of forecasting recovery trajectories from crises is
generally in the hands of international organizations like the OECD, the World Bank, and the
IMF. Governments also engage in independent projections, when they have enough institutional
capacity; examples are the Congressional Budget Office (CBO) in the US and the Office for Budget
Responsibility (OBR) in the UK. These predictions are based on different methods or
combinations thereof, including expert judgement, statistical analysis, and macro-econometric
models, although the models used are generally not fully disclosed. The availability of such
analyses, and especially the national-level data required to produce them, is particularly limited in
low- and middle-income countries.

In this paper we develop a new method for projecting recovery from COVID-19 by industry,
based on simple, publicly available information. The method elicits expectations about the
unfolding of the crisis from financial data, under the assumption that, at a global level, variations
in sectoral indexes in 2020 have been mainly driven by news about COVID-19. This sectoral
information is then applied to a specific national context, by weighting sectors by pre-crisis
quarterly GDP shares and starting from initially observed sectoral shocks.

The crucial assumption that COVID-19 was a main driver of financial prices in 2020 requires
clarification and justification. The fact that financial prices embed expectations about the future is
rarely questioned, but these expectations generally compound information on many different
events. While singling out one event from all those that might impact on stock prices is in general

 1
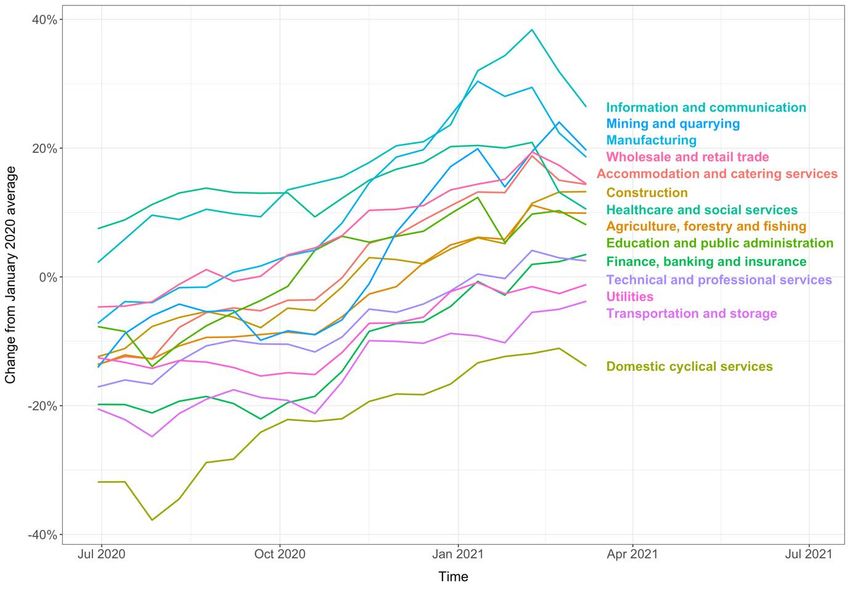
not a good strategy, we believe that it is valid in this case, given the size and the pervasiveness of
the COVID-19 crisis. For instance, when the results of the phase-3 (large-scale) clinical trial of the
Pfizer-BioNTech vaccine—the first one to arrive at this stage and file for authorization—were
announced on 18 November and indicated more than 90 per cent efficacy, energy and travel stocks
surged. The S&P 500 Energy Sector index, which had been down more than 50 per cent since the
beginning of the crisis, shot up 14.8 per cent in a single trading day, while airlines, down more than
45 per cent, jumped 15.2 per cent.

Figure 1 shows the three-year evolution of the S&P500, Dow Jones, Nikkei 225, Hang Seng, and
Dax indexes (top) as well as the population-weighted values of the Oxford Government Stringency
Index and new cases of COVID-19 around the world as a share of maximum cases.
Figure 1: Evolution of financial performance indexes, January 2018–February 2021, vs. new cases of COVID-19

Note: index closing prices are normalized to 1, starting on 2 January 2018 (top); population-weighted Oxford
Government Stringency Index and smoothed new cases of COVID-19 around the world as a share of maximum
cases (bottom).
Source: authors’ computation based on Yahoo Finance (top) and Our World in Data, Johns Hopkins University
(bottom).

 2
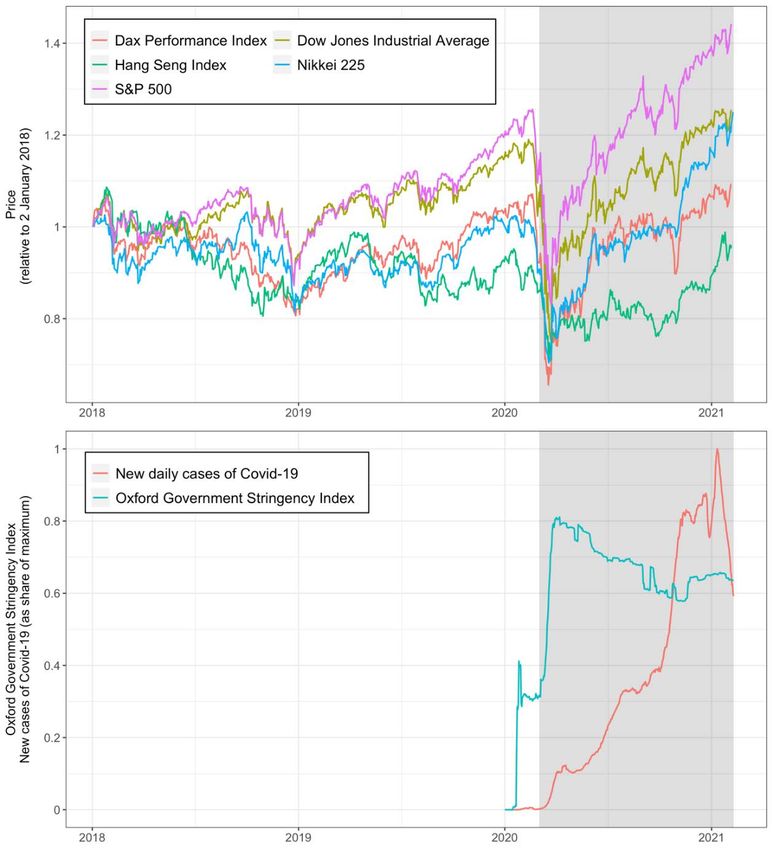
The area representing time from March 2020, generally accepted as the start of the crisis, onwards
is shaded in grey. The second wave of the pandemic is also visible in the figure, with large dents
in some financial indexes in the fall of 2020, when new cases surged globally. Fluctuations around
the general pattern of a large shock followed by a steady recovery seem minor, in comparison.

The financial reactions to the pandemic are also visible in national figures. Figure 2 shows the same
information as Figure 1 for Viet Nam, using stock market data for three sectoral indexes—
Vietnamese industrials, cyclicals, and non-cyclicals. New daily cases have peaked in three distinct
waves. Each time government lockdown measures have become more intense, stock prices have
plummeted.
Figure 2: Evolution of sectoral stock indexes from January 2018 until February 2021 vs. new cases of COVID-19

Note: closing prices normalized to 1, starting on 1 January 2018 (top). Oxford Government Stringency Index and
smoothed new cases of COVID-19 in Viet Nam as a share of maximum cases (bottom).
Source: authors’ computation based on Refinitiv Eikon (top) and Our World in Data, Johns Hopkins University
(bottom).

 3
Our method distinguishes between domestic and exporting sectors. Expectations about domestic
sectors show up mostly in the value of local firms, while expectations about exporting sectors, due
to the pressure of international competition, can be elicited by looking at broader aggregates. This
helps average out the effects of local information and events that are unrelated to the recovery.
For instance, a national government might decide to pay subsidies to domestic companies that
have been badly affected by the crisis. This, ceteris paribus, increases the stock market value of
these companies, but does not imply a faster recovery. However, financial indexes computed over
thousands of companies located in many different countries and selling to different export markets
are broadly unaffected by local policies and driven mainly by expectations about global demand
and supply. This is why we suggest that our method works better for (typically small) exporting
countries.

We test our method on Viet Nam. Viet Nam is one of the countries least affected by COVID-19.
Indeed, in October 2020 its growth rate for the whole year was predicted by the IMF to be 1.6 per
cent in real terms, against -3.3 per cent for all emerging economies (IMF 2020). Still, this is
significantly below the pre-COVID trend of 6.7 per cent for the average annual growth rate from
2000 to 2019. It is also lower than the average growth rate from 2015 to 2019, 6.8 per cent, which
we use as our preferred counterfactual trend for 2020, while also accounting for differential growth
rates across sectors.

Our choice of Viet Nam as a test case is motivated by its nature as an exporting country. According
to World Bank data, with a trade intensity (sum of imports and exports over GDP) of over 200
per cent (coming almost exclusively from exports) Viet Nam is ranked 8th in the world for trade
openness, after Luxembourg, Hong Kong, Singapore, San Marino, Djibouti, Malta, and Ireland.

Our choice of Viet Nam is also motivated by the availability of timely data on GDP at the industry
level, which allows us to test the validity of the method by comparing our predictions for Q3/2020
and Q4/2020 based on industry-level data for Q2/2020 with the actual data for those quarters.
We also replicate the exercise by updating our predictions using Q3/2020 industry-level data and
comparing our forecasts with observed Q4/2020 data. This offers only partial validation, as our
predictions are based on elicited expectations, and ex-ante expectations can be (and generally are)
different from ex-post realizations. In other words, even the best possible predictions might turn
out to be wrong. Full validation of the method would require testing in multiple settings and over
multiple timeframes—something that we have to leave for future research.

However, our initial results are encouraging. When Q2/2020 industry-level GDP data were
released in September 2020, our method would have predicted—using financial data available at
the release date—a -3.5–5.2 per cent (point estimate -4.1 per cent) contraction in real GDP for
Viet Nam in 2020 with respect to trend. 1 Feeding the model with Q3/2020 data, and using financial
data available until 28 December, brings this estimated annual shock to -3.8–4.0 per cent (point
estimate -3.9 per cent). At the time of writing, the General Statistical Office (GSO) of Viet Nam
has just published its preliminary GDP figures for 2020, which imply a full-year contraction of
-4.0 per cent with respect to trend. 2 This is assuming, as we do in our estimates, that each industry
would have grown at its 2015–19 rate (on average 6.8 per cent) in the absence of the pandemic,

1
 We assume that, in the absence of COVID-19, quarterly GDP in each industry would have grown at the average
yearly inflation-adjusted rate that it grew over the 2015–19 period.
2
 A -4.0 per cent trend reduction corresponds to a 2.5 per cent growth rate in 2020. Note that, when referring to GDP,
we use the total annual output across all sectors in the economy, ignoring taxes and subsidies. Accounting for taxes
and subsidies, the full-year trend reduction and real growth rate in GDP from data were roughly the same, -3.6 per
cent and 2.9 per cent, respectively.

 4
while stock prices would likewise have followed their sectoral trends from 2015 until the end of
2019.

Our predictions are not only simpler to derive but at least on this occasion more accurate than
other prominent projections by international organizations and private companies. In October,
the IMF (2020) estimated that real GDP in Viet Nam would be 4.9 per cent lower than predicted
based on the average growth rate over the past five years (6.8 per cent). Trade credit insurer
Atradius (2020) projected a 4.2 per cent drop from trend in November, and estimates from
September by the Asian Development Bank (2020) implied a 4.7 per cent trend reduction. The
Vietnamese government itself set a GDP growth target in September that corresponded to a 4.0–
4.5 per cent trend reduction (Nikkei Asia 2020). 3

Our estimates are generally more optimistic than other projections—an optimism that was later
confirmed in the data. We can explain this with the more positive outlook that was prevalent
before the second wave of the pandemic hit the world in the fall of 2020, which is reflected in the
financial data but perhaps less so in the big, complicated macroeconomic models used by other
forecasters (see Section 2).

The rest of the paper is organized as follows. Section 2 is devoted to reviewing macro-projection
methods. Section 3 presents our approach, while Section 4 describes the data used. Section 5 offers
our results, with concluding remarks contained in Section 6.

2 Macro-projection methods

Macro-projection methods by institutional forecasters typically have two characteristics: (i) they
are complicated, in an attempt to make the best use of data coming from different sources,
integrating different modelling approaches and expert judgements; and (ii) they are seldom fully
disclosed, or only partially documented. For instance, the OECD combines ‘expert judgement
with a variety of existing and new information relevant to current and prospective developments.
These include revised policy settings, recent statistical outturns and conjunctural indicators,
combined with analyses based on specific economic and statistical models and analytical
techniques.’ 4 The macro-econometric model used by the OECD is the new-Keynesian model
NiGEM developed by the British National Institute of Economic and Social Research (NIESR),
which, however, offers only a 14-page technical report discussing the theoretical framework and
modelling assumptions, with no information on estimation. 5 Only five references are cited, the
most recent dating back to 2006.

3
 The various trend reduction and corresponding real growth estimates for GDP in 2020 include: a -4.1 per cent trend
change or 2.4 per cent GDP growth (our September 2020 point estimate); -4.0 per cent or 2.5 per cent (official data);
-4.9 per cent or 1.6 per cent (IMF, October); -4.2 per cent or 2.3 per cent (Atradius, November); -4.7 per cent or 1.8
per cent (ADB, September); -4.0–4.5 per cent or 2.0–2.5 per cent (government growth targets, September).
4
 OECD (2011) Forecasting methods and analytical tools. www.oecd.org/economy/outlook/
forecastingmethodsandanalyticaltools.htm (accessed 6 January 2021).
5
 See https://nimodel.niesr.ac.uk. To be fair to NIESR, full documentation would be massive. Each country model,
according to the NiGEM website, contains between 80 and 200 variables depending on the data and model structure
used. Considering that the model is applied to 44 countries, this makes a total of 6,000 variables and over 10,000
model equations.

 5

Not much is known about the methods employed by the IMF for its World Economic Outlook,
except an older paper taking an historical approach (Boughton 1997; see also chapter 5 in
Boughton 2001). One problem, of course, is that economies are linked, so that trade patterns also
need to be modelled. The specific IMF model for developing countries—at least until the late
1990s—comprised ‘some two dozen behavioural equations plus around 60 identities’, taking some
outputs of a wider model as exogenous inputs (Boughton 1997).

Obviously, these modelling exercises face two very difficult challenges: they have to work in
different country contexts, and they have to work at all times, hence predicting growth potentials
and not only recoveries from shocks (Cristelli et al. 2017). In the wake of COVID-19, institutional
forecasters turned to their models and tried to adapt them to the rapidly changing circumstances.
Our claim is that for the sake of predicting recovery trajectories from COVID-19 at an industry
level for small exporting countries, a much simpler, easier to understand, and faster to update
modelling approach could be at least as effective.

3 Eliciting expectations from financial markets

It is clear that the economic recovery from COVID-19 strongly depends on the health recovery,
and the general evolution of the pandemic. These in turn depend crucially on the timing of
deployment, coverage, and effectiveness of vaccines. These are hard to predict, with new
information often contradicting previous information (for instance, on the planned rollout of
vaccination campaigns). In the absence of a crystal ball, we turn to the ‘wisdom of the crowd’ and
look at the reaction of financial markets. Our starting point is that changes in financial values are
proportional to changes in the expected flows of future profits. We make the assumption that the
reduction in future profits due to COVID-19 is in turn proportional to the reduction in output,
which is what we want to measure. We also assume that, at any given point in time, expectations
about recovery at a future time follow a negative exponential trajectory:

 = − 0 − (1)

where output loss is measured against its de-trended pre-crisis level and 0 is the level of the
initial loss. This assumption, like all subsequent steps in the analysis, is implemented at the level of
individual industries; we have omitted the related subscript from the formulas for brevity. Figure
3 depicts alternative recovery trajectories, with different values of , starting from an initial shock
of 0 . Higher values of correspond to more V-shaped recoveries, while lower values of
correspond to more linear recoveries.

 6
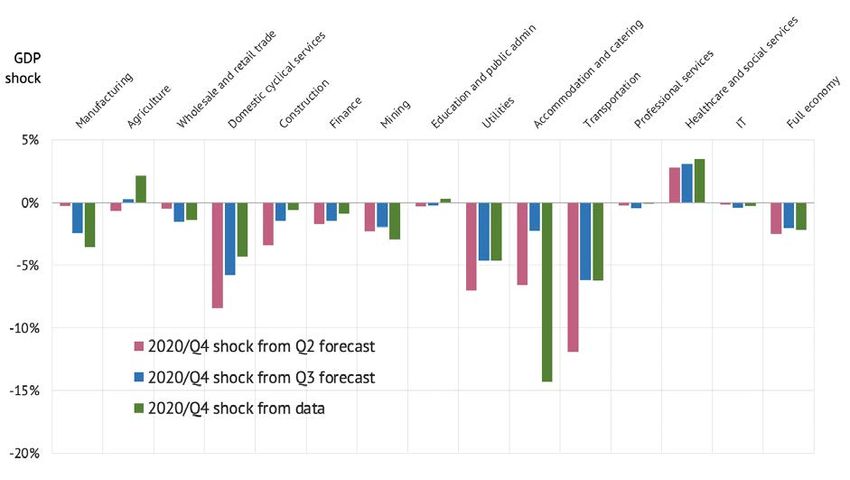
Figure 3: Recovery trajectories, different values of g

Source: authors’ construction.

If the assumption that profit losses are proportional to output losses is approximately true, the
loss in asset value is then proportional to the area above the recovery trajectories, opportunely
discounted. This corresponds to the present value of the output losses:

 0 = ∫ − 0 − = − −ln( )
 0
 0) and the financial loss 0 (< 0) allows to compute from
(2): 6

 = ln( ) − 0 > 0 (3)
 0

From here, we can calculate the cumulative output loss at any future time . We also annualize this
loss to compare it with the initial shock. Assuming that corresponds to days (from the start):

 365 365 0 − 0 −
 , =(
 ) ∫ =0 − 0 − = −(
 ) (4)
 −ln( )

In (4), the initial shock 0 is parameterized by the observed shock to output over the latest time
period available, 0 . In the context of our application to Viet Nam, this initial shock is first
calculated by comparing quarterly output in Q2/2020 with quarterly output a year earlier, in

6
 Note that we require > ln( ) based on formula (2), and hence 0 > 0 and 0 < 0. Equivalently, we need 0 < 0
and 0 > 0 when estimating the output trajectory for sectors with positive initial shocks using a corresponding
exponential decay function. This condition is not fulfilled, for instance, when financial losses for a given sector (with
initial output loss 0 > 0) become zero or turn into financial gains compared with baseline. In this case, we use an
arbitrary threshold level for financial loss, 0, = −0.005. This causes the recovery trajectory for output, derived
in formula (4), to approach zero gradually. Simply assuming that cumulative output loss becomes zero when financial
recovery is achieved leads to unrealistic results; for instance, annualized output shock could turn from -10 per cent to
0 per cent in a single two-week period. In Section 5, we show how estimated recovery trajectories change with different
values for the financial loss threshold.

 7
Q2/2019, but uprating the latter by the average annual growth rate of (industry-level) output
before the pandemic, ∆ : 7

 2/2020 − 2/2019 �1+∆ �
 2/2020 = − >0 (5)
 2/2019 �1+∆ �

Note that data on output are updated less frequently than financial data, which are available in real
time. We can then make the assumption that the recovery in output follows the trajectory predicted
by equation (4) and then update our projections using financial data only. The updating procedure
is implemented in each subsequent period (with available financial data) by replacing 0 in
equation (3) with its observed value , and 0 in equations (3) and (4) with its latest projected

value = , . In the Vietnamese application presented in this paper, the recovery path is
updated biweekly.

All variables in the analysis are available or computed for individual industries in Viet Nam. This
also applies to financial loss , at time , which is parameterized by the percentage change in the
biweekly average of daily mean prices ( , ) of a given sectoral stock index from its January 2020
average ( ̅ , ):
 , − ̅ ,
 , =
Q4/2020, and beyond. Our estimate for annual GDP loss is the weighted average of the estimated
quarterly GDP shocks for that year, where weights are the shares of output produced in each
quarter of 2019.

In the case illustrated above, the estimated GDP loss from trend for 2020 is the weighted average
of shocks in Q1 and Q2 (from GDP data and counterfactual growth trends in stock prices) and
Q3 and Q4 (from the model).

Also note that we derive the biweekly shock estimates for the full economy as the weighted average
of industry-level shocks, where weights are the GDP shares for different sectors in 2019.

4 Data

4.1 Industry-level GDP

We test our method using data from Viet Nam. The quarterly industry-level GDP data, used to
derive the output shocks resulting from the pandemic, come from the General Statistical Office
(GSO) of Viet Nam. 9 We use information from all 20 industries provided in the quarterly data but
aggregate them into 14 macro sectors that can be more appropriately matched with financial
information from selected stock indexes. The list of industries used is provided in Table 1, along
with the corresponding index used in the analysis; the geographical scope of the index; the share
of each sector in the Vietnamese GDP in 2019; and its relative trade intensity.
Table 1: Industries used

Industry GDP Corresponding Geography Relative trade
 share financial index of index intensity
 (2020) (2017)

Manufacturing 21% Industrial goods Asia-Pacific 129%
Agriculture, forestry and fishery 15% Applied resources Asia-Pacific 67%
Wholesale and retail trade 11% Retailers Asia-Pacific 76%
Domestic cyclical services 9% Consumer cyclicals Viet Nam 19%
 Administrative and supporting
 activities
 Art, entertainment and recreation
 Real estate
 Self-employment and self-
 consumption
 Other services
Construction 7% Construction materials Asia-Pacific 50%
Finance, banking and insurance 7% Financials Asia-Pacific 34%
Mining and quarrying 6% Metals and mining Asia-Pacific 166%
Education and public administration 6% Consumer non-cyclicals Viet Nam 15%
 Activities of the Communist Party;
 socio-political organizations; public
 administration and defence;
 compulsory social security
 Education and training

9
 General Statistics Office (GSE), Viet Nam. Data available at: https://www.gso.gov.vn/en/data-and-statistics/.

 9
Utilities 6% Utilities Asia-Pacific 14%
 Electricity, gas, steam and air- (no domestic
 conditioning supply index
 available)
 Water supply, sewerage
 management and waste treatment
Accommodation and catering 4% Consumer cyclicals Asia-Pacific 128%
services
Transportation and storage 3% Transportation Asia-Pacific 122%
Technical and professional services 2% Industrial and Asia-Pacific 36%
 commercial services
Healthcare and social services 1% Healthcare Asia-Pacific 52%
Information and communications 1% Technology Asia-Pacific 52%
Total 100% 100%

Note: Column 1: industries used in the analysis; industries in italic type are aggregated into the category above
(in roman type). Column 2: corresponding sectoral stock indexes used in the analysis. Column 3: geographical
scope of the index (either Viet Nam or Asia-Pacific). Column 4: size of sector with respect to Vietnamese GDP in
2019 (GSO 2020). Column 5: relative trade intensity, computed as the ratio of the sectoral trade intensity to
economy-wide trade intensity (imports plus exports divided by GDP). For some domestically oriented sectors
(e.g. utilities), an Asia-Pacific index is used due to the lack of availability of a domestic index.
Source: GSO (2020, columns 1 and 4); Refinitiv Eikon (2020, columns 2 and 3); Asian Development Bank (2018,
column 5).

The GDP shares point to each sector’s importance for the Vietnamese economy, while the relative
trade intensities reflect their openness to international markets. We define relative trade intensity
as the ratio of sectoral trade intensity (imports plus exports over GDP) to the overall trade intensity
for Viet Nam. This measure is reported rather than the absolute trade intensity because sectoral
data come from the input–output tables produced by the Asian Development Bank (2018), which
are not entirely consistent with the widely used economy-wide World Bank data on trade intensity
(see Section 1). Section 4.2. below discusses the financial indexes in greater detail.

Table 2 shows the average annual growth rate in 2015–19 across sectors, used to derive
counterfactual output levels in 2020, as well as the quarterly and annual de-trended output shocks
for 2020, as measured in the official data in early 2021.
Table 2: Average annual growth rate and de-trended output shocks

 AAGR, Output shocks
 2015–19
Industry Q1/2020 Q2/2020 Q3/2020 Q4/2020 2020

Manufacturing 12.6% -4.9% -8.2% -7.8% -3.6% -6.1%
Agriculture, forestry and fishery 2.5% -2.4% -0.7% 0.3% 2.1% 0.2%
Wholesale and retail trade 8.5% -2.6% -5.1% -2.7% -1.4% -2.7%
Domestic cyclical services 5.1% -1.7% -9.8% -6.1% -4.3% -5.5%
Construction 9.2% -4.5% -4.2% -2.0% -0.6% -2.3%
Finance, banking and insurance 8.2% -0.7% -1.8% -1.5% -0.9% -1.2%
Mining and quarrying -3.2% -1.0% -2.6% -2.8% -3.0% -2.5%
Education and public 6.5% -1.0% -0.3% -0.3% 0.3% -0.3%
administration
Utilities 9.8% -2.3% -8.8% -5.2% -4.6% -5.2%
Accommodation and catering 7.3% -17.1% -34.1% -16.8% -14.3% -20.5%
services
Transportation and storage 7.8% -8.1% -16.4% -6.6% -6.2% -9.0%
Technical and professional 7.0% -0.7% -0.2% -0.4% -0.1% -0.3%
services
Healthcare and social services 7.3% 2.5% 3.1% 3.2% 3.5% 3.1%

 10
Information and communications 7.7% -0.2% -0.2% -0.5% -0.3% -0.3%
All industries 6.8% -3.6% -6.3% -4.2% -2.2% -4.0%

Note: Column 1: average annual growth rates in 2015–19, used to derive counterfactual output levels in 2020.
Columns 2–6: quarterly and annual output shocks with respect to trend, computed using output levels from
official data, and counterfactual levels using the 2015–19 growth rates of Column 1.
Source: authors’ computation based on GSO 2020–21 data.

4.2 Financial data

As already discussed, there is a trade-off to be considered in choosing the financial indexes to use
in our model. National indexes are by definition better descriptors of a national economy; however,
they might be influenced by specific national policies and other national factors that are unrelated
to the recovery potential. More geographically aggregated indexes are less influenced by national
policies aimed at supporting businesses during the pandemic; however, they are less representative
of the national economy. The disadvantages of a more aggregated index are diminished for more
export-led sectors, where performance and output are primarily linked to global rather than
domestic demand. This, together with the fact that sectoral indexes are available only for broad
aggregates for many developing countries, motivates our claim that our method is better suited for
a small, export-led economy, and contributes to our choice of Viet Nam as a testbed, as discussed
in Section 1. Sectoral indexes for Vietnamese companies are, moreover, available only for broad
aggregates such as consumer cyclicals and consumer non-cyclicals. We use sectoral indexes for the
Asia-Pacific region and two Vietnamese indexes as provided by Refinitiv Eikon, a global provider
of financial market data and infrastructure. We assume that they are representative, at the industry
level, of the Vietnamese export-led economy. Table 1 lists our choice of index and its geographical
scope for each sector.

As discussed in Section 3, we use the values of each index in January 2020 as the reference to
compute subsequent losses. Figure 4 shows the evolution of the sectoral indexes, where indexes
are denoted by the name of the corresponding sector used in the analysis.

 11
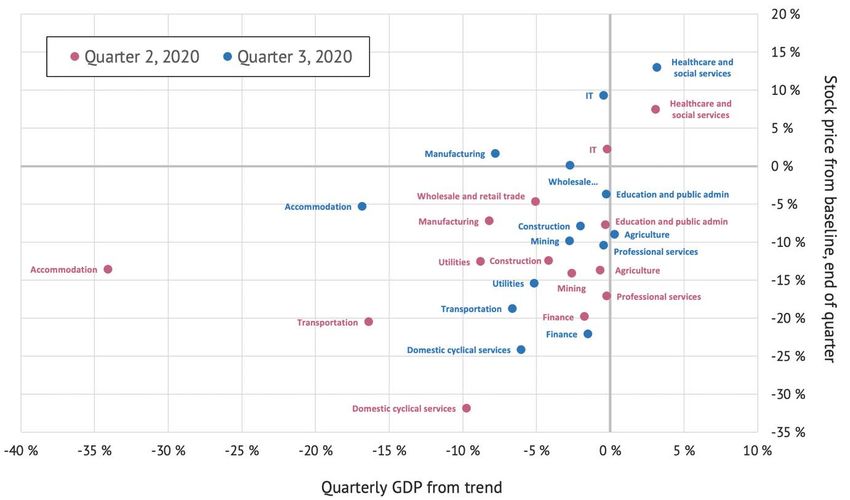
Figure 4: Evolution of sectoral indexes for Viet Nam and the Asia-Pacific region

Note: price levels are biweekly averages as a change from the January 2020 average, de-trended using the
average annual growth rate in each index from 2015 until the end of 2019 (see Figure A1 in Appendix).
Source: authors’ computation based on Refinitiv Eikon.

The recovery trajectories differ considerably across sectors. It is notable, however, that the indexes
underlying the two industries that account for roughly a third of Viet Nam’s GDP—manufacturing
and trade—have recovered rapidly, both reaching their January 2020 levels by October. In
addition, many of the indexes picked up growth in the early fourth quarter. This translates to the
rapid recovery in output during this period that is visible in our findings (see Section 4).

Finally, as mentioned briefly in Section 3, our reliance on the negative exponential (and exponential
decay) functions means that the model can be used, without additional assumptions, when a sector
experiences either (i) financial losses in the presence of a negative output shock, or (ii) financial
gains in the presence of a positive output shock. Figure 5 shows that this condition is generally
satisfied in our data. Using industry-level observations from the second and third quarters of 2020,
Figure 5 plots quarterly output shocks (deviations in 2020 from the five-year trend) against
corresponding financial gains or losses (changes in de-trended sectoral stock prices from the
January baseline at the end of both quarters). Most of the observations lie in the first and third
quadrants, where financial and output shocks are either both positive or both negative. The
positive correlation between financial and output shocks is also visible in the graph.

 12
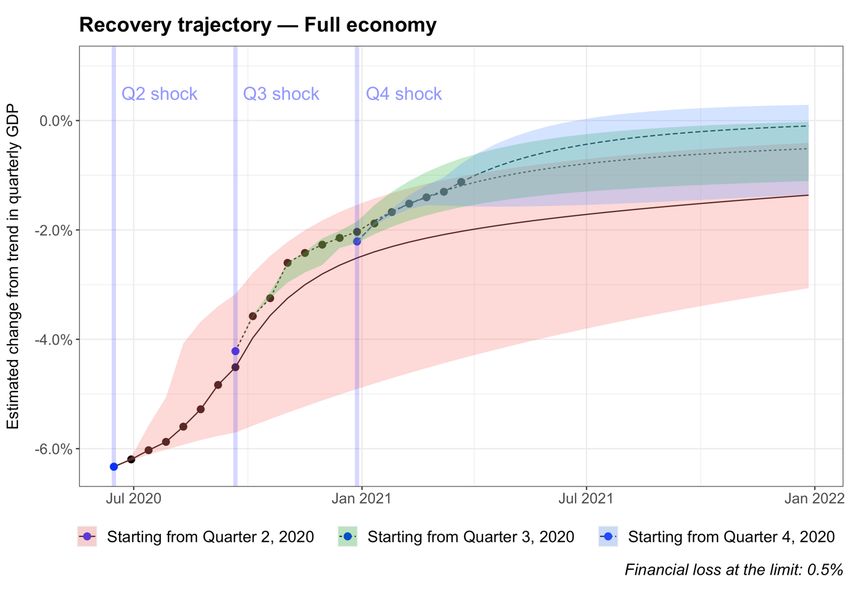
Figure 5: Financial gains or losses vs. output shocks in quarters 2 and 3, 2020

Source: authors’ construction based on data from Refinitiv Eikon and GSO.

5 Results

5.1 Economy-wide results

As discussed above, our decision to apply the method to Viet Nam was motivated both by its
nature as a small exporting economy and by the availability of quarterly GDP data at the industry
level. The detailed and timely GDP data allowed us to test the validity of our method by comparing
our predictions for the third and fourth quarters of 2020 with actual data for those periods. We
could also acquire new predictions nearly in real time based on biweekly financial data, and evaluate
the accuracy of past predictions when new quarterly GDP data were published.

Figure 6 shows the estimated recovery path for the Vietnamese economy under three sets of data.
The first plotted line, starting in July 2020, depicts the change in quarterly GDP from trend based
on the shock estimated for Q2/2020 (-6.3 per cent; from GSO’s GDP data, blue point) and
financial data up to the end of the third quarter. The second line, starting in October 2020,
illustrates the change from trend output based on the shock estimated for Q3/2020 (-4.2 per cent;
again from GSO’s GDP data) and financial data up to late December. Finally, the third line shows
the corresponding recovery trajectory that starts from the shock estimated for Q4/2020 (-2.2 per
cent) and uses financial data up to 18 March 2021.

Error bars show the 95 per cent confidence intervals around each plotted line, estimated using
biweekly standard deviations of sectoral stock prices and a simple Gaussian random walk (see
Section 3 for details).

 13
Figure 6: Estimated recovery paths for Viet Nam

Note: chart shows deviations from trend in quarterly GDP, under three sets of data: (1) shock estimated for
Q2/2020 (blue point) and financial data up to the end of the third quarter; the red-shaded area measures
statistical uncertainty due to financial data volatility; (2) shock estimated for Q3/2020 (blue point) and financial
data up to the end of the fourth quarter, with green-shaded uncertainty; (3) shock estimated for Q4/2020 (blue
point) and financial data up to 18 March 2021, with blue-shaded uncertainty. The shaded areas show the 95 per
cent confidence intervals, estimated using a Gaussian random walk. The financial loss threshold used is 0.5 per
cent.
Source: authors’ construction.

Using GDP data from Q2 and financial data up to the end of Q3, our predicted recovery path
closely aligns with the recovery path predicted from actual data. Our predictions for GDP shocks
in Q3 and Q4, -4.5 per cent [95 per cent CI: -3.2 per cent to -5.7 per cent] and -2.5 per cent [-1.5
per cent to -4.9 per cent] respectively (in the red-shaded area of the figure), are well aligned with
the recent estimates derived from GSO data, -4.2 per cent and -2.2 per cent, respectively.

The recovery path we predict for Q4/2020 using GDP data from Q3 and financial data up to the
end of Q4, -2.0 per cent [-1.8 per cent to -2.2 per cent] (in the green-shaded area in the figure) also
aligns with the GSO data (-2.2 per cent) and is within the uncertainty bounds using the older set
of information.

The quarterly shock for Q2/2020 and financial information up to Q3/2020 imply a yearly
contraction of -4.1 per cent [-3.5 per cent to -5.2 per cent] from trend. The updated quarterly
shock for Q3/2020 and financial data up to Q4/2020 imply a shock of -3.9 per cent [-3.8 per cent
to -4.0 per cent]. Our estimated annual shocks match recent GDP figures published by the General
Statistical Office of Viet Nam in early 2021, which show that the actual 2020 GDP shock with
respect to trend was -4.0 per cent.

 14
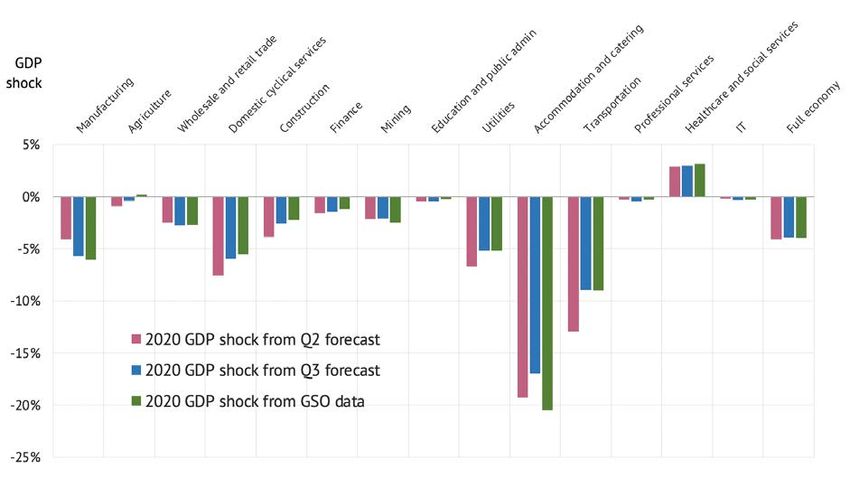
5.2 Sensitivity analysis

As mentioned in Section 3, the approach, relying on the negative exponential function, requires
that for each biweekly update, output and financial changes from baseline are either both negative
(− < 0 and < 0) or both positive (− > 0 and > 0). With full financial sector recovery,
the condition is not fulfilled. In these cases, we need to impose a restriction to financial losses at
the limit.

Our preferred threshold value, 0, = −0.5 , is large enough to circumvent
unrealistically rapid output recoveries in a single two-week period, but small enough to allow
financial price variations near the baseline to influence the output trajectory. Table 3 reports our
estimates for trend reductions from quarterly and annual GDP compared with the data, under
different assumptions on the financial loss threshold. The second column contains the results for
our preferred value for the financial loss threshold of -0.5 per cent. The sensitivity to the different
values tested is small.
Table 3: Model predictions vs. data, with varying values for financial loss threshold

 Estimates with varying financial loss thresholds
Model prediction or data (1) (2) (3)
Financial loss threshold -1.0% -0.5% -0.1%

Annual GDP shock (Model based on Q2 data) 4.3% 4.1% 3.9%
 [3.7%–5.2%] [3.5%–5.2%] [3.1%–5.2%]
Annual GDP shock (Model based on Q3 data) 4.0% 3.9% 3.7%
 [4.0%–4.1%] [3.8%–4.0%] [3.5%–3.7%]
Annual GDP shock (Actual data) 4.0% 4.0% 4.0%

Quarterly GDP shock in Q3 (Model based on Q2 data) 4.7% 4.5% 3.8%
 [3.8%–5.7%] [3.2%–5.7%] [2.2%–5.7%]
Quarterly GDP shock in Q3 (Actual data) 4.2% 4.2% 4.2%

Quarterly GDP shock in Q4 (Model based on Q2 data) 2.8% 2.5% 2.4%
 [1.9%–4.9%] [1.5%–4.9%] [1.2%–4.9%]
Quarterly GDP shock in Q4 (Model based on Q3 data) 2.4% 2.0% 1.4%
 [2.4%–2.6%] [1.8%–2.2%] [0.9%–1.5%]
Quarterly GDP shock in Q4 (Actual data) 2.2% 2.2% 2.2%

Note: shocks present reductions in GDP from trend. 95% confidence intervals in brackets.
Source: authors’ construction.

5.3 Selected industry-level results

In this section, we compare industry-level recovery trajectories and particularly the shocks
predicted by the model with shocks derived from GSO’s GDP data. These comparisons are shown
in Figures 7–9. As can be seen in the figures, sectoral predictions are relatively accurate, although
understandably less so than the aggregated full economy predictions discussed in the previous
section. Notably, the graphs illustrate how predictions tend to improve with newer data.

 15
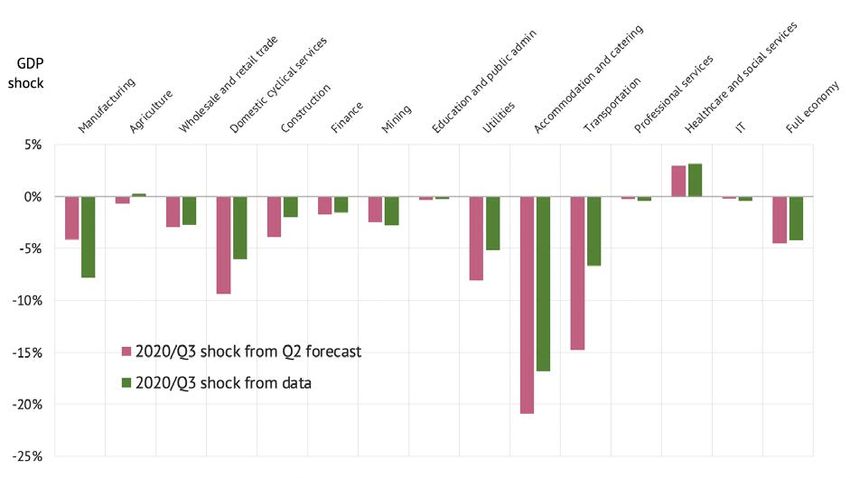
Figure 7: 2020 GDP shocks, early model predictions vs. GSO data from 2021

Note: all results use a financial loss threshold of -0.5%.
Source: authors’ construction.

Figure 8: 2020 Quarter 3 GDP shocks, early model predictions vs. GSO data

Note: all results use financial loss threshold of -0.5%.
Source: authors’ construction.

 16
Figure 9: 2020 Quarter 4 GDP shocks, early model predictions vs. GSO data

Note: all results use financial loss threshold of -0.5%.
Source: authors’ construction.

6 Conclusions

In this paper we have described a new methodology to nowcast the economic effects of the
COVID-19 crisis, also applicable to any comparable shocks of global nature. The method can also
be used to predict recovery trajectories for economic activity in small, export-oriented countries,
both across industries and for entire economies.

The technique relies on two sets of readily available data: observed industry-level shocks, which
are typically available only with a delay, and real-time (or near real-time) variation in sectoral
financial indexes. The financial indexes are used to update industry-level shocks in economic
output and extend them into the future.

The application to Viet Nam presented in this paper shows that the method can match, if not
outperform, more traditional techniques used by government agencies and international
organizations; our nowcasted recovery trajectories for Viet Nam from fall 2020 are more in line
with newest data than those made by reputable organizations such as the IMF.

Viet Nam is the only country in the Association of Southeast Asian Nations (ASEAN) and one of
few countries in the world that achieved positive nominal GDP growth in 2020 according to recent
estimates. Our claim is that its exceptional performance was visible in stock market data early on
but was largely missed by conventional forecasters.

At the same time, we acknowledge that this exercise offers only partial validation for our method.
More generally, our predictions are based on elicited expectations, which can be (and generally are)
different from ex-post realizations. Full validation of the method requires testing it in multiple
settings and over multiple timeframes—something that we have to leave for future research.

 17
References

Andreou, E., E. Ghysels, and A. Kourtellos (2013). ‘Should Macroeconomic Forecasters Use Daily
 Financial Data and How?’. Journal of Business & Economic Statistics, 31(2): 240–51. https://doi.org/
 10.1080/07350015.2013.767199
Asian Development Bank (2020). ‘Economic Indicators for Viet Nam’. Available at:
 https://www.adb.org/countries/viet-nam/economy (accessed 12 March 2021).
Asian Development Bank (2018). ‘Viet Nam: Input–Output Economic Indicators (2017 table)’. Available
 at: https://data.adb.org/dataset/viet-nam-input-output-economic-indicators (accessed 15 December
 2021).
Atradius (2020). ‘Country Report Vietnam 2020’. Available at: https://group.atradius.com/publications/
 country-report-asia-vietnam-2020.html (accessed 12 March 2021).
Banbura, M., D. Giannone, M. Modugno, and L. Reichlin (2013). ‘Nowcasting and the Real-Time
 Dataflow’. In G. Elliott and A. Timmerman (eds), Handbook of Economic Forecasting. Amsterdam:
 Elsevier. https://doi.org/10.1016/B978-0-444-53683-9.00004-9
Boughton, J.M. (1997). ‘Modeling the World Economic Outlook at the IMF: a Historical Review’. IMF
 Working Paper WP/97/48. Washington, DC: International Monetary Fund. https://doi.org/
 10.5089/9781451846706.001
Boughton, J.M. (2001). The Silent Revolution. The International Monetary Fund 1979–1989. Washington, DC:
 International Monetary Fund.
Cristelli, M., A. Tacchella, M. Cader, K. Roster, and L. Pietronero (2017). ‘On the Predictability of Growth’.
 World Bank Policy Research Working Paper 8117. Washington, DC: The World Bank.
 https://doi.org/10.1596/1813-9450-8117
IMF (2020). World Economic Outlook, October 2020. Washington, DC: International Monetary Fund.
Knotek, E.S., and S. Zaman (2019). ‘Financial Nowcasts and their Usefulness in Macroeconomic
 Forecasting’. International Journal of Forecasting, 35(4): 1708–24. https://doi.org/10.1016/
 j.ijforecast.2018.10.012
Nikkei Asia (2020). ‘Vietnam to Halve 2020 GDP Growth Target Due to Pandemic’. Available at:
 https://asia.nikkei.com/Economy/Vietnam-to-halve-2020-GDP-growth-target-due-to-pandemic
 (accessed 12 March 2021).
Stock, J.H., and M.W. Watson (2016). ‘Dynamic Factor Models, Factor-Augmented Vector
 Autoregressions, and Structural Vector Autoregressions in Macroeconomics’ in J.B. Taylor and H.
 Uhligin (eds), Handbook of Macroeconomics, Vol. 2. Amsterdam: Elsevier, pp. 415–525. https://doi.org/
 10.1016/bs.hesmac.2016.04.002
World Bank (2020). ‘Understanding the Depth of the 2020 Global Recession in 5 Charts’. Available at:
 https://blogs.worldbank.org/opendata/understanding-depth-2020-global-recession-5-
 charts#:~:text=The%20COVID%2D19%20recession%20will,2007%2D09%20global%20financial
 %20crisis (accessed 5 February 2021).

 18
Appendix

Figure A1 shows the prices of sectoral stock indexes from 2015 until the end of 2019, used for de-
trending counterfactual price trends in 2020.
Figure A1: Prices of sectoral stock indexes from 2015 to the end of 2020

Source: authors’ construction.

 19
You can also read