Severe Drought in the Spring of 2020 in Poland-More of the Same? - MDPI

Page created by Melissa Fields
 
CONTINUE READING
Severe Drought in the Spring of 2020 in Poland-More of the Same? - MDPI
agronomy
Article
Severe Drought in the Spring of 2020 in
Poland—More of the Same?
Iwona Pińskwar * , Adam Choryński              and Zbigniew W. Kundzewicz
 Institute for Agricultural and Forest Environment, Polish Academy of Sciences, Bukowska 19,
 60-809 Poznań, Poland; adam.chorynski@isrl.poznan.pl (A.C.); kundzewicz@yahoo.com (Z.W.K.)
 * Correspondence: iwona.pinskwar@isrl.poznan.pl
                                                                                                  
 Received: 5 October 2020; Accepted: 23 October 2020; Published: 26 October 2020                  

 Abstract: Two consecutive dry years, 2018 and 2019, a warm winter in 2019/20, and a very dry spring
 in 2020 led to the development of severe drought in Poland. In this paper, changes in the Standardized
 Precipitation-Evapotranspiration Index (SPEI) for the interval from 1971 to the end of May 2020 are
 examined. The values of SPEI (based on 12, 24 and 30 month windows, i.e., SPEI 12, SPEI 24 and
 SPEI 30) were calculated with the help of the Penman–Monteith equation. Changes in soil moisture
 contents were also examined from January 2000 to May 2020, based on data from the NASA Goddard
 Earth Sciences Data and Information Services Center, presenting increasing water shortages in a
 central belt of Poland. The study showed that the 2020 spring drought was among the most severe
 events in the analyzed period and presented decreasing trends of SPEI at most stations located in
 central Poland. This study also determined changes in soil moisture contents from January 2000 to
 May 2020 that indicate a decreasing tendency. Cumulative water shortages from year to year led to
 the development of severe drought in the spring of 2020, as reflected in very low SPEI values and low
 soil moisture.

 Keywords: standardized precipitation-evapotranspiration index; soil moisture; Poland

1. Introduction
      Droughts, in addition to floods, are extreme weather events of utmost importance in the world.
Scarcity of precipitation, exacerbated by high air temperature, may lead to the development of different
stages of droughts: from meteorological, through soil to hydrological droughts [1]. As droughts
develop, their effects on agriculture, water supply, energy and the environment grow. Since the year
2000, Europe has faced multiple severe droughts, accompanied by heat waves, such as in 2003, 2006,
2010, 2015, 2018, 2019 and 2020 [2,3], as well as extensive forest fires [4].
      Droughts heavily impact many sectors of the national economy and agriculture in particular [5].
Analyses show that yield losses in Poland may even reach 50% on light soils [6]. A drought that took
place in 2015 in Poland caused 12% yield loss of cereals, 20% of vegetables, 25% of potatoes and 50–70%
of silage maize [5]. However, in other countries, the agricultural sector has suffered even more than
in Poland. For example, crop damage extent in two dry periods (2004–2005 and 2011–2012) reached
70–95% in southwestern Spain [7]. In the summer of 2018, an extreme drought occurred in central
and northern Europe [8]. Economic costs of agricultural crop losses caused by this event, which can
be estimated based on values of compensations to farmers, reached €340 million in Germany and
€116 million in Sweden [9].
      Looking at the impacts of droughts, researchers also investigate the more general problem of
their influence on the economy. Analyses combining the future impact of droughts with projected
temperature increase assess that in over 75 countries, the gross domestic product will be adversely
affected by a 1.5 ◦ C temperature rise scenario [10]. The same authors claim that in this scenario,

Agronomy 2020, 10, 1646; doi:10.3390/agronomy10111646                        www.mdpi.com/journal/agronomy
Severe Drought in the Spring of 2020 in Poland-More of the Same? - MDPI
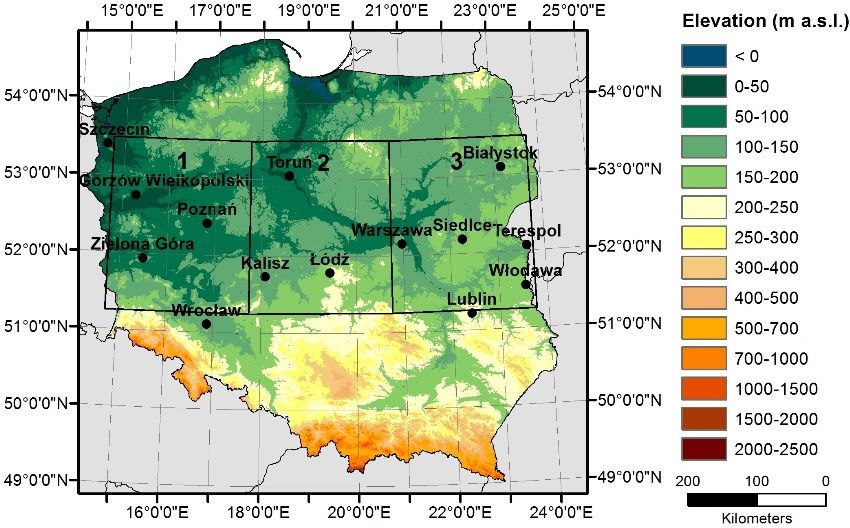
Agronomy 2020, 10, 1646                                                                            2 of 20

historical 50 year drought frequency will double across 58% of global land areas. Moreover, at a 2 ◦ C
temperature rise scenario, 92 countries will face dramatic droughts, significantly impacting their
economy, and 67% of land areas may be impacted by catastrophic droughts. One should bear in mind
that droughts influence countries with a lower economic resilience more, and countries’ resilience is
correlated with their wealth. Therefore, poorer countries and their populations are more vulnerable to
droughts. It is also important to note that drought events and their consequences are more probable to
affect populations in the tropical and mid-latitude regions [10].
     The unusual 2003 drought, which had severe impacts in much of Europe, has been seen by
researchers as the “shape of things to come”, because such extreme temperatures as observed during
that summer are projected to occur much more frequently at the end of the 21st century [11].
     The drought and heat waves in 2010 were exceptionally severe in eastern Europe and large
parts of Russia. According to Barriopedro et al. [12], the amplitude and spatial extent of this
anomalous hot spell exceeded the amplitude and spatial extent of the previous hottest summer of 2003.
These two “mega-heatwaves” in 2003 and 2010 probably broke the 500 year temperature records over
approximately 50% of Europe [12].
     The next combination of drought and heat waves recorded in Europe, particularly in the central
and eastern part of the continent, in 2015, was the third (after 2003 and 2010) warmest summer
in Europe since 1910 [2]. During this drought, extreme low flows were recorded in several rivers,
especially in the central and eastern parts of Europe [13]. In Poland, too, the extremely hot and dry
summer of 2015 led to the lowest values of the stages (and discharges) on record, for example in the
Vistula River where the stage was the lowest since the 18th century, when records began [14].
     The 2015 drought was extreme, but not singular. In the spring of 2018, a longer drought
commenced, covering two years, 2018 and 2019. Hari et al. [3] showed that the occurrence of this
drought was unprecedented in the last 250 years, and its impact on vegetation was more severe than
that of the 2003 European drought.
     The water resources in Poland should recover during winter, when evapotranspiration is smaller
and, typically, snow cover exists. However, over several years now, winters in Poland have been
frequently warmer than the long-term average [15]. Additionally, in recent years snow cover has
been less abundant to non-existent in much of Poland. According to Copernicus Climate Change
Service/ECMWF (European Centre for Medium-Range Weather Forecasts), the winter of 2019–2020
was the warmest winter season ever recorded in Europe [16].
     Out of the last five years, three have been dry (2015, 2018, 2019), with annual precipitation totals
in Poznań being, respectively: 437.7 mm, 372.5 mm and 392.8 mm. These values are well below the
long-term average for the period 1951–2019, which is 521.6 mm. The cumulative two-year rainfall
deficit (the sum of the annual shortages in relation to the average) in 2018 and 2019 was equal to
277.9 mm. However, the low rainfall in 2018–2019 was not something exceptional, because in 1982
only 275 mm were recorded in Poznań, and in the next, only slightly less dry year 1983, the rainfall
was 333.5 mm. Thus, the two-year rainfall deficit reached a record value of 412.7 mm in 1982–1983
(data from IMGW-PIB).
     In Poland, after the severe 2018–2019 drought, the precipitation total during the autumn of 2019
and the winter of 2019–2020 was also near normal of the long-term mean (e.g., for the period 1981–2010).
This did not improve the hydrological situation [15]. By contrast, precipitation in February 2020 was
extremely high in Poland. For many stations, monthly precipitation anomalies, related to the mean for
1981–2010, were above 200%; and nearly 280% (76.3 mm—an all-time record for February) in Poznań.
However, it was rainfall rather than snowfall. Much of this rain was intense, so that surface runoff was
high. Additionally, February 2020 was extremely warm [17] and evapotranspiration was high as well.
In turn, spring 2020 was very dry. In consequence, after the very dry years of 2018–2019, rather dry
cold months (except for February 2020) and the very dry spring of 2020 (especially April), extreme
drought developed. Figure 1 shows water scarcity on May 21, 2020, with a depth from 7 to 28 cm.
Severe Drought in the Spring of 2020 in Poland-More of the Same? - MDPI
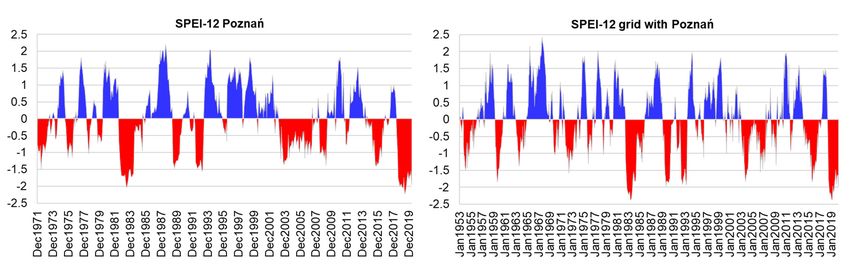
Agronomy 2020, 10, 1646                                                                                                                         3 of 20
Agronomy 2020, 10, x FOR PEER REVIEW                                                                                                            3 of 20

        Figure 1.
       Figure  1. Spatial
                  Spatial distribution
                          distribution of
                                        of soil
                                           soil moisture
                                                moisture (expressed
                                                         (expressed as
                                                                     as aa percentage)
                                                                           percentage) in
                                                                                        in Poland,
                                                                                           Poland, in
                                                                                                    in the
                                                                                                       the subsurface
                                                                                                           subsurface
        (depth  from  7 to 28  cm)  on  21  May   2020, created by  EUMETSAT       H-SAF,    based   on
       (depth from 7 to 28 cm) on 21 May 2020, created by EUMETSAT H-SAF, based on satellite data (ASCAT satellite data
        (ASCAT    sensor, Metop   satellites), using the ECMWF    H-TESSEL      model,  with  a spatial
       sensor, Metop satellites), using the ECMWF H-TESSEL model, with a spatial resolution of 25 km.    resolution  of
        25 km. Source:  http://stopsuszy.imgw.pl/wilgotnosc/.
       Source: http://stopsuszy.imgw.pl/wilgotnosc/.

       In the
       In  thespring
                  springofof        2020,
                                2020,         in consequence
                                        in consequence         of theofsevere
                                                                          the severe       and long-lasting
                                                                                  and long-lasting          drought,   drought,
                                                                                                                         a large (5280a large      (5280
                                                                                                                                             hectares)
 hectares)took
wildfire       wildfire
                    place took
                             in theplace
                                       Biebrza in the   Biebrza
                                                    National        National
                                                                 Park.   Nearly  Park.
                                                                                    10%Nearly         10% ofarea
                                                                                            of the whole         the ofwhole     areaburned
                                                                                                                          the park        of the park
                                                                                                                                                    [18].
 burned     [18].   Apart      from     large    losses   in  plants    and    animals,      the  firefighting
Apart from large losses in plants and animals, the firefighting operation incurred high costs. They                  operation       incurred       high
 costs.estimated
were     They were      byestimated
                             the Ministry    by the   Ministry of Environment
                                                  of Environment          at the level ofat8 the      levelPLN
                                                                                                  million      of 8 (almost
                                                                                                                      million PLN€2 million)
                                                                                                                                           (almost     €2
                                                                                                                                                    [19].
 million)
About     1.5[19].   About firefighters
               thousand          1.5 thousand        firefighters
                                                   were   engaged,were         engaged,
                                                                         as well    as more   as than
                                                                                                  well as300more
                                                                                                               otherthan      300 other
                                                                                                                        rescuers              rescuers
                                                                                                                                      and soldiers.
 and soldiers.
Moreover,       six Moreover,
                     airplanes and     six airplanes       and two
                                             two helicopters           helicopters
                                                                    supported       thesupported
                                                                                          action.         the action.
       Regional multi-model
       Regional       multi-model experiments
                                            experiments showedshowed that  that the
                                                                                 the frequency
                                                                                       frequency of    of occurrence
                                                                                                           occurrence of    of mega-heatwaves
                                                                                                                                mega-heatwaves
 during    summers          may      increase      by  a  factor    of  5  to  10   within
during summers may increase by a factor of 5 to 10 within the next 40 years [12]. The          the  next     40  years     [12].   The higher
                                                                                                                                           higher thethe
 atmosphericconcentration
atmospheric         concentrationofofgreenhouse greenhousegases,  gases,the thegreater
                                                                                 greater     will
                                                                                          will  thetherolerole
                                                                                                             of of   anthropogenic
                                                                                                                 anthropogenic               warming
                                                                                                                                        warming        in
 in exacerbating
exacerbating        thethe     future
                          future      riskriskof of multi-year
                                                 multi-year         drought
                                                                  drought        eventsbe.
                                                                               events       be.Climate
                                                                                                Climatemodel  modelsimulations
                                                                                                                        simulationsunder    under thethe
 highestRepresentative
highest       Representative            Concentration
                                    Concentration               Pathway
                                                          Pathway      (RCP8.5)(RCP8.5)
                                                                                     predictpredict
                                                                                                a seven-folda seven-fold
                                                                                                                   increase inincrease           in the
                                                                                                                                    the occurrence
 occurrence
of               of the droughts
   the consecutive          consecutive          droughts
                                             during            during
                                                      the second          theofsecond
                                                                       half      the 21sthalf     of the[3].
                                                                                              century        21st   century
                                                                                                                If the   rate of[3].   If the rate of
                                                                                                                                    anthropogenic
 anthropogenic
warming                warming
              slows down,          the slows
                                         risk of down,       the risk of
                                                   future droughts        willfuture     droughts
                                                                                 be reduced       [3]. will    be reduced
                                                                                                        In addition,             [3]. In et
                                                                                                                          Samaniego          addition,
                                                                                                                                                al. [20]
 Samaniego
pointed     outet     al. a[20]
                   that           pointed
                              global     warmingout thatof 3a Kglobal    warming
                                                                  will lead              of 3 K will
                                                                                to increase              lead to increase
                                                                                                  in droughts:         an event   in like
                                                                                                                                       droughts:
                                                                                                                                             the 2003  an
 event like
drought      is the  2003 drought
                projected       to become    is projected     to become
                                                  twice as frequent        in twice
                                                                               Europe. as frequent in Europe.
       In Poland,
       In  Poland,where  whererain-fed
                                     rain-fed      agriculture
                                                agriculture     hashas
                                                                     been been    prevailing,
                                                                             prevailing,            soil moisture
                                                                                              soil moisture       deficitsdeficits
                                                                                                                             are theare  mainthefactor
                                                                                                                                                   main
 factor adversely
adversely      affecting  affecting       the agricultural
                              the agricultural                    productivity.
                                                      productivity.        Droughts   Droughts
                                                                                          as severe  asassevere
                                                                                                             thoseas    those
                                                                                                                      that       that occurred
                                                                                                                            occurred        in Poland  in
 Poland
in 2015, in20182015,and 2018
                           2019  andare2019     are projected
                                          projected     to be more to befrequent
                                                                           more frequent         in the and
                                                                                      in the future        future    and tolarger
                                                                                                                to affect      affectareas
                                                                                                                                         larger[21].
                                                                                                                                                   areas
 [21]. Due to low mean annual precipitation (a national average of 624 mm) [22] and low water resources
(a meanDueofto      low 60
                about       mean
                               billion     m3 , and
                                       annual      precipitation
                                                       in dry years(amuch   national
                                                                                   less:average
                                                                                           below 40ofbillion624 mm) m3 ), [22]
                                                                                                                           the perandcapitalow water
                                                                                                                                                  water
 resources (ainmean
availability          Poland  of about        60 billion
                                   is far below       the m    3, and in dry years much less: below 40 billion m3), the per
                                                            European        average. It is only possible to store approximately
 capitaofwater
6.5%       annual    availability
                        river flowininPoland   reservoirsis far
                                                              in below
                                                                  Polandthe       European
                                                                              [23],  hence there  average.
                                                                                                        would   It be
                                                                                                                    is only
                                                                                                                        no waterpossible       to store
                                                                                                                                        for massive
 approximately
agricultural           6.5% ofinannual
                  irrigation                     river flow
                                      the country,       which  inmay
                                                                    reservoirs
                                                                          be neededin Poland
                                                                                          in the [23],
                                                                                                   warming henceclimate.
                                                                                                                    there wouldWaterbe       no water
                                                                                                                                          stress   is on
 for massive       agricultural         irrigation      in  the   country,      which
the rise in Poland; hence drought analysis is of much relevance and interest the nation.   may    be   needed       in  the   warming         climate.
 Water    stress is with
       Problems        on thewater rise in     Poland;inhence
                                            scarcity        Poland drought      analysis
                                                                       (resulting       fromis low
                                                                                                of much       relevanceand
                                                                                                       precipitation          andavailability
                                                                                                                                     interest in the   of
 nation.
renewable        water resources, in particular per capita) are serious in the whole country, but they are
most Problems
        severe forwith   lowland waterareas scarcity    in Poland
                                                  in central     Poland.(resulting      from lowmean
                                                                               The long-term            precipitation        and availability
                                                                                                                annual precipitation                   of
                                                                                                                                                  totals
 renewable
are  small inwater  that resources,
                            region, between   in particular
                                                       500 and   per600capita)
                                                                            mm are with  serious
                                                                                           deficitinfromthe whole
                                                                                                               the norm  country,
                                                                                                                               (e.g.,but thetheyannualare
 most severe for
precipitation           lowlandinareas
                     observed              1982inincentral
                                                      Poznan   Poland.
                                                                   was 275  Themm long-term
                                                                                        only; itmeanwas evenannual     precipitation
                                                                                                                    lower     in Kalisztotals in 2015:are
 small
259  mm)  in [24],
               that causing
                       region, between              500 andhence
                                      water problems;             600 mm  this with
                                                                                 paperdeficit
                                                                                           focuses   from     the area.
                                                                                                        on this      norm In   (e.g.,
                                                                                                                                   this the     annual
                                                                                                                                           study,    the
 precipitation observed in 1982 in Poznan was 275 mm only; it was even lower in Kalisz in 2015: 259
 mm) [24], causing water problems; hence this paper focuses on this area. In this study, the
Severe Drought in the Spring of 2020 in Poland-More of the Same? - MDPI
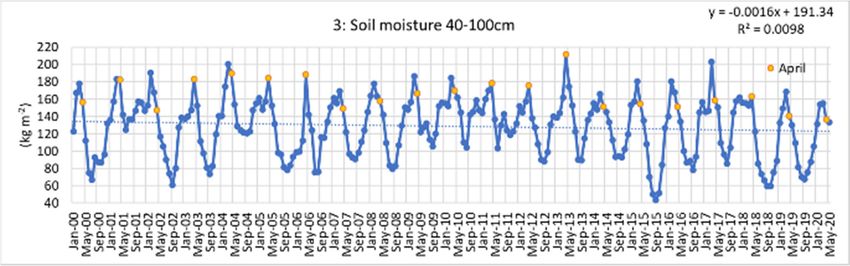
Agronomy 2020, 10, 1646                                                                             4 of 20

Standardized Precipitation-Evapotranspiration Index (SPEI) was used for station data for the period
from January 1971 to May 2020.
     The SPEI is based on the difference between precipitation and potential evapotranspiration.
These anomalies in climatic water balance are normalized, which allows to determine the onset,
duration and magnitude of drought conditions [25]. The potential evapotranspiration may be
calculated using different methods, such as the Thornthwaite equation [26], which is used to estimate
the SPEI in the global drought monitor [27], and the Penman–Monteith method, which is recommended
by the FAO (Food and Agriculture Organization of the United Nations). The new SPEI base, which
uses the FAO-56 Penman–Monteith estimation, is based on monthly precipitation and potential
evapotranspiration from the Climatic Research Unit of the University of East Anglia and is updated as
soon as new data are available, currently up to December 2018.
     In Poland, different studies analyzed the SPEI based on the Thornthwaite equation. It was
investigated based on station data by Wibig [28] and based on gridded data by Somorowska [14].
Wibig [28] analyzed drought events during the period of 1951–2006 for 18 stations on five time scales:
lasting from 1 to 24 months. She found that all trends were decreasing, but statistically insignificant.
By contrast, Somorowska [14] analyzed data from 1956 to the end of 2015, showing a statistically
significant decreasing trend in the SPEI for a relatively large area of Poland from the southwest towards
the central part of the country.
     The novelty of the current research is that the values of SPEI were calculated with the use
of the FAO-56 Penman–Monteith equation, which is considered a superior method in reference to
the Thornthwaite equation and recommended by Begueria et al. [29] as more robust for long-term
climatological analysis. In addition, the method is based on longer time scales of 12, 24 and 30 months
when presenting shortages of water. The study presented in this paper used the latest available data,
which enhances accurate detection of changes in drought events. The main aim of this study was to
find out how extreme was the spring drought of 2020, but it also checked the occurrence of the trend.
By estimating drought events over longer time scales, this research took into account a lag in drought
events, which is more visible in the long term and has a lower frequency. Short time scales are mainly
related to soil water content; medium time scales are related to reservoir storages and discharge in the
medium course of the rivers, and longer time scales are related to groundwater storage [25]. The SPEI
3 and SPEI 6, which use shorter scales, are masked by months with very high precipitation, such as
February 2020. This wet month did not improve the hydrological drought situation but led to higher
values of the SPEI. The SPEI value for the time scale of 12 months and more reflects well the occurrence
of hydrological droughts with a substantial decrease in water resources, which may develop over a
long period of time.
     In order to enhance the results received through the SPEI, this research also studied combined
satellite and observed data. The soil moisture contents were estimated based on data from the NASA
Goddard Earth Sciences Data and Information Services Center (GES DISC) for several soil depth levels
over the past 20 years: from January 2000 to May 2020.

2. Materials and Methods
      In this paper, the SPEI and the soil moisture contents, based on gridded data from NASA, were
used to illustrate scarcity of water in the landscape. The study area covers a belt of lowlands in central
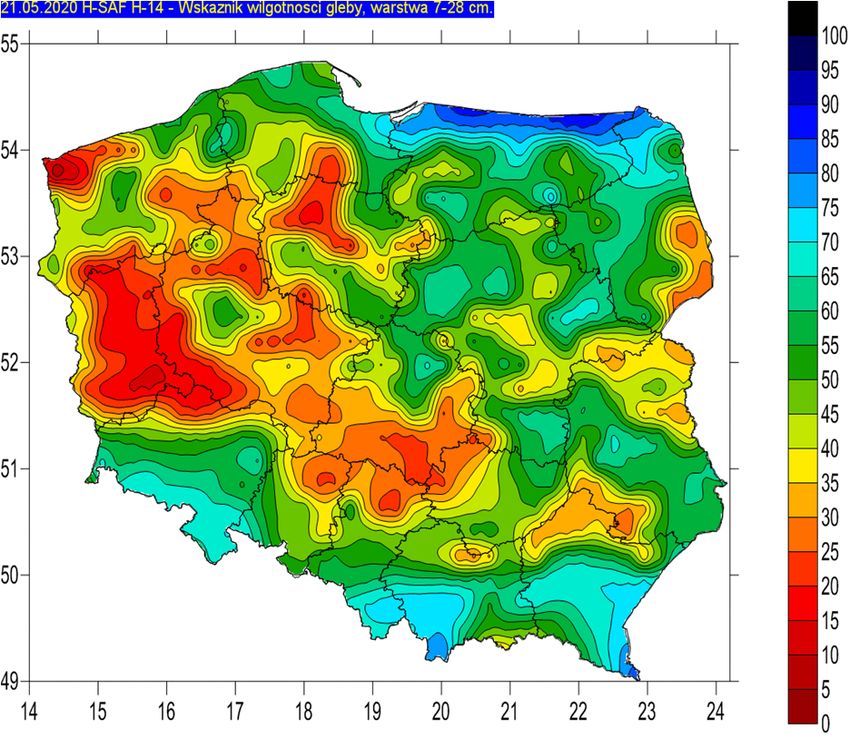
Poland with a longitude between 14.875◦ E and 23.625◦ E and latitude from 51.375◦ N to 53.375◦ N. In
this area, only 11 meteorological stations are located, so data from another three sites situated close to
the study area were added to enrich the data coverage (Figure 2).
Severe Drought in the Spring of 2020 in Poland-More of the Same? - MDPI
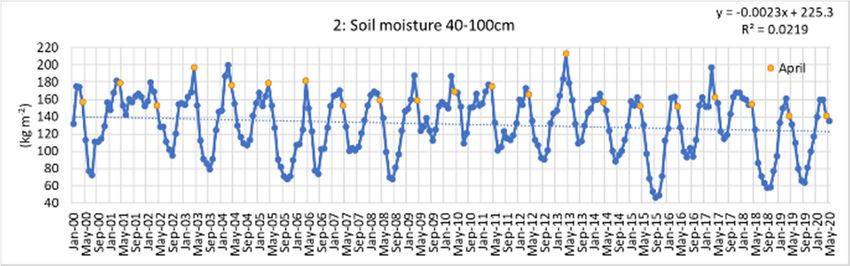
Agronomy 2020, 10, 1646                                                                                                     5 of 20

Agronomy 2020, 10, x FOR PEER REVIEW                                                                                        5 of 20

      Figure 2. The
                 The study area
                           area covering
                                 coveringthethebelt
                                                beltofoflowlands
                                                         lowlandsinincentral
                                                                       central  Poland.
                                                                             Poland.     Station
                                                                                      Station     data
                                                                                               data    were
                                                                                                     were   provided
                                                                                                          provided by
      by the Institute of Meteorology   and   Water   Management—State       Research    Institute (IMGW-PIB).
      the Institute of Meteorology and Water Management—State Research Institute (IMGW-PIB). Data from          Data
      from  the NASA
      the NASA    GoddardGoddard    Earth Sciences
                            Earth Sciences    Data andData   and Information
                                                          Information   ServicesServices   Center
                                                                                   Center (GES      (GESwere
                                                                                                  DISC)   DISC) were
                                                                                                             divided
      divided  into
      into three    three
                 equal    equal subareas
                        subareas  that werethat were numbered,
                                             numbered,     from westfrom   westasto1–3.
                                                                       to east,     east, as 1–3.

      Data for the the SPEI
                        SPEI were
                              were obtained
                                     obtained from 14 stations located in the belt     belt of
                                                                                            of lowlands
                                                                                                lowlands in  in central
                                                                                                                 central Poland
                                                                                                                           Poland
(Figure 2),
          2), covering
              coveringthe  theinterval
                                intervalfrom
                                           from19711971totothe
                                                             theendendofof
                                                                         May
                                                                           May2020. These
                                                                                 2020.     data
                                                                                       These  datasetssets
                                                                                                        were   provided
                                                                                                            were    providedby the
                                                                                                                                 by
Institute
the         of Meteorology
      Institute                  and Water
                     of Meteorology        andManagement—State
                                                  Water Management—State    Research Institute
                                                                                       Research(IMGW-PIB).           Calculation
                                                                                                     Institute (IMGW-PIB).
of the SPEI of
Calculation       wasthedone
                         SPEI inwastwo   steps.
                                      done   in two First,  daily
                                                       steps.       reference
                                                                First,          crop evapotranspiration
                                                                       daily reference  crop evapotranspiration  (ET0 ) in(ETthe   R
                                                                                                                               0) in

Evapotranspiration          package     was    estimated      [30,31],  based   on sub-daily
the R Evapotranspiration package was estimated [30,31], based on sub-daily and daily data. The  and    daily   data.    The   data
include: minimum
            minimum and    and maximum
                                 maximum temperature
                                                temperature (in       ◦ C), minimum and maximum relative humidity
                                                                  (in °C),
include:                                                                    minimum and maximum relative humidity
                                (available for
(in %), insolation hours (available           for eight
                                                   eight stations:
                                                          stations: Białystok,
                                                                       Białystok,Gorzów
                                                                                  GorzówWielkopolski,
                                                                                            Wielkopolski, Kalisz,
                                                                                                                Kalisz,Poznań,
                                                                                                                          Poznań,
Szczecin, Terespol,
              Terespol,Włodawa
                            Włodawaand    andZielona
                                                 ZielonaGóra)    or cloudiness
                                                             Góra)               (available
                                                                      or cloudiness         for thefor
                                                                                       (available      remaining     six stations:
                                                                                                           the remaining         six
Lublin, Łódź,
stations:   Lublin, Siedlce,
                       Łódź,Toru    ń, Warszawa
                               Siedlce,                and Wrocław),
                                          Toruń, Warszawa                  average wind
                                                                    and Wrocław),         speed
                                                                                     average       (in m
                                                                                                wind        s−1 ) and
                                                                                                         speed    (in mconstants
                                                                                                                          s−1) and
required for
constants        calculation
             required           of the Penman–Monteith
                          for calculation                         FAO-56 formulation,
                                             of the Penman–Monteith                       including elevation
                                                                               FAO-56 formulation,        including  (inelevation
                                                                                                                          m a.s.l.),
latitude
(in        in radians
    m a.s.l.),   latitudeand   other constants.
                            in radians    and other constants.
      In the second step, the monthly values of ET00 and             and precipitation
                                                                          precipitation were
                                                                                         were calculated.
                                                                                                calculated. Based
                                                                                                                Based on on them,
                                                                                                                             them,
time series of the  the climatic
                        climatic water
                                   water balance
                                           balance and and then
                                                             then the
                                                                    the SPEI
                                                                         SPEI were
                                                                              were obtained
                                                                                    obtained in in the      SPEIpackage
                                                                                                    theRR SPEI      package[25].
                                                                                                                               [25].
The monthly data were then split into twelve series (one for each month) and independent PDFs
(probability density
(probability      density functions)
                             functions) werewere fitted
                                                    fitted to each series (log-logistic distribution
                                                                                              distribution was   was used
                                                                                                                       used and
parameter fitting
               fitting was
                        wasbased
                              basedon  onunbiased
                                           unbiasedprobability
                                                         probability   weighted
                                                                         weighted moments).
                                                                                    moments). The TheSPEI
                                                                                                        SPEIwas wascomputed
                                                                                                                      computed   for
three
for    time
    three      scales:
            time         12,12,
                    scales:   2424
                                 andand 3636
                                           months.
                                              months.AAperiodperiodwhenwhenthe
                                                                             theSPEI
                                                                                  SPEIvalue
                                                                                        value continuously
                                                                                               continuously stayed below    below
the threshold
the  threshold of −0.5 −0.5 was
                              was defined
                                    defined as as aa duration
                                                     duration of  of drought
                                                                      drought event,
                                                                                event, and
                                                                                       and its
                                                                                            its severity
                                                                                                 severity waswas defined
                                                                                                                    defined as as a
cumulative deficit below the threshold of −0.5                 [10].
                                                        −0.5 [10].
      Classification of severity of drought events, using SPEI values, follows Somorowska         Somorowska [14]:   [14]:
•     Moderate drought: −1.0    SPEI>>−1.5;
                         −1.0≥≥SPEI      −1.5;
•
•     Severe drought: −1.5 ≥ SPEI > −2.0;
      Severe drought: −1.5 ≥ SPEI > −2.0;
•
•     Extreme
      Extreme drought:
              drought: −2.0
                        −2.0≥≥SPEI.
                               SPEI.
    Drought periods with SPEI values continuously staying below −0.5 and lasting for at least five
     Drought periods with SPEI values continuously staying below −0.5 and lasting for at least five
consecutive months, with a minimum value below −1.5, were identified in this study as severe
consecutive months, with a minimum value below −1.5, were identified in this study as severe droughts.
droughts.
     Additionally, the values of SPEI were examined for monthly series from January to May. It was
    Additionally, the values of SPEI were examined for monthly series from January to May. It was
checked if the values for these months of 2020 were below −2.0 (extreme drought) and if the value
checked if the values for these months of 2020 were below −2.0 (extreme drought) and if the value for
a particular month was the minimum in the whole data series. This aimed at examination of the
severity of the 2020 spring drought in relation to other drought events.
Severe Drought in the Spring of 2020 in Poland-More of the Same? - MDPI
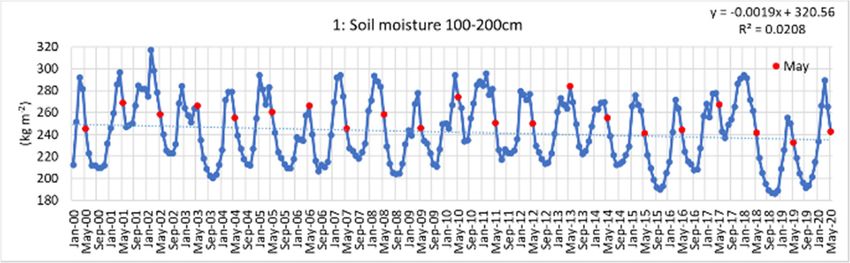
Agronomy 2020, 10, 1646                                                                                                         6 of 20

for a particular month was the minimum in the whole data series. This aimed at examination of the
severity
  Agronomyof   the10,
            2020,   2020
                       x FORspring
                               PEER drought
                                     REVIEW in relation to other drought events.                                                  6 of 20
      Trend detection in series of ET0 and the precipitation total for three stations (Poznań, Kalisz and
       Trendand
Warszawa)        detection
                     SPEI data in series   of ET0 and
                                   was carried             the precipitation
                                                    out with     the use of thetotal     for three stations
                                                                                    non-parametric             (Poznań, Kalisz
                                                                                                         Mann–Kendall               and
                                                                                                                          test in the
RWarszawa)
   Trend package  and[32],
                        SPEIfor data
                                  two was    carried out
                                        statistically        with the use
                                                          significance         of the
                                                                           levels:   0.05non-parametric
                                                                                           and 0.1.          Mann–Kendall test in
  the R
      TheTrend
            soil package
                   moisture[32],    for two
                               contents    were statistically
                                                   estimated significance
                                                                  based on griddedlevels:data
                                                                                            0.05from
                                                                                                 and 0.1.
                                                                                                       the NASA Goddard Earth
       TheData
Sciences      soil and
                    moisture      contents
                          Information           were estimated
                                           Services    Center [33].based        on gridded(Global
                                                                          The GLDAS-2.1         data from Landthe  NASA
                                                                                                                Data         Goddard
                                                                                                                      Assimilation
  Earth   Sciences      Data    and   Information         Services     Center    [33].   The
System) project uses a combination of the Noah land surface model and observation data made up GLDAS-2.1       (Global   Land      Data
                                                                                                                                     of
  Assimilation
satellite           System) project
           and ground-based         datauses      a combination
                                            and covering                of the
                                                               the period        Noah
                                                                              from        land 2000
                                                                                      January   surface    model
                                                                                                       to May      andInobservation
                                                                                                                2020.    this study,
  data made
monthly     data upwith
                     of satellite
                           a spatialand    ground-based
                                      resolution     of 0.25 data
                                                                degreesandwere
                                                                             covering
                                                                                   used.the   periodfrom
                                                                                            Outputs     fromGLDAS-2.1
                                                                                                              January 2000      to May
                                                                                                                           include    a
  2020.  In this   study,    monthly     data    with   a  spatial   resolution     of  0.25  degrees
wide variety of data, including the mean air temperature, precipitation total and soil moisture products were  used.  Outputs     from
inGLDAS-2.1
    four layers:include
                    0–10 cm,  a wide
                                 10–40variety
                                         cm, 40–100of data,    including
                                                          cm and      100–200 thecm.
                                                                                   mean air temperature, precipitation total
  andThe
       soil GLDAS-2.1
            moisture productsdata for in
                                       thefourbeltlayers:   0–10 cm,
                                                   of lowlands           10–40 Poland
                                                                    in central   cm, 40–100 withcm   and 100–200
                                                                                                  a longitude        cm. 14.875◦ E
                                                                                                                 between
       The     ◦
              GLDAS-2.1        data  for  the   belt  ◦
                                                     of  lowlands      in◦ central  Poland
and 23.625 E and latitude from 51.375 N to 53.375 N were divided into three equal subareas     with  a longitude   between      14.875°
                                                                                                                                  that
  E and
were      23.625° Efrom
       numbered,        and latitude    fromas51.375°
                              west to east,        1, 2 and N 3to(Figure
                                                                   53.375°2).NEach
                                                                                 weresubarea
                                                                                         dividedhasinto  three equalofsubareas
                                                                                                      a dimension       12 columns  that
  were   numbered,        from   west    to   east,  as  1,  2  and    3  (Figure    2). Each
and 9 rows. Gridded GLDAS-2.1 data (mean air temperature and precipitation total) were compared subarea    has   a dimension      of  12
  columns
with          and 9data
       observed        rows.fromGridded     GLDAS-2.1 data
                                   the meteorological                (mean
                                                               stations       air for
                                                                           (data   temperature
                                                                                        a grid boxandandprecipitation
                                                                                                           station data total)
                                                                                                                         located  were
                                                                                                                                     in
  compared
this  grid box).withFor observed    data from
                           this purpose,            the meteorological
                                              one station    for every subarea stationswas (data  for adata
                                                                                             chosen:     gridfrom
                                                                                                              box and   station
                                                                                                                    Pozna   ń for data
                                                                                                                                    the
  located
first (west)in area;
                 this grid    box). Kalisz
                       data from      For this forpurpose,
                                                    the second   one    stationarea
                                                                    (middle)      for every
                                                                                       and datasubarea     was chosen:
                                                                                                   from Warszawa      fordata     from
                                                                                                                            the third
  Poznań
(east)  area.forData
                   the correlation
                         first (west)forarea;     data from
                                            temperature       wasKalisz     for the
                                                                     very high,    with second    (middle)ofarea
                                                                                           the coefficient          and data from
                                                                                                                determination      (R2 )
  Warszawa0.99
exceeding         forinthe   third cases;
                         all three   (east) forarea.   Data correlation
                                                   precipitation,               for temperature
                                                                       correlation     was also quitewas      very
                                                                                                          good,     high,
                                                                                                                 with an Rwith
                                                                                                                             2 above the
  coefficient    of determination       (R   2) exceeding 0.99 in all three cases; for precipitation, correlation was
0.73 for Poznań (first area) and Warszawa (third area) and above 0.71 for Kalisz (second area) (see
  also quite
Figure   3). good, with an R2 above 0.73 for Poznań (first area) and Warszawa (third area) and above
  0.71 for Kalisz (second area) (see Figure 3).

                                 (a)                                                               (b)
       Figure3.3.Comparison
      Figure      Comparisonofofmonthly
                                  monthlygridded
                                             griddedGLDAS-2.1
                                                       GLDAS-2.1(Global
                                                                    (GlobalLand
                                                                              LandData
                                                                                    DataAssimilation
                                                                                         AssimilationSystem)
                                                                                                       System)data
                                                                                                               data
       with   observed  data at meteorological   stations from  January  2000   to May 2020 for three studied
      with observed data at meteorological stations from January 2000 to May 2020 for three studied areas:    areas:
       (a)for
      (a)  formean
               meanair
                     airtemperature
                         temperature(in
                                      (in◦ C);
                                           °C);(b)
                                                (b)for
                                                    forprecipitation
                                                        precipitationtotal
                                                                      total(in
                                                                             (inmm).
                                                                                 mm).

       Changesininmonthly
     Changes         monthlysoil
                               soilmoisture
                                   moisturecontents
                                               contentsfor
                                                        forseveral
                                                            severalsoil
                                                                    soildepth
                                                                         depthlevels
                                                                                levelswere
                                                                                        wereexamined
                                                                                              examinedfor
                                                                                                       forthe
                                                                                                           the
  aggregatedarea,
aggregated    area,i.e.,
                     i.e., mean
                         mean   values
                              values forfor cells
                                         cells    from
                                               from     12 columns
                                                    12 columns  andand   9 rows
                                                                     9 rows       forperiod
                                                                            for the   the period from January
                                                                                            from January 2000
to2000
   Mayto2020.
         May 2020.

3.3.Results
    Results

3.1.
 3.1.Severity
      SeverityofofDrought
                  DroughtEvents
                          EventsBased
                                 Basedon
                                       onSPEI
                                          SPEI
      Figure
        Figure44presents
                 presentsthethedevelopment
                                 developmentof    ofdrought
                                                     droughtevents
                                                               eventsfor
                                                                       forPozna
                                                                           Poznań  ń for
                                                                                       forthree
                                                                                           threetime
                                                                                                  timescales
                                                                                                         scalesof
                                                                                                                ofSPEI:
                                                                                                                   SPEI:
SPEI   12, SPEI 24  and SPEI   30  in  addition to the same   indices based   on  the   global drought
 SPEI 12, SPEI 24 and SPEI 30 in addition to the same indices based on the global drought monitor         monitor  [34].
The
 [34].SPEI
        The indices  for all
            SPEI indices   forthree   timetime
                                all three   scales for for
                                                scales  gridded   data
                                                            gridded    from
                                                                     data from January
                                                                                  January  1950
                                                                                             1950totoMay
                                                                                                      May20202020reveal
                                                                                                                  reveal
that during   the  last drought     event the  drop   was  the highest  for the   whole    period:
 that during the last drought event the drop was the highest for the whole period: SPEI 24 reached   SPEI   24 reacheda
aminimum         −2.62ininJanuary
  minimumofof−2.62          January2020;2020; SPEI
                                            SPEI  30:30: −2.42
                                                      −2.42     in April
                                                             in April    2020;
                                                                      2020;      in both
                                                                             in both        cases
                                                                                        cases      these
                                                                                               these      results
                                                                                                      results     were
                                                                                                               were one
one  month    earlier than  those    found   through   calculations  in this  study.    For  SPEI
 month earlier than those found through calculations in this study. For SPEI 12, the minimum value  12, the  minimum
 occurred in March 2019 (−2.38). Generally, the courses of the SPEI for all three time scales for Poznań
 station and the gridded data were similar; however, the values for the gridded data were more
 strongly negative. Figures showing the results for the SPEI 12, 24 and 30 for 13 other analyzed stations
 are presented in the Supplementary Materials (see Figures S1–S3). Based on SPEI results,
 identification of drought periods that continuously stayed below −0.5 and lasted for at least five
Severe Drought in the Spring of 2020 in Poland-More of the Same? - MDPI
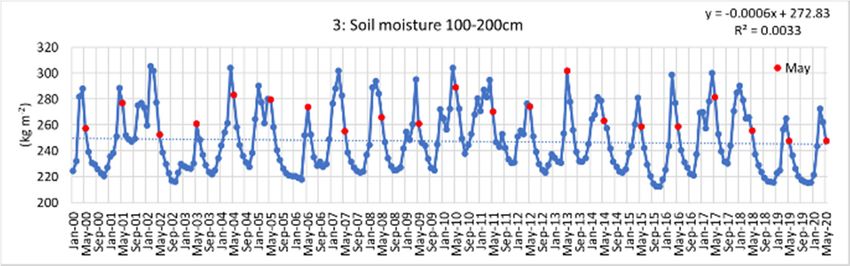
Agronomy 2020, 10, 1646                                                                                                  7 of 20

value occurred in March 2019 (−2.38). Generally, the courses of the SPEI for all three time scales for
Poznań station and the gridded data were similar; however, the values for the gridded data were more
strongly negative. Figures showing the results for the SPEI 12, 24 and 30 for 13 other analyzed stations
are presented in the Supplementary Materials (see Figures S1–S3). Based on SPEI results, identification
of drought periods that continuously stayed below −0.5 and lasted for at least five months with
a minimum
       Agronomyvalue
                 2020, 10, x FOR −1.5,
                        below           i.e., severe drought events, was carried out. For each station there
                                 PEER REVIEW                                                                        7 of 20 were

several periods meeting these criteria. Tables S1–S3 in the Supplementary Materials presented these
       months with a minimum value below −1.5, i.e., severe drought events, was carried out. For each
results for three time scales of SPEI: 12, 24 and 30 months. Based on them, in Tables 1–3, characteristics
       station there were several periods meeting these criteria. Tables S1–S3 in the Supplementary
of the 2020   drought
       Materials           in relation
                   presented             to other
                                these results        drought
                                                for three time events
                                                                scales ofare presented.
                                                                          SPEI: 12, 24 andFor   only one
                                                                                            30 months.      of the
                                                                                                         Based     14 stations
                                                                                                                on them,
analyzed   (Bialystok)       there was    no  severe   drought    (meeting    these  criteria) for all  SPEI
       in Tables 1–3, characteristics of the 2020 drought in relation to other drought events are presented.   calculations   in
2020. At
       Forother    stations,
            only one     of themany     characteristics
                                 14 stations                of the 2020
                                               analyzed (Bialystok)       drought
                                                                        there was nowere    thedrought
                                                                                       severe    most extreme
                                                                                                         (meetingfor    all SPEI
                                                                                                                    these
       criteria)
time scales.     forgridded
               For   all SPEI calculations
                                 data basedinon2020.the At  otherdrought
                                                         global    stations, monitor,
                                                                             many characteristics  of the
                                                                                        the SPEI for   the2020
                                                                                                            griddrought
                                                                                                                  of Białystok
       were the
also showed       mostlow
                very     extreme   for(see
                              values   all SPEI  time scales.
                                             Figures   S1–S3),For
                                                                ingridded   datafor
                                                                    particular   based
                                                                                    SPEIon 24
                                                                                           theand
                                                                                               global drought
                                                                                                   SPEI         monitor,
                                                                                                           30—the    values for
       the SPEI   for  the  grid of Białystok
the spring 2020 drought were the lowest there.  also  showed   very  low  values (see Figures  S1–S3),  in particular  for
        SPEI 24 and SPEI 30—the values for the spring 2020 drought were the lowest there.

                                  (a)                                                    (b)

                                  (c)                                                     (d)

                                  (e)                                                     (f)
             Figure 4. Values of SPEI 12 (Standardized Precipitation-Evapotranspiration Index for 12 months),
      Figure 4. Values of SPEI 12 (Standardized Precipitation-Evapotranspiration Index for 12 months), SPEI
             SPEI 24 and SPEI 30 for Poznań from January 1971 to May 2020 based on station data (a,c,e) and
      24 and SPEI 30 for Poznań from January 1971 to May 2020 based on station data (a,c,e) and gridded
             gridded data for Poznań from January 1950 to May 2020 based on the SPEI global drought monitor
      data for Poznań from January 1950 to May 2020 based on the SPEI global drought monitor (b,d,e).
             (b,d,e).

        3.1.1. SPEI 12
Severe Drought in the Spring of 2020 in Poland-More of the Same? - MDPI
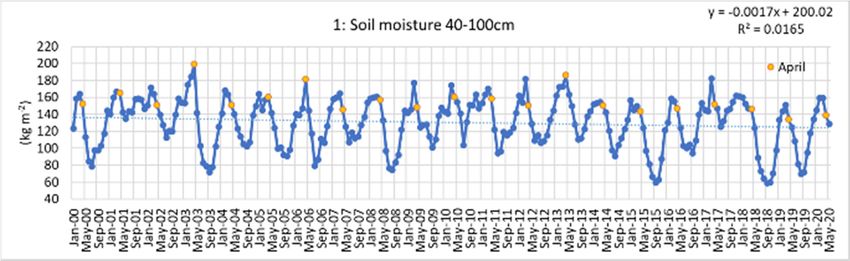
Agronomy 2020, 10, 1646                                                                                    8 of 20

3.1.1. SPEI 12
     For SPEI 12, there were between two (Poznań) and eight (Lublin) periods meeting the above
criteria (Table 1). At half of stations (seven of 14), the lowest minimum value for the period from
January 1971 to May 2020 occurred during the last drought, lasting up to the end of May 2020. However,
only in two cases these minimum values occurred in 2020. Despite the fact that only in four cases the
spring drought of 2020 was the longest, in six cases the cumulative deficit below −0.5 was the most
extreme. Our calculations were conducted until the end of May 2020, so these results could have been
even higher if June and further months were considered, due to the occurrence of near-normal seasonal
precipitation and of high temperatures during the summer of 2020, increasing evapotranspiration.
Among earlier drought events, the drought of 2006 was the longest at four stations. Also in 2006, the
most extreme value of SPEI 12 (−2.59 in Siedlce) was observed; whereas the most severe (with the
lowest minimum) drought event occurred in 2015 (at two stations). For Białystok, the most severe
droughts occurred in 1972 and 2000/2001 (see Figure S1 and Table S1).

     Table 1. Characteristics of the 2020 spring drought event in relation to other drought periods in the
     time interval from January 1971 to May 2020, for which the value of SPEI 12 stayed below −0.5 and
     lasted at least five months, with a minimum value below −1.5 (definition of severe drought). * means
     that the drought was observed until the end of May 2020, so it may have lasted longer.

                                      Duration of                                               Data of
                     Duration of                          Cumulative
                                     Drought Events                          Minimum           Minimum
     Station        Drought Event                        Deficit Below
                                         Max–                              Value/Ranking         Value
                  (Months)/Ranking                       −0.5/Ranking
                                      Min/Number                                               Occurrence
   Szczecin               23 */1         23–16/5            −36.26/1           −2.30/1          19 April
   Toruń                 21 */3         13–24/6            −31.91/3           −1.98/2        18 November
   Białystok                -               -                   -                 -                 -
   Gorzów
                          18/4           23–13/6            −26.96/2           −2.13/2          19 April
   Wielkopolski
   Poznań                23 */2         24–23/2            −42.30/1           −2.23/1           19 June
   Warszawa               24 */2         26–5/7             −39.60/1           −2.10/1           20 May
   Siedlce                12 */4         21–8/7             −15.32/4           −1.66/5         20 January
   Terespol           24 */1 (2)         24–8/7             −34.55/1           −1.85/3        19 December
   Zielona
                          23 */2         47–15/5            −38.24/2           −2.18/1          19 April
   Góra
   Wrocław                26 */1         26–10/5            −43.04/1           −2.24/1           19 July
   Kalisz             23 */2 (2)         40–12/7            −35.10/2           −1.77/3           19 June
   Łódź                  21 */4         31–14/5            −31.78/3           −2.16/1          20 March
   Lublin                 23 */1         23–6/8             −36.18/1           −2.32/1          19 April
   Włodawa                21 */2         25–8/8             −29.52/2           −1.93/7         20 January

3.1.2. SPEI 24
      Table 2 presents outcomes for drought events based on results of SPEI 24. In this case, for eight
stations the lowest minimum value occurred during the 2020 spring drought and only in one case it
was in December 2019 (Poznań); the other minimums were observed in 2020 (mainly in April). For
one station (Wrocław), despite the shorter duration of the drought event (25 months; third longest),
its cumulative deficit below −0.5 and minimum value were the lowest from all three drought events
meeting the criteria (see Table S2). At Włodawa station, the most extreme value of SPEI 24 (−2.73 in
September 2003) occurred during a drought lasting four years and covering two very dry periods in
2003 and 2006. Additionally, this period was the most severe for six stations, mainly due to the longest
duration and the most extreme cumulative deficit below −0.5 (see Figure S2 and Table S2).
Severe Drought in the Spring of 2020 in Poland-More of the Same? - MDPI
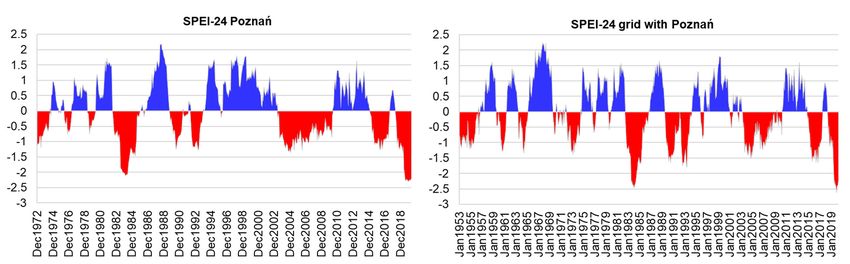
Agronomy 2020, 10, 1646                                                                                   9 of 20

     Table 2. Characteristics of the 2020 spring drought event in relation to other drought periods in the
     time interval from January 1971 to May 2020, for which SPEI 24 value stayed below −0.5 and lasted at
     least five months, with a minimum value below −1.5 (definition of severe drought). Symbol * means
     that the drought was observed until the end of May 2020, so it may have lasted longer.

                                         Duration of                                         Data of
                        Duration of                       Cumulative
                                        Drought Events                      Minimum         Minimum
        Station        Drought Event                     Deficit Below
                                            Max–                          Value/Ranking       Value
                     (Months)/Ranking                    −0.5/Ranking
                                         Min/Number                                         Occurrence
      Szczecin            12 */6           45–12/6          −23.01/4          −2.11/1         20 April
      Toruń              12 */6           29–12/6          −21.20/5          −2.14/2         20 April
      Białystok             -                 -                -                 -               -
      Gorzów
                          12 */4           59–12/4          −19.78/4          −1.92/2         20 May
      Wielkopolski
      Poznań             23 */2           35–23/2          −38.67/2          −2.29/1       19 December
      Warszawa            15 */4           25–14/5          −28.41/3          −2.49/1       20 February
      Siedlce             12 */4           64–12/4          −16.66/3          −1.78/3         20 April
      Terespol            16 */3           52–15/4          −27.05/3          −2.27/1         20 April
      Zielona
                          20 */4           54–13/5          -28.95/3          −2.12/1        20 January
      Góra
      Wrocław             25 */3           38–25/3          −41.18/1          −2.34/1         20 April
      Kalisz              20 */5           41–20/5          −27.72/4          −2.05/1         20 April
      Łódź               12 */4           39–12/4          −19.34/4          −1.99/2         20 April
      Lublin              23 */2           33–12/4          −37.95/2          −2.39/1         20 April
      Włodawa             16 */2            48–6/6          −23.89/2          −2.03/2       19 December

3.1.3. SPEI 30
     For SPEI 30, the drought event recorded until the end of May 2020 for all stations (13 from 14) was
not the longest one in the analyzed period for any station. However, for all stations, the minimum
values of SPEI 30 were noted in April and May 2020, and for nine stations these values were the
most extreme (Table 3). In April 2020 in Warszawa, SPEI 30 dropped to the extreme value of −2.61,
while during the drought event beginning in 2015, this value was −2.03 in September 2016. As for
SPEI 24, the most extreme value of SPEI 30 also occurred at Włodawa station (−2.67 in March 2004).
The drought as a consequence of the dry years of 2003 and 2006 had the longest duration and the most
extreme cumulative deficit below −0.5 for eight others stations (see Figure S3 and Table S3).

3.1.4. Extreme Values of the SPEI 12, 24 and 30 in 2020
     The severity of the 2020 spring drought increases with the scale in SPEI. The SPEI 12 revealed
extreme drought for months from January to May of 2020 (values below −2.0) only at a few stations.
Additionally, values for particular months were not the most extreme for the whole analyzed period
from January 1971 to May 2020 (Table 4). According to results of the SPEI 24, more severe conditions
occurred at eight stations in January, February and March and the index reached a value below −2.0;
in April it was reached at nine stations, and in May at five stations. Additionally, at eight stations,
conditions for all months from January to May were the most severe. In April 2020, the driest conditions
were noted for 12 of the 14 analyzed stations. SPEI 30 values below −2.0 occurred mainly in April (10
times) and May (11 times) and at half of all (seven of 14) stations; these values were the most extreme
for the months from January to May.
Severe Drought in the Spring of 2020 in Poland-More of the Same? - MDPI
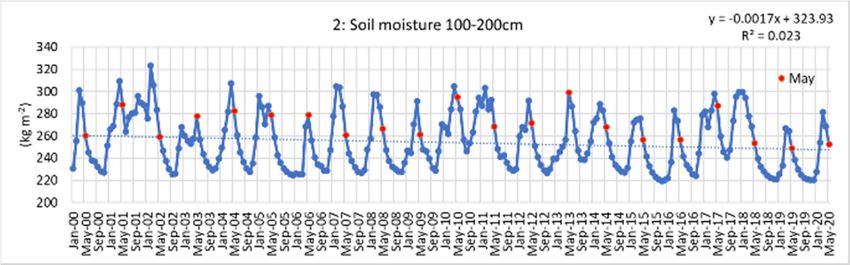
Agronomy 2020, 10, 1646                                                                                             10 of 20

     Table 3. Characteristics of the 2020 spring drought event in relation to other drought periods in the
     time interval from January 1971 to May 2020, for which SPEI 30 value stayed below −0.5 and lasted at
     least five months, with a minimum value below −1.5 (definition of severe drought). Symbol * means
     that the drought was observed until the end of May 2020, so it may have lasted longer.

                                                                                                     Data of
                        Duration of      Duration of             Cumulative
                                                                                   Minimum          Minimum
        Station        Drought Event    Drought Events          Deficit Below
                                                                                 Value/Ranking        Value
                     (Months)/Ranking   Max–Min/Number          −0.5/Ranking
                                                                                                    Occurrence
      Szczecin            11 */5             39−11/5              -14.75/5           −2.13/1         20 May
      Toruń              10 */6             27−10/6              -12.87/6           −2.13/2         20 April
      Białystok                 -               -                     -                 -               -
      Gorzów
                              7 */4          60−7/4                −9.37/4           −1.86/2         20 May
      Wielkopolski
      Poznań             22 */3             49−22/3              −35.13/3           −2.26/1        20 May-20
      Warszawa            12 */6             36−12/6              −22.87/6           −2.61/1         20 April
      Siedlce             11 */3             63−11/3              −11.86/3           −1.86/2         20 April
      Terespol            14 */3             59−14/3              −22.26/3           −2.20/1         20 April
      Zielona
                          14 */3             49−14/3              −20.60/3           −2.06/1         20 May
      Góra
      Wrocław             24 */4             66−24/4              −38.15/2           −2.44/1         20 April
      Kalisz              14 */4             53−14/4              −20.73/4           −2.13/1         20 April
      Łódź               10 */5             47−10/5              −12.47/5           −2.13/1         20 April
      Lublin              22 */2             32−22/2              −35.25/2           −2.51/1         20 April
      Włodawa             14 */3             49−14/3              −20.47/3           −2.14/2         20 April

          Table 4. Extreme values of the SPEI 12, 24 and 30 for the months from January to May 2020.

                           SPEI 12                              SPEI 24                         SPEI 30
    Station
                  Value ≤ −2.0     Record              Value ≤ −2.0     Record         Value ≤ −2.0     Record
 Szczecin                 -              -              JFMAM             JFMAM             ____M        JFMAM
 Toruń                   -              -              JFMA_             J_MA_             ___AM        ___AM
 Białystok                -              -                 -                 -                 -            -
 Gorzów
                          -              -                  -                J__A_             -                -
 Wielkopolski
 Poznań                -              ____M            JFMAM             JFMAM             JFMAM       JFMAM
 Warszawa             JFM_M           JFMAM             JFMAM             JFMAM             __MAM       JFMAM
 Siedlce                -                -                 -                 -                 -        ___AM
 Terespol               -             JFMAM             JFMA_             __MAM             __MAM       JFMAM
 Zielona Góra           -                -              JFMAM             JFMAM             ___AM       JFMAM
 Wrocław                -             ___AM             JFMAM             JFMAM             JFMAM       JFMAM
 Kalisz                 -              ___A_             ___A_            JFMAM             ___AM       JFMAM
 Łódź                JFMA_           JFMA_                -              JFMAM             ___AM       __MAM
 Lublin                 -                -              JFMA_             JFMAM             J_MAM       J_MAM
 Włodawa                -                -                 -               ___A_            ___AM          -

3.1.5. Trend Detection in Annual ET0 and Precipitation Total for Three Stations: Poznań, Kalisz
and Warszawa
      At all three analyzed stations, the Mann–Kendall test revealed statistically significant (below 0.05)
increasing trends for reference crop evapotranspiration (ET0 ). The precipitation totals for Poznań and
Warszawa show an increasing tendency and a decreasing one for Kalisz, but all three changes were
statistically insignificant (Figure 5). Maximum values of annual ET0 were recorded during the last
severe droughts: 2015, 2018 and 2019, and also meet one of the minimum values of precipitation:
Warszawa
      At all three analyzed stations, the Mann–Kendall test revealed statistically significant (below
 0.05) increasing trends for reference crop evapotranspiration (ET0). The precipitation totals for
 Poznań 2020,
Agronomy  and 10,Warszawa
                   1646      show an increasing tendency and a decreasing one for Kalisz, but all11three   of 20
 changes were statistically insignificant (Figure 5). Maximum values of annual ET0 were recorded
 during the last severe droughts: 2015, 2018 and 2019, and also meet one of the minimum values of
for  Kalisz the maximum
 precipitation:   for Kalisz ET   occurred inET
                             the0 maximum     2015 (861 mm)
                                               0 occurred  in with
                                                              2015 a(861
                                                                      minimum   precipitation
                                                                         mm) with  a minimum  total of 259 mm;
                                                                                                 precipitation
in  Pozna  ń in 2018  (931 mm)   with a precipitation of 379 mm;   and  in Warszawa  in 2019
 total of 259 mm; in Poznań in 2018 (931 mm) with a precipitation of 379 mm; and in Warszawa   (947 mm) with  in
a2019
   precipitation
       (947 mm) of    390amm.
                   with    precipitation of 390 mm.

                                         evapotranspiration (ET00) (dashed line) and precipitation total (solid
      Figure 5. Annual reference crop evapotranspiration
      line) for three station: Poznań,             Warszawa for
                               Poznań, Kalisz and Warszawa  for the
                                                                 the period
                                                                     period of
                                                                            of 1971–2019.
                                                                               1971–2019.

3.1.6. Trend Detection
3.1.6. Trend Detection in
                       in SPEI
                          SPEI 12,
                               12, 24
                                   24 and
                                      and 30
                                          30
      At
      At most
          most analyzed
                  analyzed stations,
                               stations, the
                                          the Mann–Kendall
                                               Mann–Kendall test     test detected
                                                                           detected decreasing        trends for
                                                                                       decreasing trends       for all
                                                                                                                    all scales
                                                                                                                        scales of
                                                                                                                                of
SPEI.  For  SPEI    12,  a statistically  significant  (at   the  level   of 0.05)  decreasing      trend
SPEI. For SPEI 12, a statistically significant (at the level of 0.05) decreasing trend was detected at 10  was  detected    at  10
of
of the
   the 14
        14 stations.
            stations. ForFor an
                              an additional    two stations,
                                  additional two     stations, Warszawa
                                                                  Warszawa and   and Siedlce,
                                                                                        Siedlce, the
                                                                                                   the decreasing
                                                                                                        decreasing trend
                                                                                                                      trend was
                                                                                                                             was
weaker
weaker butbutstill
               stillstatistically
                      statisticallysignificant
                                     significantatat
                                                   the  level
                                                      the  levelof of
                                                                    0.1,0.1,
                                                                         andandfor for
                                                                                   twotwo remaining    stations
                                                                                               remaining         (Szczecin
                                                                                                            stations          and
                                                                                                                       (Szczecin
Białystok),   the  trend   was   insignificant.
and Białystok), the trend was insignificant.
      For
      For SPEI
           SPEI 24,24, at
                        at 12
                           12 stations,
                               stations, aa statistically
                                            statistically significant
                                                            significant (at (at the
                                                                                the level
                                                                                      level of
                                                                                             of 0.05)
                                                                                                 0.05) decreasing
                                                                                                        decreasing trend
                                                                                                                      trend was
                                                                                                                             was
detected   and   at  one  additional   station  (Siedlce),   it was   detected    at  the  level  of 0.1,
detected and at one additional station (Siedlce), it was detected at the level of 0.1, while at Szczecin  while  at Szczecin    no
change   was    detected.     Similar  results   can  be  reported     for   SPEI  30:   11  statistically
no change was detected. Similar results can be reported for SPEI 30: 11 statistically significant (at the   significant   (at  the
level
level of
      of 0.05)
         0.05) decreasing
                 decreasingtrends,
                                trends,two
                                         twoweaker
                                               weaker(at (atthe
                                                              thelevel
                                                                   levelofof0.1) trends
                                                                              0.1)  trends at at
                                                                                              Warszawa
                                                                                                 Warszawa  andand
                                                                                                                Siedlce   andand
                                                                                                                    Siedlce     no
statistically  significant
no statistically              trend
                    significant      for for
                                  trend  Szczecin.
                                             Szczecin.
3.2. Soil Moisture Changes Based on GLDAS-2.1 Data
      Figure 6 presents the percentage decrease in monthly soil moisture contents in 2020 relative to the
      Figure 6 presents the percentage decrease in monthly soil moisture contents in 2020 relative to
monthly mean (2000–2019) soil moisture contents at two depth ranges, 40 to 100 cm and 100 to 200 cm, in
the monthly mean (2000–2019) soil moisture contents at two depth ranges, 40 to 100 cm and 100 to
April and May. In eastern Poland for the shallower layer for April 2020 this decrease dropped by up to
200 cm, in April and May. In eastern Poland for the shallower layer for April 2020 this decrease
25% (Figure 6a). The soil moisture content ranged for this layer from 40 to 220 kg m−2 . A decrease for
dropped by up to 25% (Figure 6a). The soil moisture content ranged for this layer from 40 to 220 kg
May   2020 at the depth range from 100 to 200 cm reached up to 12% in the eastern part of the country
m−2. A decrease for May 2020 at the depth range from 100 to 200 cm reached up to 12% in the eastern
(Figure 6d). Figure 6c,d depicts a deep layer with soil moisture contents between 180 and 320 kg m−2 .
part of the country (Figure 6d). Figure 6c,d depicts a deep layer with soil moisture contents between
Additionally, it is worth pointing out that the 2000–2019 mean includes very dry years: 2003, 2006, 2015,
180 and 320 kg m−2. Additionally, it is worth pointing out that the 2000–2019 mean includes very dry
2018 and 2019. A decrease in monthly soil moisture contents in April and May 2020 was the highest in
years: 2003, 2006, 2015, 2018 and 2019. A decrease in monthly soil moisture contents in April and May
the eastern part of the studied area. This part has a greater annual precipitation (above 600 mm) than the
2020 was the highest in the eastern part of the studied area. This part has a greater annual
central and western parts (below 600 mm). Furthermore, the amount of snow cover was larger and the
precipitation (above 600 mm) than the central and western parts (below 600 mm). Furthermore, the
annual temperature was lower [15], so the monthly 2000–2019 mean values of soil moisture content were
amount of snow cover was larger and the annual temperature was lower [15], so the monthly 2000–
higher there: 157, 166 and 168 kg m−2 for the first, second and third parts, respectively, for the depth
range from 40 to 100 cm in April 2020; and 255, 270 and 268 kg m−2 , respectively, for the depth range
from 100 to 200 cm in May. After precipitation in May 2020 (below normal in the western, near normal in
the central and above normal in the eastern part of the study), moisture conditions in the shallower layer
improved (40–100 cm, Figure 6c) and became worse in the deeper layer (100–200 cm, Figure 6d).
Agronomy 2020, 10, x FOR PEER REVIEW                                                                                      12 of 20

second and third parts, respectively, for the depth range from 40 to 100 cm in April 2020; and 255,
270 and 268 kg m−2, respectively, for the depth range from 100 to 200 cm in May. After precipitation
in May 2020 (below normal in the western, near normal in the central and above normal in the eastern
Agronomy 2020, 10, 1646                                                                       12 of 20
part of the study), moisture conditions in the shallower layer improved (40–100 cm, Figure 6c)  and
became worse in the deeper layer (100–200 cm, Figure 6d).

                                 (a)                                                           (b)

                                 (c)                                                           (d)

      Figure
      Figure 6.
              6. Percent decreases in
                 Percent decreases  inmonthly
                                       monthlysoil soilmoisture
                                                        moisturecontents
                                                                  contents
                                                                         in in 2020
                                                                            2020      relative
                                                                                  relative      to the
                                                                                            to the     monthly
                                                                                                   monthly      2000–
                                                                                                            2000–2019
      2019
      meanmean    soil moisture
            soil moisture       contents
                           contents        for:
                                    for: (a)    (a) April
                                             April        at 40–100
                                                    at 40–100       cm depth;
                                                              cm depth;          (b) at
                                                                         (b) April   April   at 100–200
                                                                                        100–200          cm depth;
                                                                                                  cm depth; (c) May(c)
                                                                                                                    at
      May  at 40–100   cm  depth;  (d) May   at  100–200   cm  depth. Data   are  from   the  NASA
      40–100 cm depth; (d) May at 100–200 cm depth. Data are from the NASA Goddard Earth Sciences Data Goddard  Earth
      Sciences Data andServices
      and Information     Information  Services
                                  Center          Center (GES DISC).
                                          (GES DISC).

       For
       For all depth layers
                         layers and
                                  andstudied
                                        studiedareas,
                                                  areas,a adecreasing
                                                             decreasing    tendency
                                                                        tendency   in in
                                                                                       soilsoil moisture
                                                                                             moisture        contents
                                                                                                         contents       during
                                                                                                                    during    the
the  period
period    fromfrom   January
                January     20002000    to May
                                   to May  20202020    was detected.
                                                  was detected.          The most
                                                                    The most         shallow
                                                                                shallow  layer layer    ofatsoil,
                                                                                                  of soil,    theat the depth
                                                                                                                  depth   range
range
 from 0from
          to 100cm,
                 to 10is cm,  is the fragile
                          the most    most fragile   as regards
                                              as regards           transpiration
                                                            transpiration          and
                                                                             and loss ofloss
                                                                                         water, of water,
                                                                                                   but soilbut  soil moisture
                                                                                                              moisture   in this
in  thisalso
 layer   layer  also replenishes
             replenishes      quickly.quickly.    For all
                                         For all three     threethe
                                                       areas,     areas,  thevalues
                                                                     lowest    lowestwere
                                                                                       values    werefor
                                                                                             visible    visible
                                                                                                           summer for 2015
                                                                                                                      summer and
     Agronomy 2020, 10, x FOR PEER REVIEW                                                                              13 of 20
2015
 then and   then for
       for 2006.  One2006.     One
                          of the      of the
                                  lowest     lowestfor
                                           maxima    maxima
                                                         winterfor    winter precipitation
                                                                  precipitation   was observed  was during
                                                                                                     observed     during
                                                                                                               2020        2020
                                                                                                                     (Figure    7).
(Figure 7).

                                                                (a)
                                                                (a)

                                                                (b)

                                                        Figure 7. Cont.
Agronomy 2020, 10, 1646                                                                                                  13 of 20
                                                              (b)

                                                              (b)

                                                              (c)
         Figure                                              m−2(c)
      Figure   7. 7. Monthlysoil
                  Monthly     soilmoisture
                                   moisturecontents
                                             contentsin
                                                      inkg
                                                         kg m   −2 during the period from January 2000 to May 2020
                                                                    during the period from January 2000 to May 2020
      forfor a range
          a range
        Figure         of depths
                     of depths
                 7. Monthly      from
                               from
                             soil     0 to 10 cm, for
                                     0 to 10contents
                                  moisture            (a)
                                             cm, for in
                                                     (a)kg the
                                                          the  first;
                                                             mfirst;
                                                               −2     (b) the
                                                                      (b)
                                                                  during   thesecond;
                                                                          the second; and
                                                                                       and(c)
                                                                               period from (c)the
                                                                                               thethird
                                                                                           January thirdsubareas.
                                                                                                     2000subareas.
                                                                                                          to May 2020
        for a range of depths from 0 to 10 cm, for (a) the first; (b) the second; and (c) the third subareas.
        Similarbehavior
     Similar      behaviorcan canbebeobserved
                                      observed for for a deeper
                                                          deeper soil
                                                                   soil layer,
                                                                         layer,from
                                                                                 from10 10toto4040cm
                                                                                                   cmbelow
                                                                                                       below the
                                                                                                               theground
                                                                                                                     ground
   surface  (Figure
surfaceSimilar       8).
        (Figurebehavior   Especially
                  8). Especially
                             can befor for  the first
                                         the firstfor
                                     observed          area,
                                                   area,     one  can
                                                          one cansoil
                                                       a deeper       notice
                                                                   notice  very
                                                                      layer,   very   small
                                                                                  small
                                                                               from          moisture
                                                                                      10 moisture       recovery
                                                                                         to 40 cm recovery
                                                                                                     below thefor  for
                                                                                                                    thethe
                                                                                                                 ground most
   most
  surface
recent   recent  winters,
           (Figureand
       winters,     8). the and   the
                         Especially
                             deepestfordeepest   summer      excursions
                                           the firstexcursions
                                        summer        area, one were      were
                                                                 can notice  very
                                                                       in 2015   in 2015  followed
                                                                                     small moisture
                                                                                  followed            by  2018
                                                                                              by 2018 recovery and
                                                                                                       and 2019.for  2019.
                                                                                                                      the for
                                                                                                                    Only
theOnly
  most   for the
        recent
    eastern       eastern
                 winters,
              (third) area,(third)
                           and   thearea,
                              more         moresummer
                                      deepest
                                     moisture     moisture
                                                 was          was recorded
                                                            excursions
                                                        recorded   duringwereduring
                                                                                in 2015winters,
                                                                            winters,           forapart
                                                                                         followed
                                                                                       apart         by for
                                                                                                   winter   winter
                                                                                                         2018        2020.
                                                                                                              and 2019.
                                                                                                            2020.
  Only for the eastern (third) area, more moisture was recorded during winters, apart for winter 2020.

                                                               (a)
                                                              (a)

  Agronomy 2020, 10, x FOR PEER REVIEW                        (b)                                                    14 of 20

                                                              (c)
        Figure8.8.Monthly
      Figure         Monthlysoil
                               soilmoisture
                                    moisture contents
                                             contents in
                                                      in kg
                                                          kg mm−2during
                                                                −2
                                                                    duringthe  period
                                                                             the      from
                                                                                 period fromJanuary
                                                                                               January2000  to May
                                                                                                         2000       2020
                                                                                                               to May  2020
      forfora arange
                 rangeofofdepths
                           depthsfrom
                                  from10
                                       10to
                                          to 40
                                             40 cm,
                                                cm, for
                                                    for (a)
                                                        (a) the
                                                            the first;
                                                                 first;(b)
                                                                        (b)the
                                                                            thesecond;
                                                                                second;and
                                                                                        and(c)(c)
                                                                                                the third
                                                                                                  the     subareas.
                                                                                                      third  subareas.

       For the soil layer from 40 to 100 cm (Figure 9) the deepest excursions were also visible for the
  summers of 2015 and 2018. For April 2019 and 2020, the soil moisture contents were the lowest for all
  studied periods.
(c)
Agronomy 2020, 10, 1646                                                                                                 14 of 20
        Figure 8. Monthly soil moisture contents in kg m−2 during the period from January 2000 to May 2020
        for a range of depths from 10 to 40 cm, for (a) the first; (b) the second; and (c) the third subareas.
     For the soil layer from 40 to 100 cm (Figure 9) the deepest excursions were also visible for the
summersForof
           the soiland
             2015   layer fromFor
                        2018.  40 April
                                  to 1002019
                                         cm (Figure 9) the
                                             and 2020,  thedeepest excursions
                                                           soil moisture      werewere
                                                                         contents  also the
                                                                                        visible for the
                                                                                            lowest  for all
  summers of 2015 and 2018. For April 2019 and 2020, the soil moisture contents were the lowest for all
studied periods.
  studied periods.

                                                              (a)

                                                             (b)

                                                              (c)
        Figure
     Figure   9.9.Monthly
                   Monthlysoil
                            soilmoisture
                                 moisture contents
                                          contents in kg mm−2−2during
                                                                 duringthe theperiod
                                                                               periodfrom January
                                                                                       from  January  2000  to May
                                                                                                         2000      2020
                                                                                                               to May 2020
     forfor a rangeofofdepths
          a range       depthsfrom
                               from40
                                    40to
                                       to100
                                          100 cm,
                                              cm, for
                                                  for (a)
                                                      (a) the
                                                          the first;
                                                               first; (b)
                                                                       (b)the
                                                                           thesecond;
                                                                               second;and
                                                                                        and(c)(c)the third
                                                                                                   the     subareas.
                                                                                                       third  subareas.

     The deepest soil layer, from 100 to 200 cm, is the least sensitive to fast changes at the soil surface
(Figure 10). However, for the first area, shortages of water were quite well visible during dry years:
2015, 2018 and 2019. For all three areas, a very small maximum can be noticed for the winter of 2019.
Additionally, values for May 2018, 2019 and 2020 were among the smallest in the time series.
Agronomy 2020, 10, x FOR PEER REVIEW                                                                                 15 of 20

     The deepest soil layer, from 100 to 200 cm, is the least sensitive to fast changes at the soil surface
(Figure 10). However, for the first area, shortages of water were quite well visible during dry years:
 Agronomy
2015,       and10,2019.
      20182020,    1646 For all three areas, a very small maximum can be noticed for the winter of 2019.
                                                                                                      15 of 20

Additionally, values for May 2018, 2019 and 2020 were among the smallest in the time series.

                                                             (a)

                                                             (b)

                                                             (c)
     Figure
      Figure10.
              10.Monthly
                  Monthlysoil
                            soilmoisture
                                 moisturecontents       kgmm−2−2during
                                           contentsininkg         duringthetheperiod
                                                                               periodfrom
                                                                                       fromJanuary
                                                                                             January2000
                                                                                                       2000totoMay
                                                                                                                May2020
                                                                                                                    2020
     for
      foraarange
            rangeofofdepths
                      depthsfrom
                             from100
                                   100toto200
                                           200cm,
                                               cm,for
                                                   for(a)
                                                        (a)the
                                                            thefirst;
                                                                 first;(b)
                                                                        (b)the
                                                                            thesecond;
                                                                                second;and
                                                                                         and(c)
                                                                                              (c)the
                                                                                                  thethird
                                                                                                      thirdsubareas.
                                                                                                             subareas.

4.4.Discussion
     Discussion

       InInPoland,
            Poland,seasonal
                       seasonalprecipitation
                                  precipitationduring
                                                 duringautumns
                                                           autumnsand andwinters
                                                                            wintersshould
                                                                                      shouldimprove
                                                                                               improvethe thesoil
                                                                                                              soilmoisture
                                                                                                                    moisture
  conditions     after  warm    or  warm  and  dry   springs   and   summers.    If  during  a
conditions after warm or warm and dry springs and summers. If during a cold season precipitationcold season   precipitation
  totalsare
totals     arebelow
               belowor  ornear
                           nearnormal,
                                  normal,atatthe
                                              thebeginning
                                                   beginningofofthe thenext
                                                                         nextwarm
                                                                               warmseason,
                                                                                       season,thethemoisture
                                                                                                     moistureconditions
                                                                                                                 conditions
  couldbe
could      beinsufficient
              insufficientand andcontribute
                                   contributeto
                                              toaadrought.
                                                    drought.Since
                                                                Since2015
                                                                       2015until
                                                                              untilthe
                                                                                    thepresent,
                                                                                        present,2017
                                                                                                   2017was
                                                                                                        wasthetheonly
                                                                                                                   onlyyear
                                                                                                                         year
  with   a  precipitation    total considerably   above    the long-term     mean.   Additionally,
with a precipitation total considerably above the long-term mean. Additionally, the years 2015, 2018  the  years  2015, 2018
  and 2019
and     2019 witnessed
               witnessedhigher-than-normal
                               higher-than-normal  air air
                                                       temperatures
                                                            temperaturesand heat
                                                                              and waves,   which exacerbated
                                                                                     heat waves,                   shortages
                                                                                                     which exacerbated
  of water. of
shortages      This situation
                  water.   This also  coincides
                                 situation       with the occurrence
                                           also coincides                  of small (orofeven
                                                              with the occurrence         small non-existent)   snow cover
                                                                                                  (or even non-existent)
  in winter,   leading    to  increasingly drier  soil  conditions.
snow cover in winter, leading to increasingly drier soil conditions.
       InInthis
            thisresearch,
                 research,ititwaswasshown
                                     shownthat
                                             thatthe
                                                   the2020
                                                       2020spring
                                                              springdrought
                                                                      droughtwas wasoneoneofofthe
                                                                                               themost
                                                                                                    mostsevere
                                                                                                          severeininthe
                                                                                                                     thelast
                                                                                                                          last
  five  decades.    It  also  presented   decreasing    trends   of SPEI   at most   stations  located
five decades. It also presented decreasing trends of SPEI at most stations located in central Poland.   in  central  Poland.
  Cumulativewater
Cumulative        watershortages
                          shortages from
                                      from year
                                            year to
                                                  to year,
                                                     year, despite
                                                            despite very
                                                                      veryhigh
                                                                            highprecipitation
                                                                                   precipitationininFebruary
                                                                                                      February2020,
                                                                                                                  2020,led
                                                                                                                         ledto
tothe
    thedevelopment
          developmentofofsevereseveredrought,
                                      drought, asas
                                                  reflected
                                                     reflectedinin
                                                                 very  low
                                                                    very  lowSPEI
                                                                               SPEI values.
                                                                                      values.
         The presented soil moisture contents for all studied depth layers from January 2000 to May 2020
  indicate a decreasing tendency. This shift to drier soil conditions is a result of the occurrence of dry
  and warm years, but also higher temperatures during all seasons. Observed warming at a range of
You can also read