Greenhouse gas emissions from the water-air interface of a grassland river: a case study of the Xilin River - Nature
←
→
Page content transcription
If your browser does not render page correctly, please read the page content below
www.nature.com/scientificreports
OPEN Greenhouse gas emissions
from the water–air interface
of a grassland river: a case study
of the Xilin River
Xue Hao1, Yu Ruihong1,2*, Zhang Zhuangzhuang1, Qi Zhen1, Lu Xixi1,3, Liu Tingxi4* &
Gao Ruizhong4
Greenhouse gas (GHG) emissions from rivers and lakes have been shown to significantly contribute
to global carbon and nitrogen cycling. In spatiotemporal-variable and human-impacted rivers in
the grassland region, simultaneous carbon dioxide, methane and nitrous oxide emissions and their
relationships under the different land use types are poorly documented. This research estimated
greenhouse gas (CO2, CH4, N2O) emissions in the Xilin River of Inner Mongolia of China using direct
measurements from 18 field campaigns under seven land use type (such as swamp, sand land,
grassland, pond, reservoir, lake, waste water) conducted in 2018. The results showed that CO2
emissions were higher in June and August, mainly affected by pH and DO. Emissions of CH4 and
N2O were higher in October, which were influenced by TN and TP. According to global warming
potential, CO2 emissions accounted for 63.35% of the three GHG emissions, and CH4 and N2O
emissions accounted for 35.98% and 0.66% in the Xilin river, respectively. Under the influence of
different degrees of human-impact, the amount of CO2 emissions in the sand land type was very high,
however, CH4 emissions and N2O emissions were very high in the artificial pond and the wastewater,
respectively. For natural river, the greenhouse gas emissions from the reservoir and sand land were
both low. The Xilin river was observed to be a source of carbon dioxide and methane, and the lake was
a sink for nitrous oxide.
As the concentration of greenhouse gas increases, the global warming effect becomes more p ronounced1. Carbon
dioxide (CO2), methane ( CH4) and nitrous oxide ( N2O) have been shown to dominate the well-mixed green-
house gas (GHG), contributing 80% of the positive radiative forcing that drives climate change2,3. CO2 has long
been known as an important greenhouse gas, and CH4 is also an important greenhouse gas. The global warm-
ing potential of CH4 in 100 years is 25 times that of CO2, and the contribution rate to the greenhouse effect is
approximately 22%4,5. The N 2O molecule is a powerful greenhouse gas that has a global warming potential 296
times greater than that of C O26. Global warming could have a significant impact on local and regional climatic
regimes, which would in turn impact hydrological and water resources s ystems1,7. The terrestrial ecosystem
carbon cycle and its driving mechanisms are important components of current global change research. They are
the key to predicting future atmospheric CO2 changes and global warming. The carbon cycle of the terrestrial
ecosystem is mainly reflected in the exchange of C O2 on land and in lakes, rivers and the atmosphere, as well as
in the direct transport of carbon to the ocean by river action8,9.
The river system connects the two carbon banks of land and sea. It is a key link in the global carbon cycle
and the main channel for land-based carbonaceous materials to enter the sea10. The river carbon cycle refers to
the entire process of carbon sources from different sources in the terrestrial system entering the river network
system in a variety of forms under the influence of machinery, biochemistry and human activities. Rivers are
significant source of greenhouse gas emissions. It is estimated that aquatic systems contribute more than 50%
1
Inner Mongolia Key Laboratory of River and Lake Ecology, School of Ecology and Environment, Inner Mongolia
University, Hohhot, China. 2Key Laboratory of Mongolian Plateau Ecology and Resource Utilization Ministry
of Education, Hohhot, China. 3Department of Geography, National University of Singapore, Lower Kent Ridge
Road, Singapore, Singapore. 4Inner Mongolia Water Resource Protection and Utilization Key Laboratory, Water
Conservancy and Civil Engineering College, Inner Mongolia Agricultural University, Hohhot, China. *email: rhyu@
imu.edu.cn; txliu@imau.edu.cn
Scientific Reports | (2021) 11:2659 | https://doi.org/10.1038/s41598-021-81658-x 1
Vol.:(0123456789)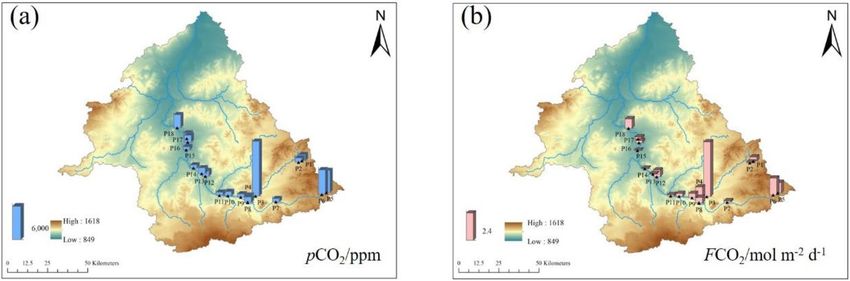
www.nature.com/scientificreports/
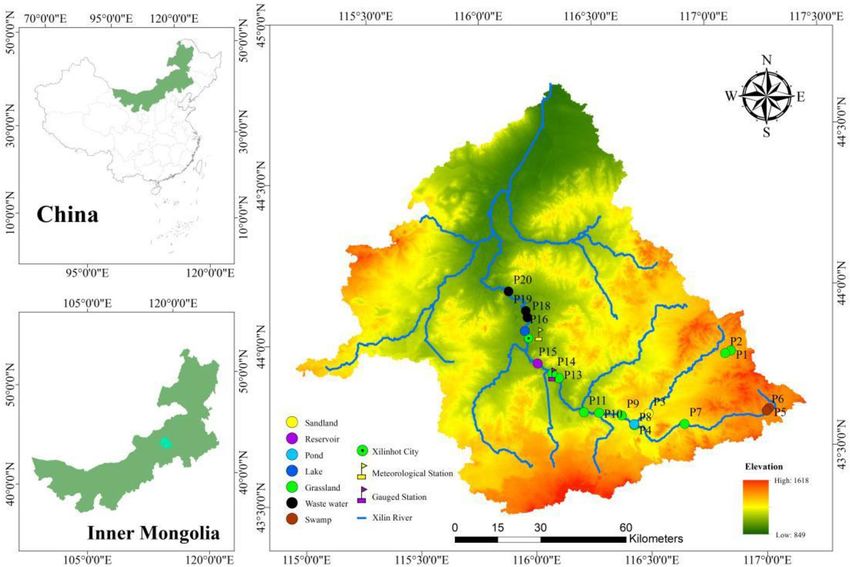
Figure 1. Xilin River Basin and sampling sites (generated by Arcgis10).
to atmospheric CH4, and global river N2O emissions have gradually exceeded 10% of human emissions11,12. The
greenhouse gas emissions of urban rivers are more significant compared with natural rivers. The N2O, CO2 and
CH4 escaping from rivers are mainly derived from microbial processes such as microbial degradation, acetic acid
fermentation, ammonia oxidation and the denitrification of s ediments13,14. As a reaction matrix, the increase in
soluble inorganic nitrogen and soluble organic carbon stimulates microbial activity in the aquatic environment
and promotes CO2, CH4 and N2O production15,16.
Inland waters (streams, rivers, lakes and reservoirs) have been gradually recognized as important sources
of greenhouse gas release into the a tmosphere17. Many regional studies on inland waters have proposed a spe-
cific focus on the emissions of C 2O18. However, only a few studies have assessed the three GHG
O2, CH4, and N
concentrations together in a river system. Most of the research on greenhouse gas emissions in grassland areas
has focused on soil systems but rarely on inland river systems19. The transverse carbon and nitrogen cycle of an
inland river is generated along with the direction of the river but disappears into the terrestrial cycle with the
river. The longitudinal cycle of carbon and nitrogen is exchanged by the water–air interface. Differently from a
fresh water river connecting the land and the ocean, the carbon and nitrogen cycle of an inland river does not
enter the ocean system but directly enters the land system in a short time.
The Xilin River basin is located in the inland river basin of arid and semiarid steppe areas. The Xilin River
is a seasonal river with a low network density, highly meandering and no obvious riverbed in the downstream,
and ends with a terminal lake. The grassland regions are affected by different degrees of human activities. The
greenhouse gas emissions of grassland rivers under the influence of different human activities have rarely been
studied and our study intended to understand the carbon emission mechanism of rivers in grassland region and
provide a reference for the greenhouse gas emissions of global grassland rivers. The specific purposes of this study
were to (1) explore the spatial and temporal variations of greenhouse gas emissions at the water–air interface;
(2) explore effects of land use on emissions of greenhouse gas and (3) analyze the effects of human activities on
emissions of greenhouse gas.
Materials and methods
Study sites. The Xilin River Basin is in the southeastern part of the Inner Mongolia Autonomous Region
in China (E115° 00′ ~ 117° 30′ and N43° 26′ ~ 44° 39′) (Fig. 1). It is located at the western extension of the lower
hills and hills of the greater Xingan mountains in the middle and eastern part of the Inner Mongolia plateau. In
the north, it is characterized by an alternating distribution of low mountains and hills and high plains, and in
the south, it is a multistage basalt platform. The middle area of these two terrains is mainly sandy dunes, and the
terrain gradually declines from the east to the west20. The Xilin River Basin covers an area of 10,542 km2, and
the average altitude is 988.5 m. The total length of the Xilin River is 268.1 km, with an average channel drop of
1.25%; however, it is cut off nearly 124.7 km below the Xilin R eservoir21. The Xilin River Basin is dominated by
grasslands, followed by swamps, sand land and urban l and22. The grassland area of the Xilin River Basin accounts
for 88.35% of the total drainage area, and the water area accounts for 0.37%. The climate type of the Xilin River
Scientific Reports | (2021) 11:2659 | https://doi.org/10.1038/s41598-021-81658-x 2
Vol:.(1234567890)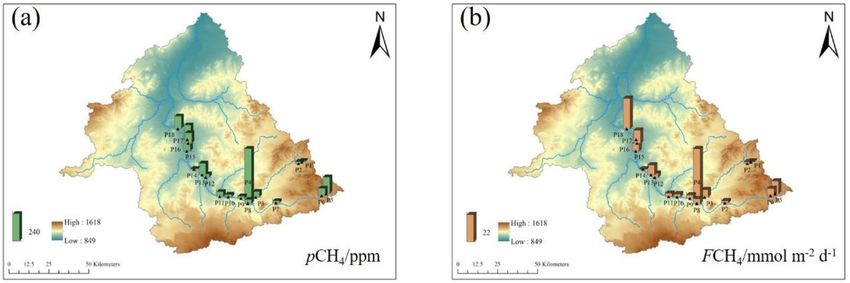
www.nature.com/scientificreports/
Basin is a temperate semiarid continental monsoon climate with climatic characteristics, for example, of less
precipitation, more evaporation and greater daily temperature difference. According to the meteorological data
of the Xilinhot Meteorological Station from 1968 to 2015, the annual average precipitation was 278.9 mm, the
annual average evaporation was 1862.9 mm, the annual average temperature was 2.8 °C, and the annual mean
wind speed was 3.4 m s−1.
Sampling procedures and analysis. This study conducted four rounds of field work in April, June,
August, and October in 2018. The design of the eighteen sampling points takes into account the changes of
land use types. Fourteen sites on the main stem and four sites on the tributary were selected for sampling and
measurement (Fig. 1, Table 1). The types of land use on the tributary mainly included grassland and sand land.
The upstream of the Xilin River is swamp. The Xilin River flows to the grassland section in the upper stream of
the Xilin River Reservoir. The downstream of the Xilin River flows through the artificial lake in Xilinhot City.
The collected water samples were subjected to low-pressure suction filtration through Whatman GF/F fil-
ters (nominal pore diameter of 0.7 μm). The fiber filter was prefired in a muffle furnace at 450 °C. pH, water
temperature (Tw), salinity (Sal), dissolved oxygen (DO), and total dissolved solids (TDS) were measured by a
portable water quality analyzer. pH and Tw were measured using a portable pH meter (WTW). Alkalinity (Alk)
was titrated with 0.1 mol L−1 hydrochloric acid (HCl) within 10 h after sampling. H CO3– represents 96% of the
10
alkalinity when the pH ranges from 7 to 10 . Alk was determined by on-site titration. Total nitrogen (TN) was
determined by the alkaline potassium persulfate digestion-UV spectrophotometric m ethod23, and total phos-
phorus (TP) was determined by the ammonium molybdate spectrophotometric method24. Flow velocity of water
(Vw) was measured using a doppler portable flow meter (DPL-LS10), and the flow discharge was calculated by
Vw, river width and depth.
GHGs measurement. pCO2, pCH4, and p N2O measurements. In this study, surface water pCO2 was calcu-
lated using the headspace equilibrium method. By using an 1100 mL conical flask, 800 mL of water was collected
to the depth of 10 cm below the water surface and the remaining volume of 300 mL was filled with ambient air.
The flask was immediately closed with a lid and vigorously shaken for 3 min to equilibrate the gas in the water
and air. The equilibrated gas was automatically injected into the calibrated Li-7000 gas analyzer. The Li-7000
CO2/H2O analyzer was connected to a computer interface that allowed pCO2 recording for two seconds. The
measurements at each site were repeated three times and the average was calculated (analytical error below 3%).
The original surface water pCO2 was finally calculated by using solubility constants for CO2 and the headspace
ratio10. After shaking the conical flask, the gas extracted from flask was injected into the vacuum cylinder (Labco
Exetainer). pCO2, pCH4, and pN2O in the water column were measured using a gas chromatograph.
pCO2 from the water was also calculated using the CO2SYS program25, which has been widely employed for
aquatic pCO2 calculations26,27. Tw, Alk and pH were essential data for such c alculation28.
The pCO2 calculated was slightly higher than the pCO2 measured directly by gas chromatography ( R2 = 0.90)
(Fig. 2). The reason for the higher calculated pCO2 value was due to the error generated from pH and Tw meas-
urements or the artificial error that occurred during the titration. The directly measured data could be used for
analysis and discussion.
Greenhouse gas emissions calculation. In this study, FCO2 was measured by the floating chamber method and
an Li-7000 C O2/H2O analyzer (Li-Cor, USA). The Li-7000 instrument was calibrated with standard CO2 gases
of 500 ppm and 1000 ppm before each measurement. FCH4 and FN2O were measured by the floating chamber
method. 60 mL of gas was taken from the floating chamber every three minutes; five samplings were taken and
injected into a vacuum cylinder.
The static chamber volume was 17.8 L, and the covered water area was 0.09 m2. The chamber was covered
with tinfoil to reduce the influence of sunlight. The temperature inside the chamber was measured with a ther-
mometer. At the beginning of each experiment, the chamber was placed in the air near the monitoring point.
The instrument automatically recorded the air C O2 concentration and ambient atmospheric pressure. When the
chamber was placed on the water surface, the analyzer recorded the C O2 concentration every two seconds, and
each measurement lasted for 6–10 min.
The greenhouse gas emissions from water were calculated using the following e quation29:
FGHG = (dpGHGs/dt)(V / RTS)
where dpGHG/dt is the slope of greenhouse gas change within the chamber (Pa d–1; converted from μatm min–1),
V is the chamber volume (17.8 L), R is the gas constant, T is chamber temperature (K), and S is the area of the
chamber covering the water surface (0.09 m2).
Results
Physical and chemical parameters variation of the Xilin River. During the sampling campaigns,
pH ranged from 6.90 to 9.10, and the seasonal variation of pH was not obvious (Fig. 3a). The average annual pH
was 8.20 but the spatial variation was significant. In the sand land area, the pH value was the lowest (7.12 ± 0.13).
The pH value from upstream to downstream showed an overall increase trend. The concentration of DO ranged
from 2.23 to 16.69 mg/L, and the average concentration of DO was 8.97 mg/L (Fig. 3b). The DO concentrations
of the seasonal and spatial variables showed significant differences. In the waste water, the DO value was the
highest in October and the lowest in June. The DO value in swamp and pond land use types were lower than
in the other areas. Tw varied from 0.30 to 31.90 °C at all sampling sites, the annual mean value was 15.40 °C,
Scientific Reports | (2021) 11:2659 | https://doi.org/10.1038/s41598-021-81658-x 3
Vol.:(0123456789)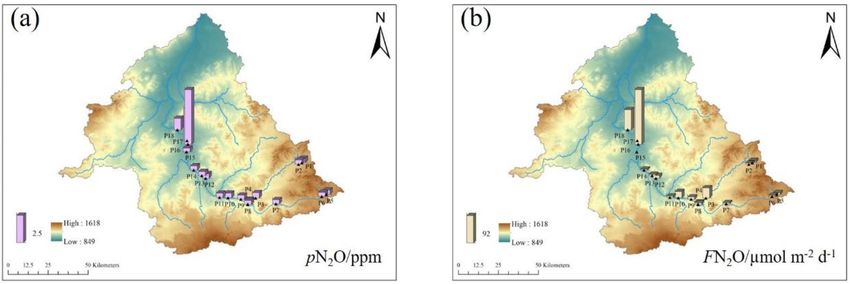
www.nature.com/scientificreports/

                                                                          Land use types       Sampling sites                Photos        Description

                                                                                                                                            Meadow
                                                                                           P5(N43°38′ E117°06′)
                                                                             Swamp                                                          swamp
                                                                                           P6(N43°37′ E117°04′)
                                                                                                                                            low marsh

                                                                                                                                            Mountain
                                                                            Sand land      P3(N43°39′ E116°33′)                              serious
                                                                                                                                          desertification

                                                                                           P1(N43°49′ E116°56′)

                                                                                           P2(N43°49′ E116°55′)

                                                                                           P7(N43°37′ E116°42′)

                                                                                           P8(N43°38′ E116°29′)
                                                                                                                                             Typical
                                                                            Grassland      P9(N43°40′ E116°26′)
                                                                                                                                            grassland
                                                                                           P10(N43°41′ E116°20′)

                                                                                           P11(N43°41′E116°16′)

                                                                                           P12(N43°48′ E116°10′)

                                                                                           P13(N43°49′ E116°09′)

                                                                                                                                          Wolongquan
                                                                              Pond         P4(N43°38′ E116°29′)
                                                                                                                                          pond outflow

                                                                                                                                           Xilin River
                                                                            Reservoir      P14(N43°51′ E116°05′)
                                                                                                                                            reservoir

                                                                              Lake         P15(N43°57′ E116°03′)                          Artificial lake

                                                                                           P16(N44°01′ E116°04′)
                                                                                                                                           Around the
                                                                           Waste water     P17(N44°00′ E116°04′)
                                                                                                                                            factory
                                                                                           P18(N44°05′ E116°00′)

                                            Table 1.  Sampling sites classified by land use type. *These pictures were taken by myself.

          Scientific Reports |   (2021) 11:2659 |                https://doi.org/10.1038/s41598-021-81658-x                                                 4

Vol:.(1234567890)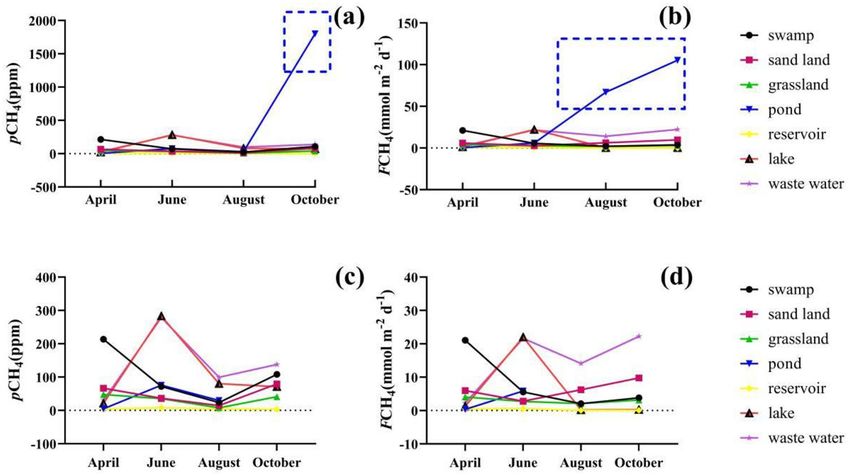
www.nature.com/scientificreports/
Figure 2. Comparison of the results of river pCO2 at all sampling sites on the Xilin River by the measured and
calculated methods.
Figure 3. Box plot showing seasonal and spatial variation under different land use variations in six parameters
of water quality(pH (a), DO (b), Tw (c), Alk (d), TDS (e), Sal (f), TN (g), TP (h), Vw (i), Q (j)).
and the seasonal variation of T w was significant (P < 0.05); however, there was no significant difference in spatial
distribution (P > 0.05) (Fig. 3c).
The Alk concentration ranged from 1.15 to 14.01 mg/L, and the average Alk concentration was 4.93 mg/L
(Fig. 3d). There was no significant seasonal difference in Alk. The average value of four months was 4.31 mg/L
in April, 6.04 mg/L in June, 4.91 mg/L in August, and 5.83 mg/L in October. Alk had a significant spatial change,
and the Alk gradually increased from the upper reaches to the downstream. The variable range of TDS concen-
tration was 147.00–2580.00 mg/L, and the average value was 782.00 mg/L (Fig. 3e). The seasonal variation was
not significant (P > 0.05), but the spatial change was significant, with a significant increase trend from upstream
to downstream (P < 0.05). Sal ranged from 0.00 to 1.30, with an average of 0.31 (Fig. 3f). From the upper reaches
to the lower reaches, there was a significant increase.
TN ranged from 1.81 to 57.70 mg/L, with an average value of 10.86 mg/L (Fig. 3g). Similarly, there was a sig-
nificant increase from the upper reaches to the lower reaches. TP ranged from 0.00 to 2.52 mg/L, and the average
value was 0.45 mg/L (Fig. 3h). In the waste water, the TP concentration was higher than others. The variable range
Scientific Reports | (2021) 11:2659 | https://doi.org/10.1038/s41598-021-81658-x 5
Vol.:(0123456789)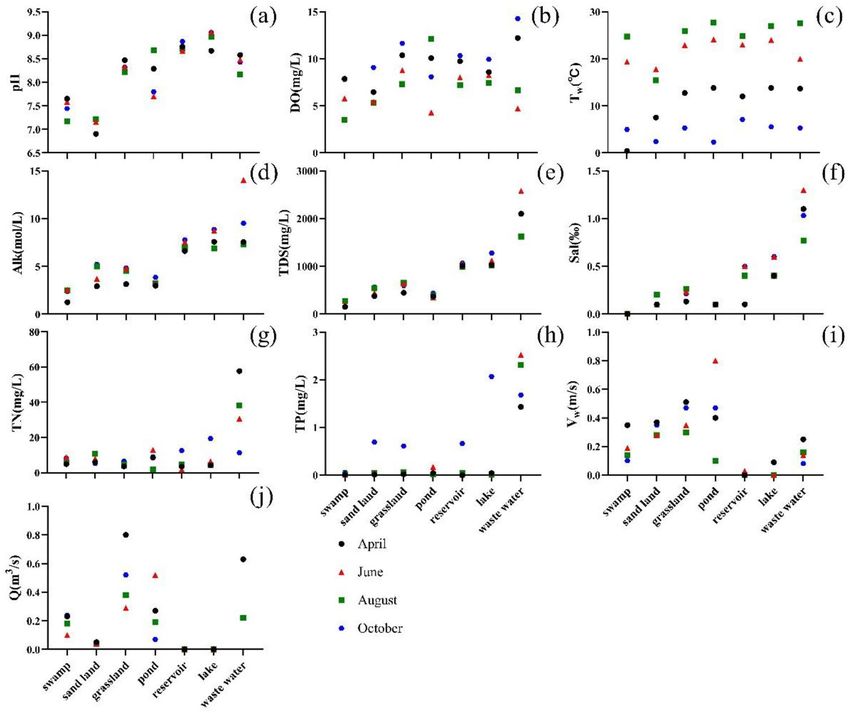
www.nature.com/scientificreports/
Figure 4. Temporal variation of pCO2 (a) and FCO2 (b) in the Xilin River in 2018.
of Vw was 0.00–1.20 m/s (Fig. 3i). In the upstream, the V w value was higher than that in the downstream. The Q
3/s (Fig. 3j). In the grassland, the Q was higher than that in other land use types.
value ranged from 0.00 to 0.80 m
Seasonal variation of greenhouse gas emissions. CO2. The range of pCO2 varied from 442.54 to
13,056.85 ppm, with a four-month average of 2230.65 ppm, which was almost five times that in air (the average
in the air was 402.00 ppm) (Fig. 4). To better display the spatial variation of pCO2, Fig. 4 shows the variation
of pCO2 along the river. The highest value of pCO2 appeared in sand land (11,937.33 ± 1,017.37 ppm), followed
by swamp (5,089.54 ± 2,397.81 ppm), wastewater (2,048.93 ± 660.43 ppm), and pond (1,486.46 ± 673.71 ppm)
land uses. pCO2 in grassland, reservoir, and lake types were normally below 1000 ppm. Under different land
use types, pCO2 showed different seasonal characteristics. In the swamp, grassland, and wastewater, pCO2
had the highest value in August. At all sampling sites, the average pCO2 was 1,991.77 ± 2,890.53 ppm in April,
2,247.53 ± 2,882.77 ppm in June, 2,991.71 ± 3,587.52 ppm in August, and 1,872.35 ± 2,299.81 ppm in October.
The range of FCO2 varied from 0.00 to 6.09 mol m−2 d−1, and the four-month average was 0.70 mol m−2 d−1.
Figure 4 shows the spatial change of FCO2 under different land use types. The highest value of FCO2 appeared in
sand land (4.88 ± 0.73 mol m−2 d−1), followed by pond (1.39 ± 1.98 mol m−2 d−1), swamp (1.22 ± 0.92 mol m−2 d−1),
waste water (0.41 ± 0.35 mol m−2 d−1) and grassland (0.28 ± 0.16 mol m−2 d−1); the values of FCO2 in reservoir and
lake types were within 0.02. Under the different land use types, FCO2 showed different seasonal changes. FCO2
and pCO2 showed different trends, and in sand land, swamp and grassland, the FCO2 value was highest in June.
Due to the shortage of water in June, FCO2 could not be measured in the factory area. For all sampling points, the
average value of FCO2 was 0.52 ± 1.06 mol m−2 d−1 in April, 1.42 ± 1.86 mol m−2 d−1 in June, 0.63 ± 1.09 mol m−2
d−1 in August, and 0.37 ± 0.95 mol m−2 d−1 in October.
The pCO2 and FCO2 values of grassland were at a low level and were only higher than those of the Xilin River
Reservoir and the Xilinhot artificial lake. The pCO2 and FCO2 values of sand land were at a high level.
CH4. The range of pCH4 varied from 2.92 to 1,800.73 ppm, with average value of 81.55 ppm. The highest
value of pCH4 appeared in the pond (477.83 ± 764.20 ppm), which was much higher than the atmospheric
background value, followed by waste water (136.52 ± 90.50 ppm), lake (113.86 ± 100.40 ppm), and swamp
(104.26 ± 69.88 ppm), and in the remaining region pCH4 values were within 50 ppm (Fig. 5a). Under different
land use types, pCH4 value showed different seasonal changes. Except for the abnormal pCH4 value of ponds in
October, the value of pCH4 in June was highest affected by human activities. However, areas such as swamp, sand
land, and grassland, had higher CH4 values in April.
The range of FCH4 was 0.06 to 105.19 mmol m−2 d−1, and the average value was 7.76 mmol m−2 d−1(Fig. 5b).
The value of FCH4 was largest in the pond. There was no significant difference in the FCH4 values. Under differ-
ent land use types, there were no significant seasonal differences in FCH4.
N2O. The variation range of pN2O was 0.31–12.44 ppm, the mean value was 0.73 ppm (Fig. 6). In the factory
area, the pN2O value was abnormal, and the pN2O values in April and October were higher than those in June
and August. There were no obvious differences in pN2O in other areas.
The range of FN2O values was − 12.60 to 224.04 μmol m−2 d−1, and the average value was 24.32 μmol m−2 d−1.
There was an** obvious spatial change in FN2O. The FN2O value of the factory area was largest, followed by sand
land and grassland, yet the values of FN2O in the lake area was negative.
Spatial variation of greenhouse gas emissions. CO2. On the main stream, the pCO2 values from
upstream to downstream first decreased and then increased; they reached the lowest value in the middle stream
(Fig. 7). The middle part of the tributaries was cut off, and the pCO2 value was higher at the source of the river.
The spatial tendency of FCO2 value was the same as that of pCO2.
CH4. On the main stream of the Xilin River, from the upstream to the downstream, the pCH4 value was higher
in the river source area and increased with the flow direction of the river (Fig. 8). The value of pCH4 gradually
increased in tributaries. The variation trend of FCH4 value was not obvious, and it had the lowest and negative
value in the downstream of the main stream.
Scientific Reports | (2021) 11:2659 | https://doi.org/10.1038/s41598-021-81658-x 6
Vol:.(1234567890)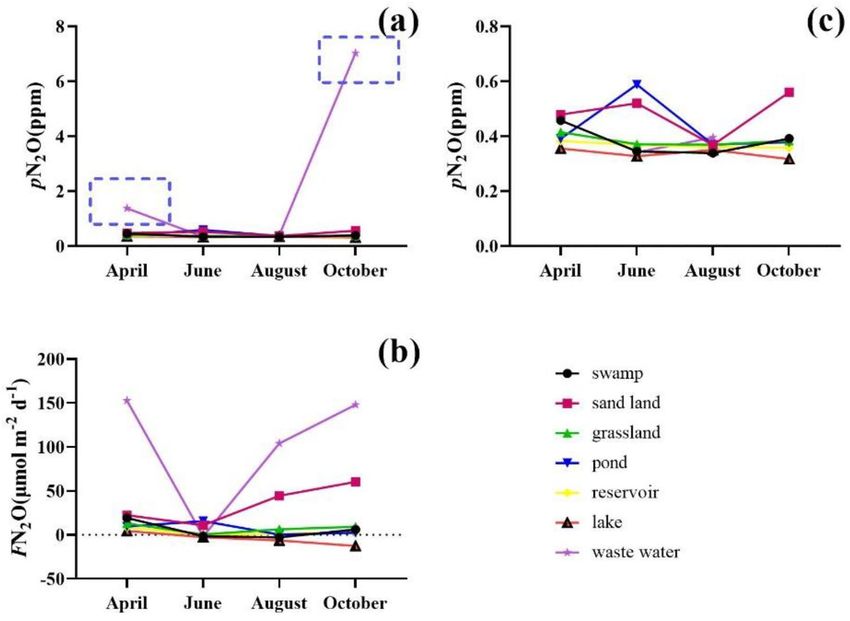
www.nature.com/scientificreports/
Figure 5. Temporal variation of pCH4 (a) and FCH4 (b) in the Xilin River in 2018 (pCH4 (c) and FCH4 (d)
except those points in the blue dotted box).
Figure 6. Temporal variation of pN2O (a) and FN2O (b) in the Xilin River in 2018 (pN2O (c) except those
points in the blue dotted box).
N2O. The value of pN2O did not change in the tributaries but first remained stable and then increased from the
upstream to the downstream of the main stream (Fig. 9). The value of FN2O fluctuated near zero and increased
in the downstream area.
The global warming potential of C H4 is 25 times larger than that of C
O2, and the global warming potential
of N2O is 296 times larger than that of CO230. For the hydrosystem of the Xilin River Basin, CO2 emissions
accounted for 63.35% of the three GHG emissions, whereas C H4 and N2O emissions accounted for 35.98% and
0.66%, respectively.
In the swamp area, CO2 emissions accounted for 20.88% of the emissions of the Xilin river, and CH4 accounted
for 6.14% (Table 2). In sand land, CO2 emissions accounted for 8.03% of the emission in the Xilin river, and CH4
and N2O emissions accounted for 0.45% and 0.02%, respectively. In the pond type, C O2 emissions accounted
Scientific Reports | (2021) 11:2659 | https://doi.org/10.1038/s41598-021-81658-x 7
Vol.:(0123456789)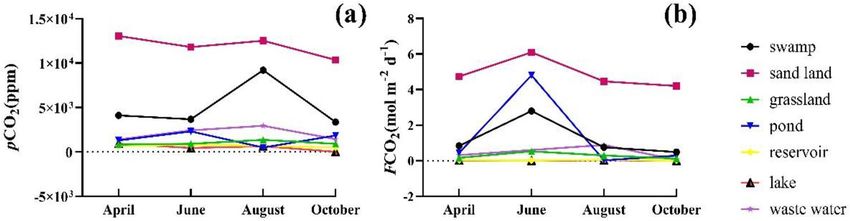
www.nature.com/scientificreports/
Figure 7. Spatial variation of pCO2 (a) and FCO2 (b) in the Xilin River in 2018 (generate by Arcgis 10).
Figure 8. Spatial variation of pCH4(a) and FCH4(b) in the Xilin River in 2018 (generate by Arcgis 10).
Figure 9. Spatial variation of pN2O (a) and FN2O (b) in the Xilin River in 2018 (generate by Arcgis 10).
for 9.52% in the Xilin river, and C
H4 and N
2O emissions accounted for 13.46% and 0.01%, respectively. In waste
water, CO2 emissions accounted for 7.08% of the Xilin river, and CH4 emission accounted for 10.38%. The
hydrosystem of the Xilin River Basin showed as a source of carbon dioxide and methane; at the same time, the
nitrous oxide in the lake region showed as a sink.
Discussion
Impacts of water quality parameters on GHG. Pearson’s correlation analysis was used to analyze the
correlation between eight water chemical factors with pGHG and FGHG (Fig. 10).
The main influencing factors of pCO2 were pH and DO, and pCO2 was negatively correlated with Alk, Tw, Sal,
TDS, pH and DO. There was a significant negative correlation with pH (R = − 0.804, P < 0.01) and DO (R = − 0.505,
P < 0.01). pCO2 was positively correlated with TN, TP and V w. The main influence factors of FCO2 and pCO2
were the same; however, the flow velocity ( Vw) had positive correlation with FCO2, Q (R = − 0.274, P < 0.05) had
Scientific Reports | (2021) 11:2659 | https://doi.org/10.1038/s41598-021-81658-x 8
Vol:.(1234567890)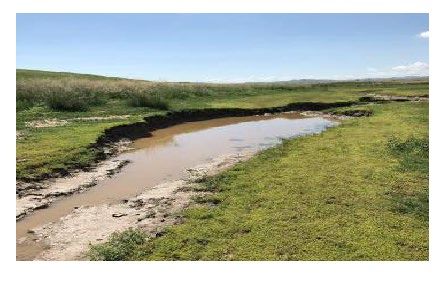
www.nature.com/scientificreports/
FCO2 (kg a−1) % FCH4 (kg a −1) % FN2O (g a −1) % GHG-CO2-eq (t a −1)
Swamp 542.65 20.88 1.32 6.14 2.34 0.02 0.63
sand land 208.57 8.03 0.10 0.45 1.48 0.02 0.22
grassland 1233.25 47.46 4.87 22.69 33.36 0.31 1.58
Pond 247.43 9.52 2.89 13.46 1.24 0.01 0.45
reservoir 108.07 4.16 0.44 2.07 13.95 0.13 0.14
Lake 74.65 2.87 9.62 44.82 − 19.23 – 0.73
waste water 183.91 7.08 2.23 10.38 54.06 0.51 0.35
Total 2598.55 63.35 21.47 35.98 106.43 0.66 4.10
Table 2. Emissions of greenhouse gas in the Xilin river under different land use types.
Figure 10. Relationship between pGHG and water quality parameters.
Scientific Reports | (2021) 11:2659 | https://doi.org/10.1038/s41598-021-81658-x 9
Vol.:(0123456789)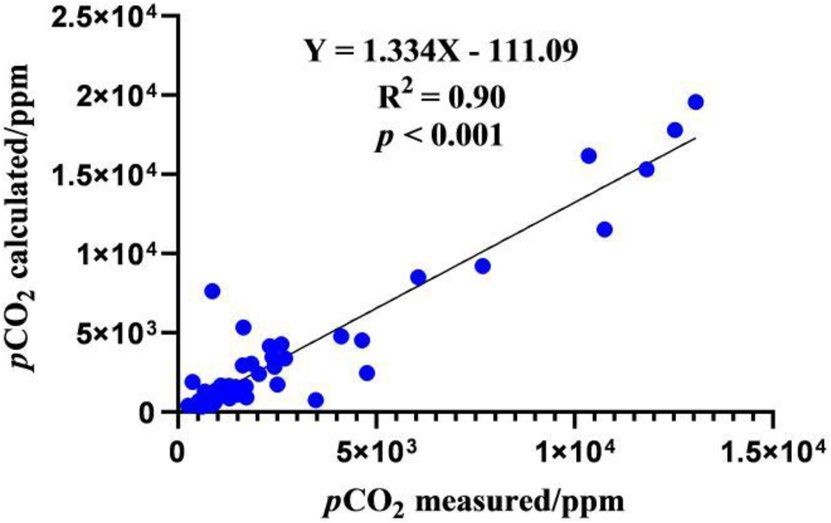
www.nature.com/scientificreports/
a significant negative correlation with FCO2. pCH4 had a significant correlation with TP (R = 0.365, P < 0.01).
FCH4 had no significant correlation with all factors. The main influencing factors of pN2O were DO (R = 0.429,
P < 0.01) and TP (R = 0.437, P < 0.01). pN2O was negatively correlated with Tw. There was a positive correlation of
FN2O with below factors: the most important were with Sal (R = 0.661, P < 0.01), Alk (R = 0.374, P < 0.01), TDS
(R = 0.639, P < 0.01), TP (R = 0.696, P < 0.01), TN (R = 0.589, P < 0.01) and DO (R = 0.361, P < 0.01), which had a
significant positive correlation with FN2O.
Previous studies have shown that water temperature is one of the factors that affect river pCO2 and FCO2
because the solubility of C O2 decreases with the rise of temperature; this has been found in many river studies
around the world31,32. Other studies have also found that the photosynthesis of plankton has a great influence on
the changes of pCO2 and FCO2 in r ivers33. In this study, the water temperatures in June and August are higher
than in April and October, and the values of pCO2 in June and August are higher than in April and October.
The temperature directly influences the production of methane by influencing the activity and structure
of microflora34. In our study that temperature has no significant correlation with CH4. When the temperature
rises, the dissolved oxygen concentration in the water decreases, which is more conducive to the production
of methane. However, the concentration of methane in the Xilin River decreases with increasing temperature,
which may be due to the significant increase in the activity of oxidizing bacteria in methane due to the increase
in temperature, thus resulting in an increase in methane consumption.
Because of the strong correlation between flow rate and velocity, river sections with large flow rate usually
have higher flow velocity. Higher velocity helps to increase the degree of surface turbulence and fragmenta-
tion, increase the area of contact between water and air, and accelerate the gas exchange rate at the water–air
interface35. The flow velocity ranges from 0 to 1.2 m s−1 at all sampling points, which is a very low level, but the
amount of carbon dioxide released from the Xilin River is considerable. Because of the large amount of carbon in
the environment around the channel, it can be washed into the river network system by runoff or groundwater9,36.
The total alkalinity of the Xilin River is low, and there is less plankton in the water, which indicates that the
river carbon dioxide mainly comes from terrestrial organic carbon rather than inorganic carbon. A large part of
terrestrial organic carbon comes from net primary productivity.
The influence of nutrient on river C O2 affects the production and consumption of in situ C O2 in the river
mainly through changing the balance of primary production and ecosystem r espiration36,37. The Xilin River is
a low-pollution region. Studies have shown that the increase of nutrient salt mainly promotes the growth of
phytoplankton in the water, enhances photosynthesis, and then reduces the concentration of C O2 in the water
due to carbon restriction in low-pollution rivers38.
Influence of land use on GHG. The pCO2 value (> 10,000 ppm) in sand land is much higher than that
of other land use types (< 10,000 ppm) due to groundwater recharge which had high CO2 content39 In large
river systems, the pCO2 value in the groundwater system is approximately ten times higher than that in the
surface water system. Except for the areas affected by human activities, the river alkalinity in sand land areas
is the largest40. A large amount of carbon ions (HCO3-, CO32-) and dissolved CO2 is released from groundwa-
ter recharge surface water under the action of photosynthesis and w eathering41. The carbon ion reaction in
surface water is released into the atmosphere, the variation range of subsurface temperature is small, and the
dissolved CO2 exists stably in groundwater. However, after the groundwater recharge surface water is exposed
to the river, the temperature in the atmosphere changes greatly, and the solubility of C O2 varies with the change
of temperature35.
The Xilin River source area is a swamp area, and groundwater is one of the sources of river runoff in swamp
area and is rich in dissolved carbon dioxide; a small amount of groundwater recharge thus also provides suf-
ficient carbon dioxide for river water39. At the same time, the bog type in the Xilin River source area is low-lying
bog, the initial stage of bog development with a low-lying surface, which often becomes the place where surface
runoff and groundwater collect and pool. Water supply is mainly groundwater, and there are many minerals and
nutrients in the water. The pH of water and peat is acidic to neutral. The results of the Xilin River source area
are the same as the report where pCO2 was much higher than the downstream w ater42. The C
H4 of swamp in
the Xilin River is 8.14 mmol m d , which is higher than the CH4 value of the Tibetan Plateau (4.19 mmol m−2
−2 −1
d−1)43. In the study of C H4 emissions of the Yukon River basin, both main stream and tributary showed that the
upstream concentration of C H4 was lower than that of the midstream and d ownstream38,44. The emissions of
CH4 from Xilin River also showed a similar distribution pattern.
In the Xilin River, the vegetation coverage in grassland is relatively high, similar to that in swamp. Carbon
dioxide release from swamps coincides with the growth cycle of plants, and terrestrial organic carbon related to
plants is thus one of the important sources of carbon dioxide in river water b odies17. Because of the low carbon
density in the soil carbon pool, the soil carbon pool provides less carbon to the river carbon pool than the swamp.
There are relatively few inundated-vegetation areas in grassland, and aquatic vegetation thus provides less organic
carbon to rivers. On the other hand, the altitude of grassland cover areas is low, the water level of groundwater in
mountain bodies is higher, and groundwater also acts as the source of river r unoff45. The net primary productiv-
ity of the Xilin River Basin begins in April and reaches its peak in August, and the average annual net primary
productivity from 1926 to 2017 is 185.38 gC m −2 a−1; to some extent, this shows that there is a strong relationship
between river carbon and net primary productivity in the Xilin River Basin, and a part of the carbon dioxide in
the river is provided by plant carbon. In the Xilin River Basin, the C H4 emission of grassland is 31.25 μmol m−2
d−1, and the C H4 emission of rivers is approximately 100 times that of grassland46.
Influence of human activities on GHG. The CH4 of river water is mainly produced by methanogens in
sedimentary layers after a series of fermentation processes in the anaerobic environment with acetate or CO2/H2
Scientific Reports | (2021) 11:2659 | https://doi.org/10.1038/s41598-021-81658-x 10
Vol:.(1234567890)www.nature.com/scientificreports/
Description River Sites FCO2 (mol m
−2 d−1) FCH4 (mmol m
−2 d−1) FN2O (μmol m
−2 d−1) References
Inland water – African 0.18–1.15 0.5–18.0 2.0–16.0 Borges et al.17
Wuding River China 0.02–0.98 – – Ran et al.56
River Daning River China 0.33 ± 0.47 – – Ni et al.57
Xilin River China 0.00–6.09 0.06–105.19 − 12.60–224.04 This study
Phragmites marsh China 0.01–1.83 0.48–9.60 – Olsson et al.58
Swamp Saltmarsh Alabama − 0.06 to − 0.03 0.00–6.00 – Wilson et al.59
Xilin River China 0.13–3.36 1.88–30.38 − 3.05 to 25.62 This study
Crab-fish China – 0.11 – Hu et al. (2016)
Pond Min River China 0.01 129.06 – Yang et al.29
Xilin River China 0.02–4.81 0.34–105.19 0.22–15.65 This study
Three Gorges China 0.09–0.17 0.03–0.57 – Zhao et al.60
Reservoir Shasta America 0.03 0.69 – Soumis et al.53
Xilin River China 0.00–0.05 0.06–0.56 0.17–8.34 This study
Table 3. Comparison of GHG emissions from river to atmosphere.
as a substrate34. An increase in temperature would stimulate the activity of soil/sediment methanogenic bacteria
as well as promote a higher rate of organic matter degradation, which in turn would provide more substrates for
methanogens to produce C H447,48. The small Pond (Wolongquan) is mainly used for raising fish. Because of the
large amount of breeding and artificial feed, it contains a large number of nutrients, which promotes the repro-
duction and growth of algae49. The growth process of plankton produces a large amount of fresh organic carbon,
which stimulates the production of CH4. The proliferation of planktonic plants and animals leads to the reduc-
tion of oxygen concentration in the deep water layer, which creates an anaerobic environment for the produc-
tion of C H4 and reduces C H4 oxidation50. The dissolved oxygen value is very low, which promotes the growth of
anaerobes, and the river is in a eutrophication state, which produces more C H4 under the anoxic c onditions51,52.
The pCO2 value of the Xilin Reservoir is 670.15 ± 114.48 ppm, which is higher than the background value of
atmospheric carbon dioxide, and its FCO2 value (0.02 ± 0.02 mol m−2 d−1) is similar to that of an artificial lake.
The construction of a reservoir changes the biogeochemical cycle of carbon and nitrogen in the basin; the flow
rate slows down after the river enters the reservoir, which causes the deposition of plankton debris and other
granular organic matter in the water. These changes will affect the production and release of greenhouse gas.
Compared with rivers, reservoirs have longer hydraulic retention times, which is conducive to the accumulation
of pollutants53. Phytoplankton debris, that is, endogenous organic matter, provides a rich source of easily degra-
dable carbon for the accumulation of organic matter at the bottom of the reservoir and enhances the anaerobic
conditions at the bottom of the reservoir, which thus provides a material basis and environmental conditions
for the production of CH4. The flow velocity of water in the Xilin Reservoir is approximately zero, and there is
no large fluctuation.
The Xilin River flows through an artificial lake in Xilinhot City, but the River flows intermittently to its
downstream because of the impoundage of the Xilin Reservoir. The discharge amount of water in the Xilin Res-
ervoir to the downstream is very small, which has little impact on pCO2 in the downstream. The artificial lake
in Xilinhot City is composed of river water and reclaimed water. The artificial lake flow rate is close to zero, and
its water–gas interface gas release rate is extremely low, and the FCO2 value is 0.02 ± 0.01 mol m−2 d−1. There is
no obvious plankton in the lake, and reeds grow around the artificial lake. The pCO2 value in the artificial lake
is higher than that in the a tmosphere54. The CO2 produced by the respiration of aquatic plants inside the water
body is basically the same as the CO2 fixed by the photosynthesis of aquatic plants.
The lower reaches of the Xilin River are located in the factory area and are greatly influenced by human activi-
ties, mainly by power stations and dairy farms; the power station extracts groundwater for production opera-
tions. After secondary treatment, sewage is discharged into the river and mixed with the Xilin River. The water
discharged from the dairy farms also contains a large number of microorganisms, and the river contains a large
number of organic substances as well as nitrogen and phosphorus compounds, which makes algae and micro-
organisms grow and reproduce; a large number of them exist in the river and promote river oxygen metabolism.
The respiration of algae and microorganisms releases a small amount of carbon dioxide but microorganisms
produce more C O2 and CH4 in the absence of oxygen34. The values of pCO2 (2,048.93 ± 660.43 ppm) and FCO2
(0.41 ± 0.74 mol m−2 d−1) in factory areas are higher than in other areas affected by human activities. The value of
N2O in the factory area is higher, and the total nitrogen and total phosphorus in the river are positively correlated
with the concentration of N2O55. The sewage discharged from the factory contains a large amount of nutrients,
which makes the microbial activity produce a large amount of CH4 and N 2O. With the discharge of sewage into
the channel, the release of CH4 and N2O in the channel and downstream of the channel is indirectly affected17.
Comparison with other rivers. Our estimated results for CO2 emissions in the Xilin River were greater
than in most of the reported rivers, such as the Wuding River56, the Daning River57, and inland water in Africa17
(Table 3). The emissions of CH4 and N2O in the Xilin River were higher than the inland water in Africa. Because
there are many land types in the Xilin River, the range of greenhouse gas emissions was larger than that of other
rivers at home and abroad.
Scientific Reports | (2021) 11:2659 | https://doi.org/10.1038/s41598-021-81658-x 11
Vol.:(0123456789)www.nature.com/scientificreports/
The carbon dioxide emissions from the swamp of the Xilin River were close to those of the Phragmites marsh,
but the methane emissions were higher than those from the Phragmites marsh. Additionally, saltmarshes are
sinks of carbon dioxide, and the values of methane emissions were between those of swamp and Phragmites
marsh58,59. Due to the lower height of grassland vegetation, photosynthesis is stronger. The type of plant in the
marsh area affects greenhouse gas emissions of water.
Carbon dioxide emissions were lower for the Min River than for the Xilin River, but the methane emissions
of the Min River were higher than those of the Xilin River. The emissions of C H4 of Min river was higher than
the Xilin river, because the drainage of the Wolongquan pond was lower than the Min river. The drainage of the
Min river significantly enhance CH4 emissions29. The Wolongquan pond of the Xilin River is mainly used for
farming fish with great artificial intervention, which proves that the addition of nutrients has a great influence
on the greenhouse gas emissions of water bodies.
In the Xilin river reservoir, the emissions of CO2 and CH4 were equal to the Three Gorges and Shasta
reservoir53,60. For reservoir, the flow velocity of surface water is slow, which causes the emissions of greenhouse
were less. And the deep water created well-oxygenated conditions, resulting in lower methane emissions.
Conclusions
In this study we estimated emissions of greenhouse gas from the Xilin River, which is characterized by different
land-use types and various degrees of human impacts. The results showed that the hydrological drainage network
of the Xilin River was oversaturated in GHG (CO2, CH4 and N 2O) with respect to the atmospheric concentrations.
For the hydrosystem of the Xilin River Basin, C O2 emissions accounted for 63.35% of the three GHG emissions,
whereas CH4 and N2O emissions accounted for 35.98% and 0.66%, respectively. GHG emissions from the Xilin
river were dominated by CO2 emissions and were interpreted as being supplied by terrestrial carbon transpor-
tation and groundwater replenishment and by wastewater discharges. In future work, sampling should cover
more sites with a greater frequency to better quantify the magnitude of CO2, CH4 and N2O emissions at diurnal
and monthly scales before upscaling them to annual estimates. Comparing the differences in greenhouse gas
emissions after the cut-off, it is possible to predict the total greenhouse gas emissions after global river drying.
Received: 26 October 2020; Accepted: 30 December 2020
References
1. Arnell, N. W. & Reynard, N. S. The effects of climate change due to global warming on river flows in Great Britain. J. Hydrol. 183,
397–424 (1996).
2. Richey, J. E., Devol, A. H., Wofsy, S. C. & Victoria, R. Biogenic gases and the oxidation and reduction of carbon in Amazon River
and floodplain waters. Limnol. Oceanogr. 33, 551–561 (1988).
3. Lingli, L. & Greaver, T. L. A review of nitrogen enrichment effects on three biogenic GHGs: the CO2 sink may be largely offset by
stimulated N2O and CH4 emission. Ecol. Lett. 12, 1103–1117 (2010).
4. Solomon, S. et al. Climate Change 2007: Synthesis Report. Contribution of Working Group I, II and III to the Fourth Assessment
Report of the Intergovernmental Panel on Climate Change. Summary for Policymakers (2007).
5. Zhan, M. A., Hai, L. I., Yue, B., Gao, Q. X. & Dong, L. Study on emission characteristics and correlation of GHGs CH4 and CO2 in
MSW landfill cover layer. J. Environ. Eng. Technol. 5, 399–405 (2014).
6. Wang, G. et al. Nitrogen removal rates in a frigid high-altitude river estimated by measuring dissolved N 2 and N2O. Sci. Total
Environ. 645, 318–328 (2018).
7. Marx, A. et al. A review of C O2 and associated carbon dynamics in headwater streams: a global perspective. Rev. Geophys. 55,
560–585 (2017).
8. Cao, Y., Yuan, R., Jiao, S., Zhang, Q. & Deng, F. Distribution characteristics of partial pressure of carbon dioxide during thermal
stratification in summer in Guangzhao Reservoir. Environ. Sci. Technol. 6, 15–21 (2018).
9. Yao, G. et al. Dynamics of C O2 partial pressure and C
O2 outgassing in the lower reaches of the Xijiang River, a subtropical monsoon
river in China. Sci. Total Environ. 376, 255–266 (2007).
10. Ran, L. et al. Long-term spatial and temporal variation of CO2 partial pressure in the Yellow River China. Biogeosciences 12, 921–932
(2015).
11. Beaulieu, J. J. et al. Nitrous oxide emission from denitrification in stream and river networks. Proc. Natl. Acad. Sci. USA 108,
214–219 (2011).
12. Khalil, M. A. K. & Rasmussen, R. A. Sources, sinks, and seasonal cycles of atmospheric methane. J. Geophys. Res. Oceans 88,
5131–5144 (1983).
13. Algesten, G. et al. Contribution of sediment respiration to summer CO2 emission from low productive boreal and subarctic lakes.
Microb. Ecol. 50, 529–535 (2005).
14. Beaulieu, J., Arango, C., Hamilton, S. K. & Tank, J. L. The production and emission of nitrous oxide from headwater streams in
the Midwestern United States. Glob. Change Biol. 14, 878–894 (2010).
15. Garnier, J., Billen, G. & Cébron, A. Modelling nitrogen transformations in the lower Seine river and estuary (France): impact of
wastewater release on oxygenation and N 2O emission. Hydrobiologia 588, 291–302 (2007).
16. Yang, H., Zheng, Y. F., Rong-Jun, W. U., Yin, J. F. & Xia, S. Nitrous oxide flux at the water–air interface of the rivers in Nanjing
during summer. Huan jing ke xue Huanjing kexue 35, 348–355 (2014).
17. Borges, A. V. et al. Globally significant greenhouse-gas emissions from African inland waters. Nat. Geosci. 8, 637–642 (2015).
18. Thi Phuong Quynh, L. et al. CO2 partial pressure and CO2 emission along the lower Red River (Vietnam). Biogeosciences 15,
4799–4814 (2018).
19. Lauerwald, R., Hartmann, J., Ludwig, W. & Moosdorf, N. Assessing the nonconservative fluvial fluxes of dissolved organic carbon
in North America. J. Geophys. Res. Biogeosci, 117, G01027 (2012).
20. Xue, L. Y., Wu, J. K., Zhang, M. Q., Ding, Y. J. & Ye, B. S. Spatial and temporal distribution of trace elements in surface water in the
Xilin River Basin. Environ. Sci. 33, 3417–3425 (2012).
21. Lu, J. et al. Dissolved inorganic carbon (DIC) contents in middle and lower reaches of Lancang River: related to water environments
and dams. J. Water Resour. Prot. 09, 1132–1144 (2017).
22. Chen, S. P., Bai, Y. F., Lin, G. H., Liang, Y. & Han, X. G. Effects of grazing on photosynthetic characteristics of major steppe species
in the Xilin River Basin, Inner Mongolia China. Photosynthetica 43, 559–565 (2005).
Scientific Reports | (2021) 11:2659 | https://doi.org/10.1038/s41598-021-81658-x 12
Vol:.(1234567890)www.nature.com/scientificreports/
23. Wei, Z., Wu, S., Zhou, S. & Chen, L. Installation of impervious surface in urban areas affects microbial biomass, activity (potential
C mineralisation), and functional diversity of the fine earth. Soil Res. 51, 59–67 (2013).
24. Wu, Y., Hu, Z., Yang, L., Graham, B. & Kerr, P. G. The removal of nutrients from non-point source wastewater by a hybrid bioreac-
tor. Bioresour. Technol. 102, 2419–2426 (2011).
25. Lewis, E., Wallace, D. & Allison, L. J. Program developed for CO2 system calculations. Office of Scientific & Technical Information
Technical Reports (1998).
26. Penman, D. E., Hoenisch, B. R., Rasbury, E. T., Hemming, N. G. & Spero, H. J. Boron, carbon, and oxygen isotopic composition
of brachiopod shells: intra-shell variability, controls, and potential as a paleo-pH recorder. Chem. Geol. 340, 32–39 (2013).
27. Tortell, P. D., Bittig, H. C., Körtzinger, A., Jones, E. M. & Hoppema, M. 1 Biological and physical controls on N2, O2 and C O2
distributions in 2 contrasting Southern Ocean surface waters. Glob. Biogeochem. Cycles 29, 994–1013 (2015).
28. Li, Z. et al. Soil–air greenhouse gas fluxes influenced by farming practices in reservoir drawdown area: a case at the Three Gorges
Reservoir in China. J. Environ. Manag. 181, 64–73 (2016).
29. Yang, P. et al. Fluxes of carbon dioxide and methane across the water-atmosphere interface of aquaculture shrimp ponds in two
subtropical estuaries: the effect of temperature, substrate, salinity and nitrate. Sci. Total Environ. 635, 1025–1035 (2018).
30. Fengqin, L., Yupeng, Z., Hong, L. & Dawen, G. Long-term harvesting of reeds affects greenhouse gas emissions and microbial
functional genes in alkaline wetlands. Water Res. 164, 114936 (2019).
31. Hope, D., Palmer, S. M., Billett, M. F. & Dawson, J. J. C. Variations in dissolved C O2 and CH4 in a first-order stream and catchment:
an investigation of soil–stream linkages. Hydrol. Process. 18, 3255–3275 (2004).
32. Parkin, T. B. & Kaspar, T. C. Temperature controls on diurnal carbon dioxide flux. Soil Sci. Soc. Am. J. 67, 1763–1772 (2003).
33. Linn, D. M. Effect of water-filled pore space on carbon dioxide and nitrous oxide production in tilled and non-tilled soils. Soil Sci.
Soc. Am. J. 48, 647–653 (1984).
34. Stanley, E. H. et al. The ecology of methane in streams and rivers: patterns, controls, and global significance. Ecol. Monogr. 86,
146–171 (2016).
35. Alin, S. R. et al. Physical controls on carbon dioxide transfer velocity and flux in low-gradient river systems and implications for
regional carbon budgets. J. Geophys. Res. 116, G01009 (2011).
36. Li, S. et al. Daily C
O2 partial pressure and C O2 outgassing in the upper Yangtze River basin: a case study of the Longchuan River
China. J. Hydrol. 466, 141–150 (2012).
37. Peng, X., Wang, B., Liu, C., Liu, X. & Wang, F. Diurnal variations of pCO2 in relation to environmental factors in the cascade
reservoirs along the Wujiang River China. Chin. J. Geochem. 31, 41–47 (2012).
38. Sawakuchi, H. O. et al. Methane emissions from Amazonian Rivers and their contribution to the global methane budget. Glob.
Change Biol. 20, 2829–2840 (2014).
39. Abril, G. et al. Amazon River carbon dioxide outgassing fuelled by wetlands. Nature 505, 395–398 (2013).
40. Deirmendjian, L. & Abril, G. Carbon dioxide degassing at the groundwater-stream-atmosphere interface: isotopic equilibration
and hydrological mass balance in a sandy watershed. J. Hydrol. 558, 129–143 (2018).
41. Maher, D. T., Santos, I. R., Golsby-Smith, L., Gleeson, J. & Eyre, B. D. Groundwater-derived dissolved inorganic and organic carbon
exports from a mangrove tidal creek: the missing mangrove carbon sink?. Limnol. Oceanogr. 58, 475–488 (2013).
42. Teodoru, C. R., Giorgio, P. A. D., Prairie, Y. T. & Camire, M. Patterns in p CO2 in boreal streams and rivers of northern Quebec
Canada. Glob. Biogeochem. Cycles 23, 1–11 (2009).
43. Wei, D. et al. Revisiting the role of C H4 emissions from alpine wetlands on the Tibetan Plateau: evidence from two in situ measure-
ments at 4758 and 4320 m above sea level. J. Geophys. Res. Biogeosci. 120, 1741–1750 (2015).
44. Striegl, R. G., Dornblaser, M. M., Mcdonald, C. P., Rover, J. R. & Stets, E. G. Carbon dioxide and methane emissions from the
Yukon River system. Glob. Biogeochem. Cycles 26, 1–11 (2012).
45. Deirmendjian, L. et al. Importance of the vegetation-groundwater-stream continuum to understand transformation of biogenic
carbon in aquatic systems - A case study based on a pine-maize comparison in a lowland sandy watershed (Landes de Gascogne,
SW France). Sci. Total Environ. 661, 613–629 (2019).
46. Wang, Y., Chen, Z. Z. & Ojima, D. Preliminary results of a study on CH4 flux in Xilin River Basin steppe under different grazing
intensitles. Acta Phytoecol. Sin. 24, 693–696 (2000).
47. Vizza, C., West, W. E., Jones, S. E., Hart, J. A. & Lamberti, G. A. Regulators of coastal wetland methane production and responses
to simulated global change. Biogeosciences 14, 1–29 (2017).
48. Wang, H. et al. Temporal and spatial variations of greenhouse gas fluxes from a tidal mangrove wetland in Southeast China. Environ.
Sci. Pollut. Res. 23, 1873–1885 (2016).
49. Yang, J. et al. Effect of salinity on soil respiration in relation to dissolved organic carbon and microbial characteristics of a wetland
in the Liaohe River estuary, Northeast China. Sci. Total Environ. 642, 946–953 (2018).
50. Franz, D., Koebsch, F., Larmanou, E., Augustin, J. & Sachs, T. High net CO2 and CH4 release at a eutrophic shallow lake on a
formerly drained fen. Biogeosciences 13, 3051–3070 (2016).
51. Holgerson, M. A. & Raymond, P. A. Large contribution to inland water CO2 and C H4 emissions from very small ponds. Nat. Geosci.
9, 222–226 (2016).
52. Ping, Y., Lai, D. Y. F., Jia, F. H. & Tong, C. Effect of drainage on C O2, CH4, and N2O fluxes from aquaculture ponds during winter
in a subtropical estuary of China. J. Environ. Sci. China 65, 72–82 (2018).
53. Soumis, N., Duchemin, E., Canuel, R. & Lucotte, M. Greenhouse gas emissions from reservoirs of the western United States. Glob.
Biogeochem. Cycles 18, 1–11 (2004).
54. Maberly, S. C., Barker, P. A., Stott, A. W. & De Ville, M. M. Catchment productivity controls CO2 emissions from lakes. Nat. Clim.
Change 3, 391–394 (2012).
55. Stiles, W. A. V., Rowe, E. C. & Dennis, P. Nitrogen and phosphorus enrichment effects on C O2 and methane fluxes from an upland
ecosystem. Sci. Total Environ. 618, 1199–1209 (2018).
56. Ran, L. et al. Riverine C O2 emissions in the Wuding River catchment on the Loess Plateau: Environmental controls and dam
impoundment impact. J. Geophys. Res. Biogeosci. 122, 1439–1455 (2017).
57. Ni, M., Li, S., Luo, J. & Lu, X. CO2 partial pressure and CO2 degassing in the Daning River of the upper Yangtze River China. J.
Hydrol. 569, 483–494 (2019).
58. Olsson, L. et al. Factors influencing C O2 and C H4 emissions from coastal wetlands in the Liaohe Delta Northeast China. Biogeo-
sciences 12, 3469–3503 (2015).
59. Wilson, B. J., Mortazavi, B. & Kiene, R. P. Spatial and temporal variability in carbon dioxide and methane exchange at three coastal
marshes along a salinity gradient in a northern Gulf of Mexico estuary. Biogeochemistry 123, 329–347 (2015).
60. Zhao, Y., Wu, B. F. & Zeng, Y. Spatial and temporal patterns of greenhouse gas emissions from Three Gorges Reservoir of China.
Biogeosciences 10, 1219–1230 (2013).
Acknowledgements
This study was funded by the National Key Research and Development Program of China (Grant
No.2016YFC0500508), National Natural Science Foundation of China (Grant Nos. 51939006, 51869014), Science
and Technology Major Project on Lakes of Inner Mongolia (Grant No. ZDZX2018054), Open Project Program
Scientific Reports | (2021) 11:2659 | https://doi.org/10.1038/s41598-021-81658-x 13
Vol.:(0123456789)www.nature.com/scientificreports/
of ’Ministry of Education Key Laboratory of Ecology and Resources Use of the Mongolian Plateau’. The authors
are grateful to Dr. Xinyu Liu, Mingyang Tian, Yuanrong Su and Lishan Ran for their constructive discussions.
Data were from field measurements.
Author contributions
X.H., Y.R., L.X., L.T. and G.R. wrote the main manuscript text, Z.Z., Q.Z. prepared figure 1, and figures 7-9.
Competing interests
The authors declare no competing interests.
Additional information
Correspondence and requests for materials should be addressed to Y.R. or L.T.
Reprints and permissions information is available at www.nature.com/reprints.
Publisher’s note Springer Nature remains neutral with regard to jurisdictional claims in published maps and
institutional affiliations.
Open Access This article is licensed under a Creative Commons Attribution 4.0 International
License, which permits use, sharing, adaptation, distribution and reproduction in any medium or
format, as long as you give appropriate credit to the original author(s) and the source, provide a link to the
Creative Commons licence, and indicate if changes were made. The images or other third party material in this
article are included in the article’s Creative Commons licence, unless indicated otherwise in a credit line to the
material. If material is not included in the article’s Creative Commons licence and your intended use is not
permitted by statutory regulation or exceeds the permitted use, you will need to obtain permission directly from
the copyright holder. To view a copy of this licence, visit http://creativecommons.org/licenses/by/4.0/.
© The Author(s) 2021
Scientific Reports | (2021) 11:2659 | https://doi.org/10.1038/s41598-021-81658-x 14
Vol:.(1234567890)You can also read


