Preparing for increased weather volatility - White Paper: www.dtn.com
←
→
Page content transcription
If your browser does not render page correctly, please read the page content below
White Paper:

                                                      Preparing
                                                      for increased
                                                      weather volatility

www.dtn.com • 877.845.6598
© 2019 DTN, LLC, all rights reserved. “DTN” and the
degree symbol logo are trademarks of DTN, LLC
As the population grows and infrastructure
expands, increased exposure and vulnerability
to these hazards requires risk planning and
adaptation for greater resiliency.

In our previous white paper on climate change and
increased weather volatility, we outlined how the
climate system can change from both natural and
man-made influences. It remains unknown exactly how
much humans are impacting the natural evolution of
climate through land-use changes and greenhouse gas
emissions. Projecting those influences into the future
with certainty is not yet possible. Our conclusions
are that more actionable courses of planning and
preparation can be made based on observations of the
more recent volatile or extreme weather events, which
have been taking place over the last two decades.
Extreme weather is nothing new. Throughout          This means that urban, along with rural-metro
historical record, there have been many             areas, are expanding into a larger portion
occurrences of extreme weather events.              of the landscape, while rural areas with
Recently, however, some forms of extreme            low population density are shrinking. Cities
weather have been happening more                    will continue to drive economic growth and
frequently than natural variability would           wealth, while at the same time concentrating
suggest. It is not known if this volatility will    vital infrastructure within highly local
continue into the future, or if this active trend   areas. Infrastructure elements that are
will return to more normal frequencies. Recent      focused within cities include energy, water,
research suggests this volatility could be a        wastewater, transportation, public health,
result of the enhanced warming that has             banking and finance, telecommunications,
taken place in the Arctic region.2 A reduction in   food, and information technology. Impacts
the temperature contrast between the Arctic         from a more volatile climate system can
and the middle latitudes could be weakening         therefore have more substantial effects when
the jet stream, causing the resulting               they occur in these centralized urban areas.
atmospheric circulation pattern to buckle and       Flooding can damage or wash away homes,
stall out more often. The observed extreme          businesses, and infrastructure, affecting
weather events tend to occur more frequently        jobs and vital services. At the same time
when the jet stream remains stalled in these        natural flood management is constrained as
buckled or wavy configurations for longer           urbanization reduces the area available for
periods of time. When weather patterns stall,       holding floodwaters. Extreme heat, which
flooding is more likely to occur as moisture        tends to be more intense in urban cores, can
can pool and support repetitive, heavy rains        compromise health — especially with an aging
that fall over the same local areas. Wetter or      population. It can also reduce productivity and
drier-than-normal periods can develop when          impact the functionality of infrastructure.
air masses do not move from a given area.           Dry spells, especially ones leading to drought,
Abnormally cold or warm periods can linger          produce water scarcity issues as cities
for months, as the jet stream stays locked into     compete with agriculture, energy production,
the same position for extended periods with         and recreation for limited water supplies.
little variation. Severe weather will be more
common in some of these stalled patterns,
and less likely in others. For whatever the

                                                    Slower, wavier jet stream
cause, the stalled, wavier jet stream behavior
leads to more incidents of extreme weather.         Slower, wavier jet stream

Increased exposure and
vulnerability
In conjunction with a more volatile weather                    L                       L
and climate system, it is important to consider                                                  L
how society is changing as well. Currently,
80 percent of the U.S. population lives in
urban areas with high population densities,
and demographic trends suggest that                   Strong polar vortex:           Weak polar vortex:
urbanization will continue to increase in            faster jet stream winds      slower winds, more waves
the future.
                                                    Figure 1 Wavier jet stream.
This means that urban, along with rural-metro
areas, are expanding into a larger portion
of the landscape, while rural areas with
low population density are shrinking. Cities
will continue to drive economic growth and
wealth, while at the same time concentrating
vital infrastructure within highly local
areas. Infrastructure elements that are
focused within cities include energy, water,                                          Figure 2 Urban and rural-metro areas.
wastewater, transportation, public health,
banking and finance, telecommunications,
food, and information technology. Impacts
from a more volatile climate system can
therefore have more substantial effects when
they occur in these centralized urban areas.
Flooding can damage or wash away homes,
businesses, and infrastructure, affecting
jobs and vital services. At the same time
natural flood management is constrained as                                    Figure 2 Urban and rural-metro areas.
urbanization reduces the area available for
holding floodwaters. Extreme heat, which
tends to be more intense in urban cores, can                                   centers, based on urban growth trends alone.
compromise health — especially with an aging                                   Exposure and vulnerability are key factors
population. It can also reduce productivity and                                when evaluating risk. A tropical cyclone can
impact the functionality of infrastructure.                                    have very different impacts depending on
Dry spells, especially ones leading to drought,                                where it makes landfall. High impacts can
produce water scarcity issues as cities                                        result even when a non-extreme event occurs
compete with agriculture, energy production,                                   where exposure and vulnerability are high, or
and recreation for limited water supplies.                                     where several significant events compound
                                                                               problems.
Figure 2 shows the current geographic
coverage of the expanding urban and metro
areas, putting more types of infrastructure                                    Costs of natural hazards
into the path of potential weather hazards. 3                                  The Hazards & Vulnerability Research Institute
Census-defined urban acreage has grown                                         routinely examines county-level hazard data
by about four percent per year since 1960, or                                  for 18 different natural hazards in the United
roughly a million acres per year.4 Rare weather                                States, including costs and fatalities that are
events, such as an EF5 tornado or an extreme                                   attributed to these hazards. 5
flood, will have an increased probability in the
future of intersecting with larger population

3. USDA, 2013. Rural Classifications. http://www.ers.usda.gov/topics/rural-economy-population/rural-
classifications/what-is-rural.aspx
4. USDA, Trends in Land Use: Two Kinds of Growth. Development at the Urban Fringe and Beyond/AER-803.
http://www.ers.usda.gov/media/536705/aer803c_1_.pdf
5. Hazards & Vulnerability Research Institute. 1960-2015 U.S. Hazard Losses. http://hvri.geog.sc.edu/
SHELDUS/docs/Summary_1960_2015.pdf
Recently, some forms of extreme
weather have been happening more
frequently than natural variability
would suggest. It is not known if this
volatility will continue into the future,
or if this active trend will return to
more normal frequencies.
Extreme weather events
                                                                                     and impacts
Figure 3 shows the breakdown of the                                                  Considering both the background on historical
monetary and human losses for each hazard                                            weather- related costs and the continual growth in
type during the 56-year period from 1960-                                            population centers and associated infrastructure,
2015. Hurricanes and tropical storms have                                            it is useful to examine which weather hazards have
been the most costly type of natural hazards                                         increased or are more likely to continue to show
during this period, accounting for 31 percent of                                     an increase, due to recent climate and weather
the reported losses. Flooding came in second                                         volatility. While the most extreme events remain
with 20 percent. It is noteworthy that these                                         locally rare in nature, it is helpful to explore some
two hazards, which account for 51 percent of                                         of the more common volatile weather events and
all losses, are related to water, highlighting                                       the impacts that are more likely be encountered,
the significance that water plays in natural                                         so that actions to limit their disruptions can be
disaster costs. Fatalities are more dispersed                                        evaluated and implemented.
among the hazards with less focus on the
water impacts, and more on severe weather.

Annual losses from natural disasters can vary
from year to year. Figure 4 depicts a plot of
the costs from 1960-2015 in 2015 dollars.
There has been an upward trend in weather-
related losses over the past 20 years. This
is likely a combined influence of more active
extreme weather, the increased growth and
exposure of society, and the increased value                                         Figure 3 Monetary and human losses by hazard
of property. Several outlier years show up in                                        (1960-2015).
this graph, including 1994, which experienced
the Northridge earthquake in southern
California. In 2004 and 2005, two back-to-
back active tropical seasons, there were seven
major hurricanes (Category 3 or greater) that
made landfalls in the United States, including
Hurricane Katrina. Even though Superstorm
Sandy was not a major hurricane at landfall
it still accounted for the high losses in 2012.
It was not until 2017 that Major Hurricane
Harvey made landfall in the U.S. ending a
nearly 12 year streak of no major storms                                             Figure 4 Annual U.S. hazard losses (1960-2015).
making a direct hit on the U.S. mainland.

In the past decade there has been a noticeable
increase in the number of higher-cost disasters
in the United States. Starting in 2008, there
have been greater occurrences of billion-dollar
events, primarily from severe thunderstorms.
Both 2008 and 2011 were very active tornado
years. Several destructive storms passed
through sizeable metropolitan areas, resulting
in widespread, heavy damage. There were
also several larger-scale windstorm events
that generated long-tracked paths of damage
through highly-populated areas. Figure 5
                                                                                     Figure 5 Billion-dollar disasters by type.
illustrates this more active recent period of
high-cost storms.6

6. NCDC US Billion Dollar Disasters. http://www.ncdc.noaa.gov/billions/time-series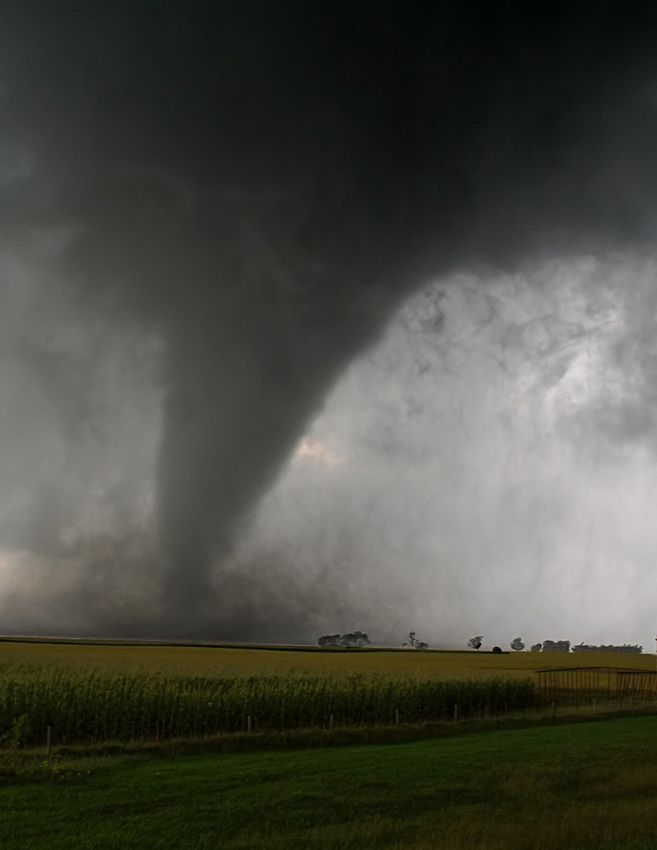
Excessive rainfall and flooding
One of the most noticeable weather events                                      Dam/levee failures — there are 74,000 dams in
that has shown an increase in recent decades                                   the United States with one-third posing a risk to
is the greater frequency of extreme rainfall                                   life and property if they fail. Excessive rainfall,
occurrences. Flood losses in the United States                                 both short-term and over many days, can lead
have accounted for around 20 percent of                                        to breaches.
natural hazard costs since 1960, and this
amount could increase in the future if recent                                  Mudslides, rock, and debris flows — hillsides
trends hold. Heavy one-day (or multi-day)                                      become unstable when they are saturated by
rainfall events have shown a greater frequency                                 heavy rainfall. Removal of vegetation nearby may
in the past two decades, especially in the                                     contribute to greater soil saturation. Burn scars
warm season, as shown in Figure 6.7 The graph                                  are more susceptible. See images in Figure 7.)
represents the annual percentage of the United
States that experienced one-day precipitation
amounts in the top ten percent of historical
occurrences. Intense rainfall rates contribute
to rapid run-off and flooding, especially in
urban areas, where impervious surfaces have
expanded in size.

Individuals, businesses, and communities should
evaluate the risks associated with extreme
rainfall events and consider the impacts that
typically occur during and after such incidents.
Efforts should be made to identify local areas
prone to flooding when excessive amounts of
rain fall. Some of the more commonly observed
flood risk scenarios and local impacts include:
                                                                               Figure 6 Climate extremes index for one-day heavy
Flash floods — extreme rainfall rates with rapid                               precipitation totals during the
accumulation and runoff. Storm water cannot                                    warm season.
be removed fast enough to prevent flooded
areas. Greater impact occurs with already-
saturated soils.

New development in urban areas — more runoff
occurs from roofs and pavement;
less ground is available for absorption due to
the building of structures and increased filling
of wetlands.

                                                                               Figure 7 Mudslide and road washouts from heavy
                                                                               rainfall events in Minnesota (June 2014).

7. NCDC U.S. Climate Extremes Index. http://www.ncdc.noaa.gov/ extremes/cei/
graph/4/04-09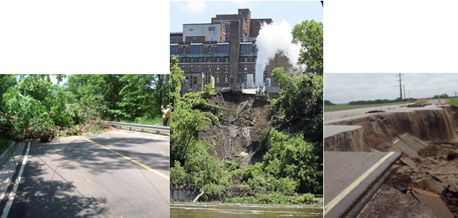
Tropical storms and hurricanes — extensive,          At times, the intensity of the warmth or
heavy rainfall over one to three days can            coldness itself during a persistent event can
saturate the soil over a large area. Extreme         become more extreme. These anomalous
rainfall rates occur near the center of tropical     temperature patterns tend to develop when
systems, with slow-moving storms capable of          the jet stream buckles and stalls, keeping
prolific flooding as experienced with Hurricane      coldness or warmth locked into areas for
Harvey in Texas in 2017. Storm surges near the       extended periods of time. A recent example
coast have the most destructive impact as a          of an extended period was the winter of
tropical storm or hurricane moves onshore.           2013-2014, when cold air remained anchored
                                                     in the Central and Eastern United States.
River and lake flooding — heavy rainfall over        Temperatures were more than eight degrees
a period of time raises lake and river levels,       colder than normal during January through
with water expanding onto shorelines and into        March 2014 (Figure 8), which is quite extreme
floodplains. This type of flooding may also          for a 90-day period. Europe, Asia, and North
occur with ice jams.                                 America have seen numerous examples of
                                                     such patterns, both cold and warm, in the last
Heavy rain on frozen ground or melting               decade. More are likely to occur as long as the
snowpack — frozen ground does not absorb             slower, more undulating jet stream persists.
melting snow or falling rain, leading to flash       Energy demands increase during these events,
flooding, as well as river and stream floods.        raising costs and stretching energy supplies.
Heavy rainfall during this scenario produces         Retail sales, especially auto, restaurants, and
greater flood risks during the cold season.          entertainment venues are hurt as consumers
                                                     stay at home more often. Home construction
Extended periods of abnormal                         can be delayed during extreme cold. Logistical
                                                     and travel networks can be disrupted,
temperatures
                                                     especially when wintry precipitation covers
It is not unusual for the weather to be colder or    wider areas, resulting in more canceled flights
warmer than average for short periods of time        and delayed deliveries.
(days to weeks). Indeed, it is this variation that
is averaged over time to define what is normal
for a given area. In recent years, there has been
a greater tendency for abnormally warm or
cold periods to set up in an area and persist for
long durations of time (months to seasons).
It is the frequency and persistence of these
long-duration events that has become more
common recently.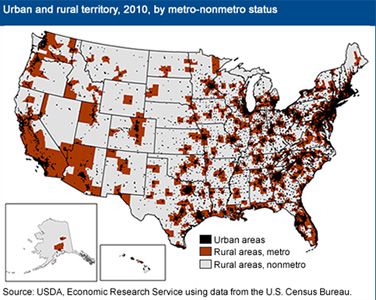
Drought, water supply, and wildfires                  NOAA/NCDC Climate Division Temperature
                                                                   Anomalies (F°)
Drought has resulted in significant long-
                                                                  Jan to Mar 2014
term economic costs to society. In the United
                                                        Versus 1981-2010 Longterm Average
States, there have been a growing number of
billion-dollar droughts over the last 30 years,
with extreme droughts in the Southeast, the
Southern Plains, the Midwest, and California
over the past decade. Drought is a natural
part of the climate system, varying in
intensity, duration, size, and location from year
to year. It is common that some portion of the
United States will experience drought each
year, with a long-term average of 14 percent of
the country being impacted annually.

Figure 9 is a timeline depicting what
percentage of the United States was in
drought each year from 1895 through 2010.
Massive droughts occurred in the 1930s and
1950s, with vast areas involved. In much                Figure 6 Climate extremes index for one-day heavy
the same way as abnormal temperature                    precipitation totals during the warm season.
patterns set up with stalled and wavier jet
stream patterns, droughts develop when
the jet stream steers around a region for
many months, decreasing the chances for
precipitation. Droughts are slowly developing
disasters that can expand outward with time
and encompass more territory. Irrigation and
the planting of more drought-tolerant crops
help to lessen the impacts of drought. Crop
losses can result in shortages that push up
food prices and sometimes lead to the culling
of livestock herds by ranchers as water and
feed supplies are reduced.

                                                    Figure 7 Mudslide and road washouts from heavy
                                                    rainfall events in Minnesota (June 2014).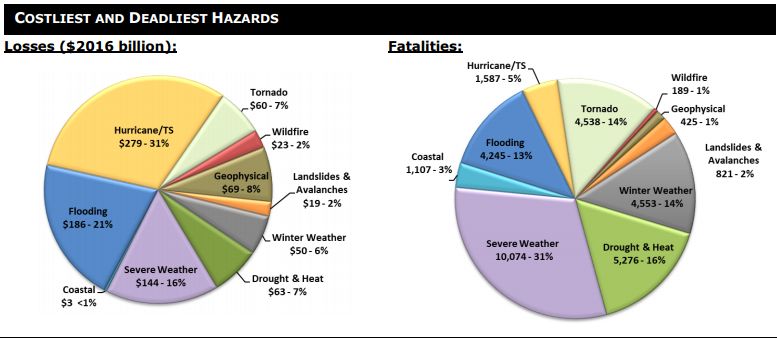
Drought is likely to be a significant threat in
the future, even in the absence of any upward
trends in intensity and coverage. Rainfall
deficits over a long period of time put strain
on available water resources. Growth in
water usage will escalate as the population
increases and new water utilizations, such
as hydraulic fracturing, increase demands.
Figure 10 shows the trends in surface- water,
groundwater, and total-water withdrawals
for the United States from 1950 to 2010.8 The
relative amounts of surface and groundwater
withdrawals have remained fairly constant
since 1985, even though the population has                                          Figure 10 Water usage.
grown, along with irrigation and industrial
growth. This slow-down in use is likely due to
water conservation practices and efficiencies
put in place since that time. About three-
fourths of the water used in the United States
comes from surface water.

Figure 11 allocates the primary users of
the water supply. Water use for electricity
production, the largest user, increased almost
500 percent from 1950 to 1980, but has
leveled off and even decreased since then.
Irrigation use increased by about 43 percent
as it takes more water to grow food for an
increased population and global markets, but
it too has been reduced in recent years. The
                                                                                    Figure 11 Water withdrawals by category.
purple public-supply boxes, which represent
local water supplies delivered to homes and
businesses, has shown steady slow growth
and may grow further due to ever- increasing
population demands.

Abnormally dry weather patterns and
droughts can have a greater impact when
they occur in areas where the water supply is
more limited. Figure 12 illustrates the concept
of a water supply stress index. The index
shows areas where watersheds are considered
stressed when water demand from power
plants, agriculture, and municipalities exceed
available supplies.9
An index value of 0.4 (40 percent) or greater
is considered stressed. In addition to much of
the arid West, a number of local or regionally
stressed areas are also found in the eastern
part of the United States. California and the
                                                                                  Figure 12 Water stress index (figure source: Averyt et
inter-mountain western                                                            al. 201120).

8. USGS, 2010. Trends in Water Use in the United States, 1950 to 2010. water.usgs.gov/
watuse/wutrends.html
9. UCS, 2011. Freshwater Use by U.S. Power Plants. http://www.ucsusa.org/assets/
documents/clean_energy/ew3/ew3-freshwater-use-by-us-power-plants.pdf
United States get most of their annual rainfall
during the winter months, so an extreme
drought of just three to four months duration
can have an enormous impact. Drought in
the future will put added strain on water
resources, requiring greater sharing and
coordination among various consumers,
especially in areas of more limited supply.
Extreme dryness or drought can also lead
to enhanced wildfire conditions. Wildfires
have always been a part of nature, with a
tendency to be more common during the hot
and dry season. Lightning initiates many fires
in the more arid western United States, but
humans are a contributor as well, whether
Figure 13 Average annual number of structures
by accident or arson. Wildfire activity destroyed by wildfire inthe U.S.
in the western United States increased
substantially in the late 20th century with
the increase primarily caused by higher
temperatures and earlier snowmelt. Similarly, and costs when fires break out. Figure 13
increases in wildfire activity in Alaska from depicts how fire losses in California have
1950 to 2003 have been linked to increased increased significantly in recent decades,
temperatures. The principal economic costs as the urban-wildland interface increased
of wildfires include timber losses, property from greater development. Over five million
destruction, fire suppression efforts, and homes in California are located within the
losses to the tourism sector. Encroachment urban- wildland interface.10 Vulnerabilities
of urban development into areas that are for landslides increase in areas with thinned
susceptible to wildfires increases the risks vegetation from droughts or wildfires.11Managing risks Energy
Disaster risk planning and management, in Sector-based impacts and practices for
light of recent weather and climate volatility,
increasing resilience
are sound practices to help prepare for and
reduce costs associated with the increased Energy — recent climate volatility has raised
hazard threats. Recent changes in these the awareness of its impacts on the energy
threats might result in new vulnerabilities industry. Severe droughts, such as those seen
that were not previously encountered or in 2010, 2012, and 2014, can affect the supply
understood. Many of the more acute weather of cooling water to power plants, disrupting
events are unpredictable and unevenly the supply of power.13 Abnormal and persistent
distributed across space and time, so temperature regimes can strain fuel supplies
knowledge of exactly when and where they and impact earnings. Flooding of infrastructure,
might occur is limited. Increasing resilience especially along coastal areas, can take those
to these changing risks can be accomplished facilities offline, as well as require costly
by reducing exposure, lessening vulnerability, repairs. Insurers have recently started to
or transferring or sharing the risks through factor in climate change in their insurance
insurance. Risk management is often governed cost calculations. Insurance affordability and
by the probability of an event multiplied by its availability could potentially slow the growth
consequence. For example, an EF5 tornado of the energy industry and shift more of the
is a rare event, but one that moves through costs to users.
a metropolitan area can have devastating
results. Reducing exposure and vulnerability More extreme rainfall:
to these events reduces the risk, but may
• Flooding of infrastructure, especially near
come with great cost or political resistance.
waterways and floodplains can take those
Risk transfer is a method of insuring against
facilities offline, as well as require costly
potential losses, which may be a more
repairs.
economical way to guard against a low-
probability occurrence. ° Harden plants and substations to reduce
the threat of flooding in susceptible areas
Various business sectors and local populations to help decrease this risk
have begun to document their experiences ° Elevate platforms used to store materials
with the changing climate system, particularly ° Preserve and improve open space
with extreme weather events.12 Some of in floodplains
this self-generated knowledge may help
° Utilize short-term weather forecasts
facilitate discussions on proactive adaptation
strategies. It might also help discover some ° Install weather stations to monitor events in
existing capacity to adapt or it may reveal real- time
important current shortcomings. Some of • Higher volumes of precipitation can saturate
this information on best practices can aid the soils and weaken support for electric
development of vulnerability and adaptation distribution poles, making them less study
assessments. The following section highlights during strong winds.
a number of the observed and expected ° Inspect distribution infrastructure
impacts on several sectors of business and
infrastructure, along with suggested methods ° Examine areas where mudslides or erosion
for adapting to the risks. could occur
10. Environmental Research Letters, 2009. Urban-wildland fires: How California and other
regions of the US can learn from Australia. http://cnr.berkeley.edu/ stephens-lab/Publications/
Stephens%20et%20al.%202009%20CA%20AU%20UWI%20En%20Res%20Let.pdf 11.
USDA, 2012. Effects of Climatic Variability and Change on Forest Ecosystems. http://www.
usda.gov/oce/climate_change/effects_2012/FS_Climate1114%20opt.pdf 12. CDP, 2014. Major
public companies describe climate-related risks and costs. https://www.cdp.net/CDPResults/
review-2011-2013-USA-disclosures.pdf 13. Pulwarty, R.S. 2013, Testimony of Dr. Roger S.
Pulwarty on Drought and the Effect on Energy and Water Management Decisions, U.S. Senate
Committee on Energy and Natural Resources. http://www.legislative.noaa.gov/Testimony/
Pulwarty042513.pdfExtended periods of abnormal warmth ° Bank water in reservoirs during off-
or cold: peak seasons
° Use seasonal weather outlooks and
• Extreme cold can stress energy supplies consultations for planning
and infrastructure. Conversely, earnings can
be affected significantly during the winter • Water usage, which will continue to grow
heating season if weather is abnormally warm with an expanding population, will strain
and energy usage is reduced. An increase in existing resources in the future with
extreme heat will drive up demand for air increased competition among sectors.
conditioning, requiring greater electric loads Drought in water-stressed areas could
and peak generating capacity. curtail hydraulic fracturing operations.
° Use a longer historical record (such as the ° May need to rely on more expensive
past 100 or more years) for estimating groundwater sources
extreme or peak values • In areas with increased wildfire risks,
° Utilize longer-term seasonal weather overhead power lines and substations can
forecasts be damaged when a fire moves through.
° Insulate equipment for temperature ° Forest management (thin and remove
extremes debris near streams)
• More extreme temperature patterns could
increase the threat for stronger coastal Transportation
storms that produce high winds and waves. Transportation — transportation
These may curtail coastal and offshore oil infrastructure is especially vulnerable to
and gas production, temporarily driving up precipitation extremes. Flooding produces a
prices and producing shortages. Coastal significant impact on infrastructure, including
storm surges could also flood vulnerable high water that occurs with flash floods, river
infrastructure. and stream flooding, and storm surges. Floods
° Upgrade flood protection can damage infrastructure, including roads,
° Use weather consultations for bridges, culverts, and even railways, airports,
pre-storm planning and coastal ports. Rushing water can wash
out soil that surrounds bridge foundations,
Extreme dryness or drought: weakening the support function. Mudslides
occur when heavy rain destabilizes hillsides,
• Drought, especially severe droughts, reduces which can quickly close roads or cut-off
the supply of cooling water to power plants communities. Road washouts, mudslides, and
and increases costs for water-use rights and
permitting. Reduced hydroelectric power
resources require shifting to more expensive
power sources.flooded roads can delay deliveries and inhibit Extended periods of abnormal warmth
employees’ ability to commute to workplaces. or cold:
River flooding that follows heavy rain events
or low water levels during drought conditions, • Extreme heat can cause rail tracks to
can restrict river transportation, disrupting buckle and kink, disrupting rail service until
barge traffic. Flash floods can be costly to rail the track is replaced. High temperatures
transportation, which is primarily impacted by can cause concrete pavement to buckle or
bridge washouts. explode, especially when recent rainfall has
seeped into its cracks.
Extreme temperatures can also impact ° Increase inspection of track during high
transportation infrastructure. They cause heat and large temperature swings
expansion and increased movement of
concrete joints, protective cladding, coatings,
and sealants on bridges and airport Extreme dryness or drought:
infrastructure, and stress the steel in bridges.
• Severe droughts reduce the water flow on
Extreme heat along with rapid temperature
inland water systems, which can disrupt
changes can damage rail tracks as the
barge traffic.
track buckles.14
° Shift product shipments to train and
The following list includes some ways that the truck delivery
transportation sector is assessing increased ° Use seasonal weather outlooks and
weather risks with methods to help manage consultations for planning
those concerns:
More extreme rainfall:
Municipalities
Municipalities — the United States is highly
• Flooding of infrastructure includes roadway urbanized with approximately 80 percent of
flooding, damage or destruction to bridges, the population living in metropolitan areas.
pavement washouts, mudslides, subway Aging and concentrated infrastructure in
flooding, airport flooding, and curtailment of these urban areas is at an increasingly higher
barge operations. risk from extreme weather events. Examples
° Upgrade drainage facilities and of urban infrastructure elements that are
capacity for more extreme rainfall at risk include energy, water, wastewater,
events. Consider 100-500-year rainfall transportation, public health, banking and
risks. finance, telecommunication, food, and
° Protect existing infrastructure, such as information technology. Disruptions in
bridge foundations from floodwaters essential services can have large impacts
because many of these services are reliant
° Preserve and improve open space in
upon each other.
floodplains
° Reinforce slopes High impact events for municipalities include,
° Relocate vulnerable routes extreme rainfall leading to flooding, storm
° Increase inspections and maintenance surge flooding in coastal locations, severe
of levee and drainage systems, storms that cause property damage and
including riverbeds power outages, snow and ice storms that snarl
transportation and trigger power outages,
° Enhance emergency response to
periods of extended dryness leading to water
flooding
shortages, and high heat and humidity leading
° Install weather stations and early to health issues. Drought increases fire risks in
warning systems to monitor events the urban-wildland interface.
and assets
14. USDOT, 2012. U.S. Department of Transportation Climate Adaptation Plan. Ensuring
Transportation Infrastructure and System Resilience. http://www.dot. gov/sites/dot.dev/files/
docs/DOT%20Adaptation%20Plan.pdfLand management is an important tool to help ° Enhance emergency response to flooding
offset some impacts, especially flooding. This ° Monitor the water supply for
includes land use planning, zoning, conservation disease potential
zones, buffer zones, or land acquisition. Often
° Install weather stations and early
it is difficult for local jurisdictions to implement
warning systems to monitor events
such management measures due to political and
and assets
economic pressures for new development, or the
perception of shifting the problems onto others.15
Extended periods of abnormal warmth
Heavy precipitation events are strongly or cold:
correlated with the outbreak of waterborne
• Extreme cold or heat can stress the urban
illnesses in the United States, primarily from
population. The elderly are particularly
water supply contamination and sewage
sensitive to heat waves. Some may be
treatment plant overflows. Fifty-one percent of
physically frail, have limited financial
waterborne disease outbreaks were preceded by
resources, and/or live in relative isolation
an extreme precipitation event.
in their apartments. They may not have
adequate cooling (or heating), or may be
The following list includes some ways that
unable to temporarily relocate to cooling
municipalities are assessing the increased
stations. Extended periods of heat can be
weather risks with methods to manage
focused in cities, which often retain more
those concerns:
heat at night.
° Develop plans for public health and
More extreme rainfall:
welfare during heat waves, including
• Flooding of infrastructure includes roadway cooling centers
flooding, damage or destruction to bridges,
pavement washouts, mudslides, and subway Extreme dryness or drought:
and airport flooding. Sanitary sewer backups
occur when storm water overwhelms that • Severe droughts reduce the amount of
system. available water supply to cities, and increase
demand for watering and recreation.
° Upgrade storm water drainage facilities
and capacity. Consider 100-500-year ° Proactively institute water restrictions
rainfall risks. ° Use low-water landscape techniques
° Reduce infiltration of rainwater into the
sanitary sewer system
Agriculture
° Protect existing infrastructure, such as
Agriculture — agriculture experiences a
bridge foundations, from floodwaters
number of the impacts from a more volatile
° Preserve and improve open space in weather and climate system. Farmers have
floodplains through land-use planning been on the front lines of these changes and
and zoning have taken measures to help offset their risk.
° Create conservation or buffer zones Commodities that are produced by this industry
° Reinforce slopes will be vulnerable to direct impacts, such as
changes in crop and livestock development and
° Relocation of vulnerable routes
yield, as well as indirect impacts from pests
° Construct or enhance levees in areas at and pathogens that emerge in some volatile
risk from storm surges patterns.
° Increase inspections and maintenance
of levee and drainage systems, including
streams and riverbeds
15. Jennings, T.L. 2011, Transcending the Adaptation/Mitigation Climate Change Science Policy
Debate: Unmasking Assumptions about Adaptation and Resilience. http://journals.ametsoc.
org/doi/pdf/10.1175/WCAS-D-11-00056.1The following list includes some ways that the Business Impacts
agriculture industry is assessing the increased
weather risks with methods to better manage Climate/
those concerns: weather
volatility
More extreme rainfall:
• Flooding — extreme rainfall, beyond
the direct destruction of property, has
Exposure Increased risk Vulnerability
important negative impacts on agriculture.
Heavy precipitation and field flooding of
agricultural systems delays spring planting,
increases soil compaction, and causes crop
losses through anoxia and root diseases.
Flooding also increases soil erosion. The
industry has installed drain tiles to increase
dispersal of excess water from fields, but
this also contributes to higher river levels
and reduced groundwater infiltration. their installation of center pivot irrigation
systems to help offset both short-term
° Install drain tiles to remove water dryness and longer term drought.16 Drought
from fields can also force livestock herds to be culled due
° Preserve wetlands and other lowlands to the high cost or unavailability of water or
° Minimize off-farm flow of nutrients the reduced productivity of rangeland.17
and ° pesticides with buffer zones • Install center pivot irrigation systems
• Use precision irrigation systems
Extended periods of abnormal warmth • Plant more drought tolerant crops
or cold:
• Extreme cold or heat, along with abnormal Conclusion
and lengthy temperature anomalies, has
Recent weather and climate variations have
impacted crops in recent years. Cold and
produced a large number of outlier events.
wet springs can delay field preparation
These events have been significantly impactful
and planting. Extended heat, especially
to both regional and local areas around the
when combined with drought, can reduce
United States. While some of these events
crop yields or decimate the entire season’s
have been unusual in their severity, societies
product.
increasing exposure and vulnerability to these
° Plant more heat tolerant crops events are resulting in greater disruptions.
° Increase use of temperature-controlled Extreme rainfall, drought, and extended periods
housing for livestock of abnormal warmth or cold are the most
° Increase use of pesticides frequent outlier weather events taking place.
Flooding events have historically been the most
° Utilize seasonal weather forecasts for
costly and their increased frequency suggests
strategic planting decisions.
that a priority be placed in that area. Each
of these more common outlier hazards can
Extreme dryness or drought: impact individuals, businesses, and government
agencies. Awareness of the hazards and their
• Severe droughts — excluding 2003, from
impacts can help to formulate plans and
2000 to 2010, crop losses accounted for
enable actions that may help offset the risks
nearly all of the direct damages resulting
associated with these events.
from droughts in the United States. Severe
droughts in the past decade have affected
large areas of the Southeast, Midwest,
South, and West. Farmers have increased
16. USDA. 2012, Climate Change and Agriculture in the United States: Effects and Adaptation.
http://www.usda.gov/oce/climate_change/effects_2012/CC%20 and%20Agriculture%20
Report%20(02-04-2013)b.pdf 17. National Drought Mitigation Center, Checklist of Historical,
Current and Potential Drought Impacts. http://drought.unl.edu/portals/0/docs/checklist.pdfYou can also read


