Ecohydrological Watershed Characterization of Semiarid Environments in New Mexico and Chihuahua, Mexico: A Remote Sensing and GIS Approach
←
→
Page content transcription
If your browser does not render page correctly, please read the page content below
Ecohydrological Watershed Characterization of Semiarid
           Environments in New Mexico and Chihuahua, Mexico:
                  A Remote Sensing and GIS Approach
 Hugo A. Gutiérrez-Jurado1,*, Enrique R. Vivoni1, Carlos A. Aragón1, Diane Meier1, and
                               Alfredo Granados-Olivas2

1. Department of Earth and Environmental Science, New Mexico Institute of Mining and
Technology, Socorro, NM.

2. Centro de Información Geográfica, Universidad Autónoma de Ciudad Juárez, Ciudad
Juárez, Chihuahua, Mexico.

Abstract
        This comparative study describes the physical and biophysical characteristics of
watersheds near Sante Fe, New Mexico, USA and Chihuahua, Chihuahua, Mexico using remote
sensing data sets and geographic information system (GIS) analysis. Natural resources
assessments across the semiarid US-Mexico border are critical since surface water resources are
scarce and groundwater is the main source of the vital liquid. The water supply of the both the
city of Chihuahua and Santa Fe are directly dependent on the quality and quantity of water in
surrounding aquifers. However, the current water sources of the two areas are insufficient in total
volume to supply the future demands of the agriculture, urban, industrial, ecological and treaty
needs of both urban regions. In addition, changes in land cover associated with extended drought
conditions and social and economic factors have affected the biophysical conditions of the
surface watersheds feeding the aquifers, negatively altering their recharge. In order to quantify
the factors impacting recharge to the aquifers near Santa Fe and Chihuahua, a descriptive and
quantitative study of the physical and biophysical characteristics of the surface watersheds was
performed. The primary watersheds around each city were characterized using digital elevation
models (DEMs) upon which various GIS data layers were super-imposed. An effort to describe
the ecologic-hydrologic status of the watersheds was made using a conceptual GIS-based analysis
technique that integrates information from soil characteristics, ecosystem structure,
geomorphology, topography and geology. Comparisons of the analysis are made to field
observations and previous work in both New Mexico and Chihuahua. We also emphasize the
differences in the analysis technique due to the variability of available data sources in each
country. The study is aimed to assist land use planning and the prospecting for and
characterization of water resources in semiarid regions across the US-Mexico border.

*Corresponding author: Hugo A. Gutiérrez-Jurado, New Mexico Institute of Mining and
Technology, 801 Leroy Place, MSEC 122, Socorro, NM, 87801 (hugo@nmt.edu).

                                                1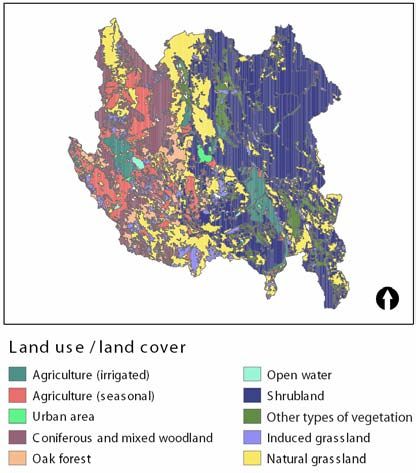
1.0 Introduction
          A water sustainability crisis is currently observed in arid and semiarid regions across the
globe as populations continue to grow in a concentrated fashion in and around large urban areas
(Hibbs, 1999; Westerhoff, 2000). This fact represents a particular challenge in arid and semiarid
areas of the southwestern United States and northwestern Mexico where cities rely mostly on
groundwater as their main source of the vital liquid (e.g., Custodio, 2002; de Vries and Simmers,
2002). The major difficulty arises when water demands exceed the available resources drafted
from the underlying aquifers which are slowly replenished via natural hydrological processes.
The recharge rate into an aquifer is controlled by the amount of rainfall received in a particular
region and the surface conditions leading either to the loss of water or its percolation into aquifer
storage (e.g., Scanlon et al., 2002). In order to understand the replenishment of aquifer water, we
require tools to quickly assess and predict the surface conditions that are most favorable for long-
term recharge into viable and accessible aquifers near large urban centers.
          This study discusses a new technique for characterizing and analyzing surface features as
a first indication of groundwater recharge potential based on readily available geospatial data sets.
The technique employs digital representations of surface topography, vegetation cover, geology,
precipitation and evapotranspiration to determine the recharge potential occurring at the land
surface. The geospatial data layers are manipulated in a geographic information system (GIS) to
qualitatively determine watershed regions of long-term recharge potential at the annual scale
(e.g., Cherkauer, 2004; Gutiérrez-Jurado, 2004). Since the dominant controls on precipitation
partitioning at the land-surface are due to the terrain characteristics, vegetation cover and geology
(e.g., Bras, 1990; Dingman, 2001), we refer to the proposed technique as a conceptual
ecohydrological characterization of aquifer recharge potential.
          We demonstrate the new technique via an application to two different semiarid locations
in the Basin and Range Province in western North America. The sites comprise parts of the
groundwater resources of Santa Fe, New Mexico, USA, and Chihuahua City, Chihuahua, Mexico.
The selection of these sites was based on the growing crisis in water availability in each urban
center due to the overexploitation of groundwater resources (Westerhoff, 2000; Consejo Nacional
del Agua, 2004). In the process of site selection, we also intended to apply the ecohydrological
characterization technique across the US-Mexico border in an attempt to: (1) compare the
availability of geospatial and hydrologic data, (2) discern the effects of data quality on recharge
potential estimates and (3) conduct a study of transboundary groundwater resources.
          The paper is organized as follows. Section 2 presents the motivation for assessing
recharge potential via an analysis of ecohydrological features. In section 3, we describe the study
areas in New Mexico and Chihuahua and present details on the current water crisis in each
region. Section 4 presents the GIS-based technique for assessing recharge potential. In section 5,
we describe the application of the recharge potential technique to the regions near Santa Fe, NM
and Chihuahua City, Chihuahua, Mexico, with a special emphasis placed on the differences in the
application due to data availability, attribute characteristics and physiographic setting. Section 6
discusses the advantages and disadvantages of the recharge characterization in light of field
studies and existing estimates in the study regions. We conclude with general comments,
recommendations and future work in Section 7.

2.0 Ecohydrological Watershed Characterization
        The integration of spatial information on surface features that affect the vertical fluxes of
water in the land surface can be considered as an alternative approach to the more-traditional
prospecting through natural resources exploitation scenarios. The association of hydrologic flux
responses to surface variables such as vegetation structure, soil types and climate indicate that
these variables comprise an ecologic-hydrologic dataset that can be examined in terms of water

                                                 2
recharge into the subsurface. The actual conditions of the ecologic-hydrologic associations are
indicators of groundwater recharge and have implications in groundwater resources management.
Eagleson (1994) has noted that physical alterations of the land surface, such as changes in
vegetation coverage, have a direct effect on the hydrologic cycle, affecting the water balance
(water storage and fluxes) of entire watersheds. Walvoord and Phillips (2004) found that different
vegetation types induce recharge and evaporation patterns in desert ecosystems, primarily due to
different plant responses to water availability and their varying survival mechanisms (deep vs.
shallow root system). Several other studies (e.g., Scanlon et al., 2000; Scott et al., 2000) have also
pointed out that recharge in the unsaturated zone in arid and semiarid areas is strongly influenced
by vegetation type and its spatial pattern. Hence, the clustering and delimitation of different
vegetation communities can aid in defining the prevalence and magnitude of certain hydrologic
processes, such as infiltration and evapotranspiration. These processes in turn have possible
feedback effects on the diversity, existence and occurrence of soil and vegetation characteristics.
Studies of vegetation distribution in the short-grass steppe of Colorado demonstrate close
associations of different plant functional types with different soil textures (Dodd et al., 2002). The
influence of soils over vegetation structure is driven by physical processes like infiltration,
exfiltration, field capacity and soil suction occurring at the land surface. Climate is another
important variable when assessing the potential for groundwater recharge in an arid or semiarid
setting. The high variability in seasonal precipitation in southwestern U.S. and northwest Mexico
has a direct effect on soil moisture dynamics (Rodriguez-Iturbe et al., 2001) and, consequently,
on water infiltration and recharge. The Chihuahuan Desert has one major wet season in the late
summer, when monsoonal precipitation forces the land-surface hydrological processes such as
runoff, evapotranspiraton and deep recharge (McClaran and Van Devender 1995).

3.0 Study Sites
        The study sites are located in the bordering states of Chihuahua, Mexico and New
Mexico USA. Both sites are part of the Basin and Range physiographic province comprised by
mountain ranges and closed basin fills across the southwestern US and the highlands of north
central Mexico. The geographic location of both study sites are shown in Figure 1. Details about
the physiography, climate, hydrography, land use and geology of both areas are addressed in the
following. Also, a brief introduction of the current water resources situation for the entities in
both locations (Chihuahua City and Santa Fe) is discussed in detail in the following section.

Chihuahua City and Santa Fe Water Crises
         Chihuahua City meets its water demands by using both surface and groundwater sources.
Surface water (dams and reservoirs) contributes only 8% of the total water supply with the
remaining extracted from four groundwater aquifers: Sauz-Encinillas, Chihuahua-Sacramento,
Tabalaopa-Aldama, and Aldama-San Diego, from which the Chihuahua-Sacramento, Tabalaopa-
Aldama and Sauz Encinillas are currently overexploited (CNA, 2004). Furthermore, Chihuahua
City continues to grow, placing a higher demand on its limited water. According to Rodriguez-
Pineda (2000), Chihuahua City will double its population and urban size in a period of 30 years,
and consequently, double its current water demand of 334 Mm3 per year to 668 Mm3 by 2033.
Thus, the only viable long-term solution is for Chihuahua to look for additional water sources.
         Santa Fe meets its water demand by primarily using groundwater sources. In an effort to
avoid the impending water crisis predicted for New Mexico, Santa Fe has developed various
stages of water alerts and conservation methods. In April of 2002, the city of Santa Fe declared
that the Santa Fe watershed was in a Stage 3 water shortage, which had serious implication for the
economic activities of the area. While the city uses conservation methods to extend the life of the
aquifer, they are also actively seeking alternative sources of water for its residents, including
possible surface water extraction from the Río Grande.

                                                  3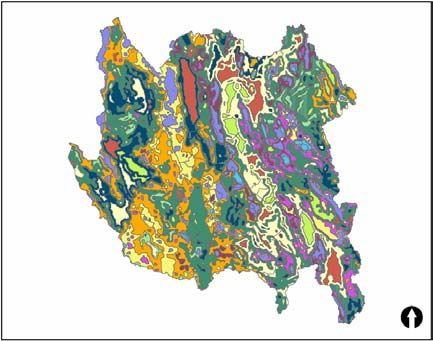
Figure 1. Location study areas. The light blue polygons correspond to the watersheds pertaining
to the Río Conchos near Chihuahua City and the Río Grande watershed near Santa Fe, NM.

Regional Physiography
         The study area is part of the intermontane plateau of North America and is located within
the Mexican Highlands of the Basin and Range province. The region is characterized by
mountain ranges and closed basins filled by Quaternary alluvial deposits. The Chihuahua site is
characterized by intermontane basins with internal drainages; broad, rolling, upland plains, and
mountains with west facing escarpments (Gile et al, 1981). One major mountain range, Sierra del
Nido, divides the area into a central-east, low elevation subprovince and a western, high elevation
subprovince (Figure 2.a). The Sante Fe site in New Mexico is located in the central segment of
the Río Grande Rift which begins in Taos and terminates in Socorro, NM. The watershed is
located in the central portion of this segment. The boundaries of the watershed are marked by the
Jemez Mountain range to the west and the Sangre de Cristo Mountains to the east, including the
north-to-south draining Río Grande. Canyons formed by tributaries to the Rio Grande traverse the
entire area of the study watershed (Figure 2.b).

Regional Climate
         The regional climate at both sites is semiarid dry with variations due to elevation.
Schmidt (1993) has observed that climatic variability in the Chihuahua site follows the elevation
gradient imposed by relief. This observation is also valid for the New Mexico site, where climate
varies from drier and warmer in the lower valleys of the Río Grande to the wetter and colder in
the mountains. The climate in the Chihuahua study region is either semi-dry temperate, with a
rainy season in summer, or very dry with a summer rainy season and few precipitation events in
the winter. The climate of the study watershed in New Mexico is semiarid characterized by low
amounts of precipitation, low humidity and large diurnal and seasonal fluctuations in temperature.

Regional Geology
       The study area in Chihuahua mainly comprises mountain ranges exposing Tertiary to
Cenozoic igneous rocks and late Cenozoic to Quaternary alluvial basin fills. Lower Cretaceous

                                                4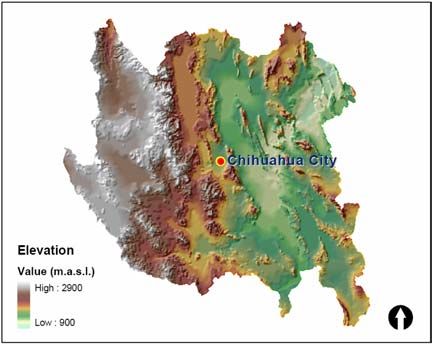
(a)                                                  (b)

Figure 2. Aerial view of the topography of the study sites from a digital elevation model (DEM),
showing the locations of (2.a) Chihuahua City and (2.b) Santa Fe with respect to the study area.

limestones crop out in the northeastern part forming small north-striking limestone and shale
mountain ranges, each approximately 30 km in length. The north and south-central part of the
area, as well as the southeastern part, are characterized by deep, internally drained basins filled by
Quaternary alluvium. In the north-central part of the region, several lacustrine environments were
formed. The Sierra del Nido exposes Tertiary to Quaternary rhyolites and tuffs and is the major
dividing feature of the region, separating the higher sedimentary plains of the west from the lower
Quaternary basins to the east. The western part comprises sandstones and conglomerates, and
relatively small areas of alluvial sediments in the fluvial systems feeding the Río Conchos.
         The geology of the watershed in New Mexico is made up of three separate and major
structural elements: the Valle Grande Caldera, the Española Basin of the Rio Grande Rift and the
Sangre de Cristo Uplift. The rim of the Valle Grande gives way to the Pajarito plateau on the
western edge of the watershed. The ash deposits of the Bandelier Tuff form the Pajarito Plateau.
Along the east side of the Jemez Mountains, is the 30-mile long Pajarito fault. The Pajarito fault
is one of the primary displacements that occur on the west side of the Rio Grande Rift. This fault
has displaced the quartz latites of the area approximately 975 ft and the Bandelier Tuff 325-500 ft
marks boundary between the caldera and the Española Basin.

Hydrography
        The study site in Chihuahua can be hydrographically divided in two main systems: the
Cuencas Cerradas del Norte and the Río Conchos watersheds. The Cuencas Cerradas del Norte is
subdivided into 6 subwatersheds with endorreic drainages. The rivers in these watersheds are
intermittent for most of the year. Since runoff from these basins does not drain into major rivers,
some part of the water infiltrates into the basin floor and the remainder is lost by evaporation or
forms perennial lakes in the lowest elevation areas. The Río Conchos watershed is comprised of
14 sub-watersheds where the main hydrographic feature is the Río Conchos which flows from its
headwaters in the southwestern part of the Sierra Madre Occidental through the Chihuahuan
Desert until it reaches the Río Grande at the Chihuahua-Texas border.
        The main hydrographic feature for the study site in New Mexico is the Río Grande which
flows north-south through the central portion of the site. A major tributary on the eastern side of
watershed is the Pojaque River, while the western side consists of three major tributaries: Río
Chiquito, Río de Los Frijoles and Cañada del Buey. These three tributaries receive the water from
various arroyos and then flows directly into the Rio Grande. In the context of the study basin, all
of the streams flow into the Río Grande, which flows into Cochiti Lake, located along the
southern boundary of the watershed.

                                                  5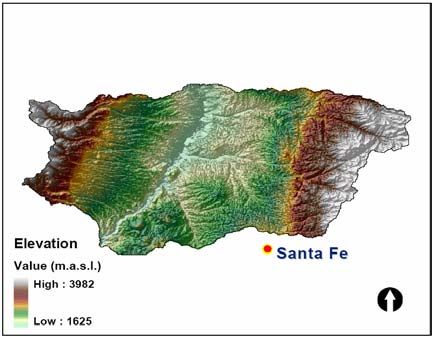
4. GIS-based Analysis of Groundwater Recharge Potential
         The integration of geospatial information on land surface features that affect the vertical
fluxes of water can be a useful tool in defining and assessing regions of groundwater recharge
potential. Since the advent of geographic information systems (GIS), the use and manipulation of
geospatial data layers have been frequently used to assess the watershed hydrologic response to
different meteorological events. Engel (1996) has performed assessments of different methods for
developing “hydrologic response units” (HRUs) based on terrain, land cover and soils data. These
HRUs constitute a useful framework for the development of a variety of hydrologic models and
the construction of hydrologic scenarios. Bongartz (2002) derived HRUs to overcome the
problem of scale in modeling runoff processes in mesoscale catchments of Germany. Karvonen et
al. (1999) used a similar approach for integrating areas of similar hydrologic behavior to derive
“hydrologically similar units” (HSU) with the purpose of modeling the influence of land use on
catchment runoff. All of these methodologies have in common the integration and manipulation
of geospatial datasets to construct specific environmental scenarios that aid in the prediction of
hydrologic processes at different scales. Following these studies, our approach is to define
catchment regions where groundwater recharge is likely and furthermore to assess the landscape
factors responsible for vertical hydrologic fluxes to the subsurface.

4.1 Methods and Data
         We utilized readily available data from the two study sites (Chihuahua, Mexico and Santa
Fe, New Mexico) to produce a geospatial estimate of groundwater recharge potential. The GIS-
based recharge potential is produced as a raster grid or map by integrating the following digital
variables: lithology, geomorphology, land use or land cover, precipitation, and potential
evaporation. The lithology, geomorphology, and land use/land cover maps are secondary data
products based on geologic, topography, vertical dissection and vegetation digital maps,
respectively (Gutierrez-Jurado, 2004). The precipitation and potential evaporation maps where
obtained from surface meteorological data at numerous weather stations and/or estimates based
on regional climate and its interaction with watershed relief (Gutierrez-Jurado, 2004). To produce
a numerical recharge potential estimate, each input variable (e.g. lithology, vegetation) was
classified in accordance to a ranking derived based on the potential contribution to groundwater
recharge. For each surface feature of relevance to the potential recharge, each pixel was assigned
a classification ranging from "Very Good" and “Good” to “Moderate”, “Low”, and "Poor".
Numerical values were then assigned to each class based on the rank assigned according to their
contribution to the potential for groundwater recharge. For example, the land use/land cover
classification was used to assign high values of recharge potential for forest land (“Very Good”)
that typically has higher recharge rates than bare soil (“Poor”), with numerical values associated
to each classification. A more comprehensive explanation of the classification criteria for each
variable is detailed in the following subsections and discussed by Gutierrez-Jurado (2004).
         Figure 3 presents a schematic of the GIS procedure used to construct a groundwater
recharge potential map based on the geospatial data representing geomorphology, land cover,
geology, precipitation and evaporation. Table 1 depicts the categorization and classification of the
variables for each theme used in the present analysis for the sites in Chihuahua, Mexico and Santa
Fe, New Mexico. Although conceptual in nature, the above outlined procedure provides a
numerical means for integrating geospatial data from a variety of sources for the calculation of
recharge potential. Determination of the thematic categories and their relative values is typically
based on comparative studies obtained from field observations, laboratory experiments and
numerical modeling of the sensitivity of recharge to various surface features. For the purposes of
this study, we have made extensive use of field data within the region and educated estimates
based on hydrological proxies for recharge.

                                                 6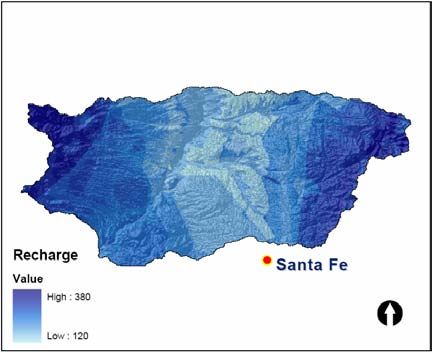
Figure 3. Schematic of the GIS procedure to construct a groundwater recharge potential map.

4.2 Geomorphology
         Geomorphology is associated with topographic landforms which, in turn, are related to
runoff and infiltration (Beven and Kirkby, 1979; Poole et al., 2002). Geomorphic descriptors have
been used to study the relationship between surface and subsurface groundwater interactions
(Zecharias and Brustsaert, 1988; Berger and Entekhabi 2001). In this study, different geomorphic
features are classified and rated according to their potential recharge. The geomorphic
classification was based on a methodology employed by the Instituto Nacional de Ecologia (INE)
in Mexico. This methodology is used for determining landforms at scales ranging from 1:50,000
to 1:250,000. The method defines landforms based on vertical dissection (VD), a morphometric
parameter that quantifies the relief per unit of area, expressed in m/km2 (Priego-Santander and
Pérez-Damián, 2004). VD maps are used to define different types of relief (e.g. mountains,
pediments, hills, plains) and provide a measure of relief potential energy. The geomorphologic
classification with their corresponding VD values for the two study areas is shown in Figures 4.a
and 4.b. The landforms obtained with the VD parameter are associated with the terrain slope
which affects watershed hydrology and recharge potential. For example, mountains have steeper
slopes which will increase runoff and reduce infiltration as opposed to plains which have shallow
slopes leading to negligible runoff and high infiltration potential.

4.3. Lithology
         The occurrence and availability of groundwater is also controlled by the primary and
secondary porosity and the permeability of the lithological features in the terrain (Solomon,
2003). In this study, the classification of lithology was made based on its porosity and
permeability. Permeability can be expressed both in terms of hydraulic conductivity (K) or
specific yield (S). Several authors (Fetter, 2001; Heath, 1987) give estimated values for porosity,
permeability, and specific yield, from which a general lithological classification was made for
this study. Different lithologic materials were parameterized and grouped into seven classes
according to their ability to transmit water.

                                                7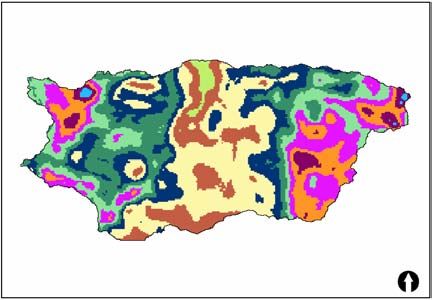
Table 1. Parameterization of variables according to their contribution to the occurrence of
groundwater recharge. Note: Potential evaporation was split into two classifications, one for each
study area, due to the disparity obtained in the estimated evaporation for the two areas.
Parameter Parameter
Precipitation (mm) Value Condition Potential Evaporation (cm) Value Condition
> 880 80 VG Chihuahua Santa Fe
780 - 880 70 G < 32 < 121 80 VG
680 - 780 60 G 32 - 39 121 - 129 70 G
580 - 680 50 M 39 - 45 129 - 137 50 M
480 - 580 40 M 45 - 52 137 - 144 30 L
380 - 480 30 L > 52 > 144 10 P
330 - 380 20 L
< 330 10 P Lithology Value Condition
Loose sediments 80 VG
Land use/land cover Value Condition Igneous extrusive rocks 70 G
Forests 80 VG Conglomerate 60 G
Grasslands 40 L Limestone 60 G
Croplands 40 L Sandstone & Volcanoclastics 50 M
Water Bodies 40 L Massive igneous intrusive/meta 40 L
Bare ground 20 P Shale 30 P
Shrublands 10 P
Urban 10 P Geomorphology Value Condition
Plains 80 VG
Hills (slight to mod. dissected) 60 G
Hills (strongly dissected) 40 L
Mountains 10 P
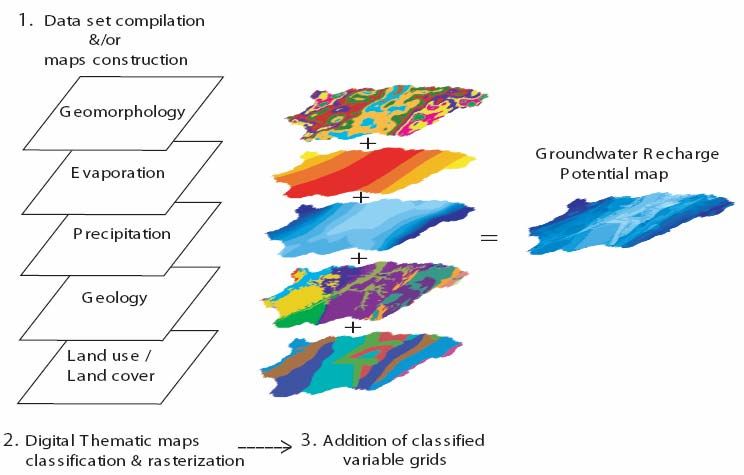
4.4 Land use/land cover
Land use/land cover (LU/LC) is an important parameter in the assessment of surface
hydrological conditions in any watershed. To a great extent, LU/LC determines the behavior of
surface water in semiarid catchments. One example of this is given by Bromley et al. (1997) who
found that, in bare ground semiarid areas, runoff starts within minutes of the start of rainfall and
that runoff generation is strongly associated to the distribution and type of soil surface crusting
(Schlesinger et al., 1998). Using this approach, seven classes were formed from a LU/LC map
provided by INE, and their respective rating and values were given (Table 1) according to their
potential contribution to groundwater recharge. Figure 5 shows the LU/LC maps used in the
classification process.
4.5 Potential Evaporation
Evaporation is one of vertical fluxes of water at the interface of atmosphere and land
surface. Evaporation is a function of solar insolation, available heat, humidity and wind (Robson
and Stewart, 1990), and it constitutes an important variable in soil moisture calculations and as a
consequence is an important parameter in recharge estimates. Evaporation data for the continental
U.S. is available as vector digital maps at 1:5,000,000 scale in the form of evaporation isopleths.
For the Chihuahua region, however, an equivalent digital map of evaporation is not readily
available. As a result, we constructed an evaporation map using estimates of monthly potential
8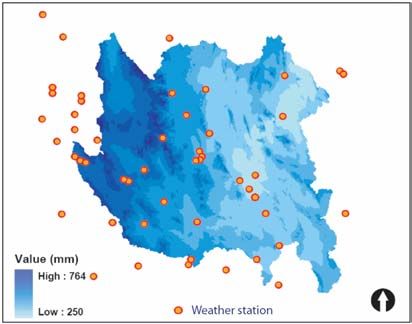
(a)
                                                     (b)

                        Figure 4. Geomorphology maps of the study sites.

evaporation obtained via the Thornthwaite equation. The estimates were calculated using daily
records of temperature of the weather stations available in the area and the map was built by
spatially interpolating the resulting estimates using a linear regression approach between potential
evaporation and elevation data obtained from the digital elevation model (DEM). The resulting
evaporation map for the area of Chihuahua differed by half the magnitude of the values given in
the evaporation map from the area in New Mexico (Table 1). Thus, a different classification
criterion was applied in the categorization of this variable, in which each map was classified
according to a ranking based on its own map values.

4.6 Precipitation
         The amount and intensity of rainfall are the main controls on groundwater recharge and
replenishment of surface water reservoirs. Precipitation maps of the area were classified in
accordance into eight classes from 220 mm to 1200 mm of rain. The precipitation map for the
study site in New Mexico was obtained from the PRISM U.S. national database, while the
precipitation map for the area in Chihuahua was constructed using rainfall data from weather
stations in the vicinity of the study area and a DEM. The DEM used for this calculation was
generated from a 1:250,000 scale digital topographic map of Chihuahua with a 100-m contour
interval. The rainfall map was constructed using an orographic approach that accounts for the
effect of elevation on precipitation patterns. This method produces a more realistic aerial
representation of rainfall in mountainous terrain by spatially extrapolating the mean historic
annual rainfall estimates of each weather station onto the elevation data (Daly et al., 1994) via a
linear regression computation. The precipitation maps are shown in Figure 6.

                                                 9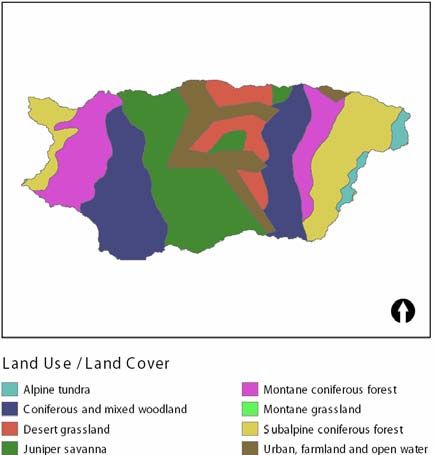
Figure 5. Land use and land cover maps for the study sites

   (a)                                               (b)

Figure 6. Precipitation maps for both locations (a) Chihuahua site with location of the weather
stations, (b) PRISM precipitation map for Santa Fe study area.

5.0 Recharge Potential
        The method used in this study yields a map showing areas that in a holistic way present
favorable conditions for groundwater recharge occurrence. This estimate, however, should not be
taken as a quantitative result of the recharge over the study areas, but rather should be considered
a first approximation of the regions with high recharge potential. Figure 7 shows the final
recharge maps for both study areas constructed upon completion of the methodology described I
Section 4. The figures show that there is higher recharge potential (darker blue color) at the
higher elevation areas of both study sites. In the area of New Mexico, the eastern and western
boundaries of the watershed are the zones of higher elevation (Figure 7.b) where the recharge
potential becomes more significant. In Chihuahua, the influence of elevation is seen across the
mountain ranges and high plains of the west, where there is higher recharge potential compared to
the eastern mountain ranges in the lower lands of the Chihuahuan desert. It is interesting,
however, to note in the Chihuahua area (Figure 7.a) that high recharge potential values are

                                                10
(a) (b)
Figure 7. Recharge Potential Maps for the (a) area of Chihuahua and (b) Santa Fe.
consistently high within the mountain fronts of the western mountain blocks. Recharge studies in
arid and semiarid areas have recognized the importance of mountain front recharge (MFR).
Mountain front recharge is defined as the contribution of mountain regions to the recharge of
aquifers in adjacent basins (Wilson and Guan, 2004). These higher elevations receive a relatively
large amount of precipitation when compared to the valley, and eastern plains and mountains,
increasing their opportunity for groundwater recharge. Another factor contributing to the higher
recharge potential at the higher elevations is the land cover. The vegetation in the mountains is
comprised mainly by mixed oaks and coniferous forest in the case of Chihuahua, and montane or
a subalpine coniferous forest in the case of New Mexico. These forests have temperate climates
and high amounts of organic matter in the soil, which increases water retention and infiltration
capacity of soils and allows deep percolation into the mountain blocks.
In New Mexico, the lowest recharge potential values are found in the river valley (i.e.
low elevations). Factors contributing to the low recharge potential in these regions are more than
likely the low precipitation values throughout the year, the high evaporation potential, and also
the influence of arid and semiarid vegetation, which extracts almost all the rainwater after a
storm. In Chihuahua, the mountain ranges in the eastern part of the study area have the lowest
recharge potential values within the region. This is due to the fact that these mountain ranges are
arid, have low vegetation cover and contain steep slopes that produce high amounts of runoff with
few chances of infiltration and downward percolation. Also, potential evaporation in these small
mountain ranges is among the highest in the study region. However, it is interesting to note that in
the footslopes of these mountain ranges, the recharge potential values increase indicating the
possibility of mountain front recharge.
Although the spatial representations of groundwater recharge potential are useful, it was
also of interest to determine which of the physical (geology, geomorphology, and land use/land
cover) and climatic parameters (precipitation and evaporation) had the strongest influence on the
recharge estimate. To determine the amount of influence of each layer, the individual layers were
divided by the final recharge map to get the fraction of a particular feature contributed to the total
recharge potential. This calculation took the recharge value from the layer of choice at a single
pixel and divided the value by the total recharge potential at that pixel.
To obtain a more quantitative understanding of the influence of each layer, histograms
were created for the fractional contribution of each variable to the total recharge (Figures, 8.a,
8.b, and 9.a, 9.b). The two of the variables with most influence in determining the recharge
potential of both study areas were precipitation and geomorphology. The similarity in the
contribution of precipitation for both areas is strongly evident (Figures 8.a and 8.b), although
difference in spatial resolution and the generation methods exist. As opposed to the rainfall maps,
11(a) (b)
Figure 8. Histograms of the contribution of precipitation to total recharge potential for the
regions in Chihuahua (a) and Santa Fe (b).
(a) (b)
Figure 9. Histograms of the contribution geomorphology to total recharge potential for the
regions in Chihuahua (a) and Santa Fe (b).
the geomorphology was produced with the same methodology although with different resolution
in the input elevation data. Nevertheless, the results indicate that the contribution of this variable
to recharge potential is similar in both areas (Figures 9.a and 9.b).
6. Advantages and Disadvantages
Typical groundwater recharge estimations such as water balance models, chlorine
estimations, and computer based models require measurements or estimation of a large number of
parameters (Chapman and Malone, 2002). These measurements are typically hard to obtain and
acquiring them can be costly and time consuming. The methodology presented here is based on
data that is widely available and easy to access, thus providing a first approximation of the
potential recharge in semiarid regions. The GIS method is particularly useful for performing
recharge calculations in large areas with high spatial variability in terms of climate, land cover,
relief, geomorphology and geology. Under these circumstances, the use of conventional recharge
methods accounting for this parameter variability becomes too complex. The advantages of using
the GIS method for groundwater recharge potential also include its simple, yet holistic,
conceptual modeling approach to ecohydrological controls on groundwater recharge. The input
data for the construction of the recharge potential map is available as digital maps from different
agencies in the US and Mexico (e.g. USGS, NRCS, in the US and INEGI, INE, CONABIO, in
Mexico). Finally, the processing, manipulation and visualization of the data and the recharge
estimate is relatively simple and inexpensive.
The disadvantages of performing an assessment of this nature for two different areas is
mainly concerned with the differences in data availability, resolution and definition, as well as the
12conceptualization and categorization for the variables that for some cases yield incomparable
results. That is the case of the map for potential evaporation (PE) for the US which has values
that are almost as twice as high as those calculated for the area in Mexico. In addition,
incompatibility of soils data between the US and Mexico, and the lack of consistency among the
description of the soil attributes, represented a significant obstacle in this study. Transboundary
studies should take into account the variations of available geospatial data and the need to process
these onto equivalent representations prior to GIS-based modeling.
7. Conclusions and Future work
The recharge potential assessment presented in this study is an alternative means for
determining groundwater recharge areas. Although the method does not offer a quantitative
estimate of the recharge rate, it assists in defining and locating areas that are most favorable for
groundwater recharge. In addition, the simple and inexpensive method can provide water
managers with a first overview of the water resources potential in relatively large areas.
Additional work should be directed towards a better understanding of the contribution of each
geospatial variables to the occurrence of groundwater recharge. This methodology currently does
not take into account the importance of each variable relative to each other with respect to their
specific recharge potential contribution. The methodology assumes that all of the factors are
equally weighted when they are added together to create the final recharge map. Because the
different variables where treated as equal contributors, it is possible that the recharge potential is
overestimated for a given area and underestimated for others. Future work should focus on
finding ways physically-based to weight input variables in the analysis.
A more quantitative approach is also required for categorizing the classifications for each
input variable. Either through field studies or via water balance simulation models, the impact of
parameter variability on the groundwater recharge potential needs to be assessed. The work of
Rodriguez-Iturbe et al. (2001) is one potential simulation avenue to pursue, as the sensitivity of
the recharge rate (leakage) can be directly associated to soil, vegetation, rainfall and evaporation
variables. Field-based recharge measurements should also be used to validate the results of the
method in locating the areas showing higher recharge potential. The “ground truthing” of the final
maps will indicate whether or not the equal weighting of all data layers is appropriate. The
current methodology is expected to evolve as the information available for the two sites evolves.
Recent research describing the effects of vegetation type on aquifer recharge in arid environments
is promising (e.g. Walvoord and Phillips, 2004) and point to the possibility of incorporating these
field based estimates into the GIS-based methodology.
References
Berger, K.P., Entekhabi, D. 2001. Basin hydrologic response relations to distributed physiographic
descriptors and climate. Journal of Hydrology, vol 247, pp. 169-182.
Beven K.J, Kirkby M.J. 1979. A physically-based variable contributing area model of basin hydrology.
Hydrological Sci Bull, pp.24 – 43.
Bongartz T., Koivusalo H., Jauhiainen, Palko J., Weppling K. 1999. A hydrological model for predicting
runoff from different land use areas. Journal of Hydrology 217: 253-265.
Bras, R. L. 1990. Hydrology: An Introduction to Hydrologic Science. Addison-Wesley, Reading,
Massachusetts, USA.
Bromley J., Brower J., Barker A.P., Gaze S.R., Valentin C. 1997. The role of surface water redistribution in
an area of patterned vegetation in a semi-arid environment, south-west Niger. Journal of Hydrology,
vol 198, pp. 1-29.
Chapman T.G., Malone R.W. 2002. Comparison of models for estimation of groundwater recharge,
using data from a deep weighing lysimeter. Mathematics and Computers in Simulation, 59: 3–17
13Cherkauer, D.S. 2004. Quantifying ground water recharge at multiple scales using PRMS and GIS. Ground
Water. 42 (1): 97-110.
CNA, Comisión Nacional del Agua 1997. Programa Hidraulico de Gran Vision del Estado de Chihuahua
1996-2020. Comisión Nacional del Agua, Gerencia Regional Norte, Tomo II, pp. 1-6.
Consejo Nacional del Agua 2004. Estadísticas del Agua en México, 2004 / Comisión Nacional del Agua.-
México: CNA, 2004. Capitulos 3-4 pp. 39-40, 59-60.
Custodio, E. 2002. Aquifer overexploitation: what does it mean? Hydrogeology Journal. 10 (2): 254-277.
de Vries, J. J. and Simmers, I. 2002. Groundwater recharge: an overview of processes and challenges.
Hydrogeology Journal. 10 (1): 5-17.
Daly C., Neilson R.P., and Phillips D.L. 1994. A statistical-topographic model for mapping climatological
precipitation over mountainous terrain. J. Appl. Meteor., 33, pp. 140-158.
Dingman, S. L. 2001. Physical Hydrology. 2nd Edition. Prentice Hall. Upper Saddle River, New Jersey, US.
Dodd M. B., Lauenroth W. K., Burke I. C. & Chapman P. L. 2002. Associations between vegetation
patterns and soil texture in the shortgrass steppe. Plant Ecology 158 pp.127–137.
Eagleson, P.S. 1994. The Evolution of Modern Hydrology (from watershed to continent in 30years).
Advances in Water Resources, vol. 17 pp. 3-18.
Engel A.B. 1996. Methodologies for development of hydrologic response units based on terrain, land
cover, and soils data. GIS and Environmental Modeling : Progress and Research Issues. Goodchild et
al., editors: 123-128
Fetter C.W. 2001. Applied Hydrogeology. Prentice-Hall. Upper Saddle River, NJ, US, Ch 3, pp. 71-89.
Gile L.H., Hawley J.W., and Grossman R.B. (1981). Soil and geomorphology in the Basin and Range area
of Southern New Mexico—Guidebook to the Desert Project. New Mexico Bureau of Mines & Mineral
Resources. Chapter 1, pp.17-19.
Gutiérrez-Jurado, H. 2004. Physical and ecohydrological watershed characterization of a semi-arid
environment in Central Chihuahua, Mexico: A remote sensing and GIS approach. M.S. Thesis.
University of Texas at El Paso. 166 pgs.
Heath, R. C. 1987. Basic ground-water hydrology. USGS water supply paper; 2220. pp. 6-13.
Hibbs, B. J. 1999. Hydrogeologic and water quality issues along the El Paso/Juarez corridor: An
international case study. Environmental and Engineering Geoscience. 5 (1): 27-39.
Karvonen T., Koivusalo H., Jauhiainen M., Palko J., Weppling K. 1999. A hydrological model for
predicting runoff from different land use areas. Journal of Hydrology, vol. 217 pp. 253-265.
McClaran, M. P., T. R. Van Devender. 1995. The desert grassland. University of Arizona Press, Tucson.
Poole G.C., Stanford J.A., Frissell C.A., Running S.W. 2002. Three-dimensional mapping of geomorphic
controls on flood-plain hydrology and connectivity from aerial photos. Geomorphology, vol.48, pp.
329–347
Priego-Santander, A.G. and Pérez-Damián, J.L. 2004. Diplomado en Manejo Integral de Cuencas
Hidrológicas. Notas de Clases. Universidad Autónoma de Ciudad Juárez, Chihuahua, Texto 6.
Robson S.G., and Stewart M. 1990. Geohydrologic evaluations of the upper part of the mesaverde group,
northwestern Colorado. U.S. Geological Survey, Water resources investigation report 90-4020.
Rodriguez-Pineda J.A. 2000. A geophysical, geochemical and remote sensing investigation of the water
resources at the city of Chihuahua, Mexico. University of Texas at El Paso, El Paso, TX. Doctoral
dissertation, pp. 10-43.
Rodríguez-Iturbe I., Porporato A., Laio F., Ridolfi L. 2001. Plants in water controlled ecosystems: active
role in hydrologic processes and response to water stress. I Scope and general outline. Advances in
Water Resources 24, pp. 695-705.
Scanlon B.R., Goldsmith R.S., Langford R.P. 2000. Relationship between Arid Geomorphic Settings and
Unsaturated Zone Flow: Case Study, Chihuahuan Desert, Texas. Bureau of Economic Geology, Report
of Investigations No. 261, pp. 2-3.
Scanlon, B. R., Healy, R.W. and Cook, P.G. 2002. Choosing appropriate techniques for quantifying
groundwater recharge. Hydrogeology Journal. vol 10, pp. 18-39.
Schmidt, Robert H., 1993, Chihuahua, tierra de contrastes geograficos; in Marquez-Alameda, Arturo (vol.
coord.) and Ruben Lau (Gen. Coord.), Historia General de Chihuahua I: Geologia, Geografia; y
Arqueologia: Univ. Auton. Ciudad Juarez; and Gobierno del Estado de Chihuahua, pp. 45-101.
Schlesinger W.H., and Pilmanis A. M. 1998. Plant-soil interactions in deserts. Biogeochemistry vol. 42, pp.
169-187.
14Scott R.L., Shuttleworth W.J., Keefer T.O. 2000. Modeling multiyear observations of soils moisture
recharge in the semiarid American Southwest. Water Resources Research, vol. 36, No. 8, 2233-2236.
Solomon S. 2003. Remote Sensing and GIS: Applications for Groundwater Potential Assessment in Eritrea.
Doctoral Dissertation, Environmental and Natural Resources Information Systems Royal Institute of
Technology SE-100 4 Stockholm, Sweden, Ch 3, 4, pp. 11-43.
Walvoord M., Phillips F., Plummer M., and Wolfsberg A. 2004. Identifying areas of basin-floor recharge in
the Trans-Pecos region and the link to vegetation. Journal of Hydrology 292 pp. 59–74
Westerhoff, P. 2002. The US-Mexican Border Environment: Water Issues along the US-Mexican border.
SCERP Monograph Series, no. 2. San Diego State University Press. 117 pgs.
Wilson J.L. and Guan H. 2004. Mountain-Block Hydrology and Mountain-Front Recharge. Groundwater
Recharge in A Desert Environment: The Southwestern United States. AGU Series. In press.
Zecharias Y.B., Brutsaert W. (1988). The influence of basin morphology on groundwater outflow. Water
Resources Res., vol 24, pp. 1645-1650.
15You can also read