SAFE WASTE DISPOSAL - SENSIBLE RECOVERY - Müllverwer tung Rugenberger Damm - Müllverwertung Rugenberger Damm
←
→
Page content transcription
If your browser does not render page correctly, please read the page content below
Müllverwer tung Rugenberger Damm

SAFE WASTE DISPOSAL –
                                         2020
    SENSIBLE RECOVERY
Our objectives:

       Economically efficient –
           ecologically consistent
       Our corporate objective can be summed up in one sentence: we want to
       provide low-cost thermal treatment of the maximum available waste
       that we receive, using the MVR facilities to generate electricity and
       district heating, produce reusable materials and largely avoid creat-
       ing    waste     in   the   process,   while    maintaining     high
       standards of plant safety, occupational health and safety for our
       employees, and environmental compatibility.
       This publication, which is our current Environmental Statement in
       accordance with the Eco-Management and Regulation (EC) No.
       1221/2009 (EMAS III) shows why speaking of commercial and eco-
       logical sense in the same breath is not a contradiction in terms.
       MVR has published annual Environmental Statements since                     Another aspect of our effec-
       2000. It will continue to update the Environmental Statement               tive utilisation of waste as a
       every year. Our environmental management system applies for                “raw material” has been the
2      internal and external employees on the grounds of MVR and                 additional extraction of dis-
       includes all processes on the site.                                       trict heating water since
                                                                                October 2004. This can reach a
                                                                                capacity of up to 20 MW of heat
                                                                               which could serve about 2,500
                                                                               homes.

                                                                             For a further increase of the
                                                                            cost-effectiveness we work in
                                                                            close co-operation with Anlage
                                                                           Müllverwertung Borsigstraße GmbH
       Economically efficient procedures: The high utilisation rate        (MVB). We can work more effec-
       for the energy and materials in the waste we treated is once       tively, pool our knowledge and
       again clearly documented by the 2019 operating results.            save costs by working more closely
                                                                         together, exchanging information
       MVR has been a partner of UmweltPartnerschaft Hamburg             and opinions, and by sharing staff
       (Hamburg Eco-Partnership) since 2003 through its volun-          in some areas. Closer co-operation
       tary services to environmental protection.                      will also help us in reaching our
          • EMAS environment management system                         environmental goals.
          • ISO 14001 environment management system

       Furthermore, since March 2013 MVR has been a member
       of the Partnerschaft für Luftgüte und schadstoffarme
       Mobilität (Air quality and low-emission mobility partner-
       ship). In this context, we would like to make an active
       contribution to reducing traffic-related air pollutants.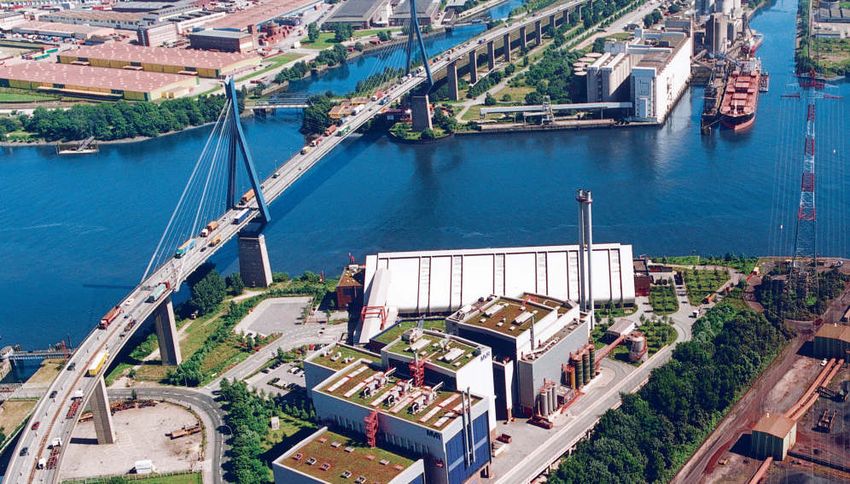
6
4
2
4
6
men p. 10
tion . 20
2
5
asp l p. 2
p. 2
p. 0
p. 0
.2
p. 2
p. 0
a p
p ro n t e e p
s
rt
i ve s
u ce
ve
s
r
t
ect
ta
e nv k a f t e
ork
at
cha
ro
men
ic d
ro d
te c
ect
tw
ra
mp
i ro n
Flow
gua
loo
Ba s
ep
obj
i ro n
plan
to i
at w
we
we
Our
E nv
ant
our
our
H ow
H ow
Wh
ew
H ow
at w
Wh
Safe working practices protect the workforce and the
environment. The employees are therefore repeated-
ly instructed on adopting a safety-conscious
approach and are regularly trained and briefed in
environmental awareness.
The environmental stewardship of MVR is manifested
in its strict observance of the binding obligations
(laws, directives, ordinances and the stipulations set
out in the permits). An operational supervision unit
has been put in place to ensure that this standard is
upheld, bringing a self-regulatory dimension in addi-
Our environ- tion to the oversight duties of the supervisory
mental policy: authorities. 3
Waste incineration The operational supervision unit checks and moni-
means offering a tors the impact of the plant on the surrounding envi-
viable and ecological ronment. Appropriate measures are taken to coun-
alternative to other meth- teract potential problems.
ods of waste disposal and The aim is to achieve a high level of plant availability
waste treatment. in order to make efficient use of materials and energy
Renewable raw materials account although the safety of the plant and the workers and
for more than 50 % of the residual the protection of the environment take precedence.
waste, therefore the provision of heat The environmental performance of MVR is subject to
and electricity can be a substitute for fos- a process of continuous improvement. Decisions
sil fuels, helping to protect the environment related to the environment can only be taken on the
and halt climate change. Internal consumption basis of a full examination of all the relevant factors.
of energy must also be minimised within the We also seek to exert influence on our business part-
bounds of economic feasibility in order to optimise ners to this end.
the external use of power and heat. MVR operates a policy of openness towards its own
In addition to the provision of usable energy, the employees, the public, industry professionals and
intention is to make products which can be largely the regulatory authorities (interested parties),
recycled in order to enable quality materials to be taking a proactive approach to providing
returned to the economy. Therefore the best avail- information.
able technology is used with due consideration for The environmental policy is regularly
economic efficiency. reviewed by the senior management
The organisational structure and schedule of respon- of MVR in order to accommodate
sibilities are designed to meet the economic aims of more recent insights or changes
MVR and its environmental targets in line with policy. to the regulatory or social
Suitably qualified and skilled staff are available. framework.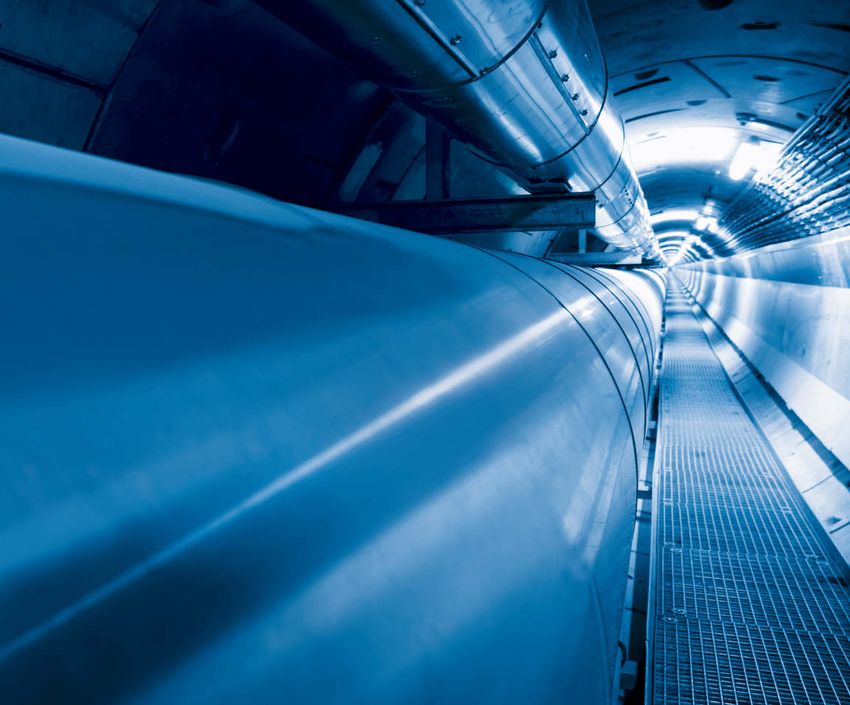
How our plant works:

      Releasing energy – recovering

4     Our plant is situated in the
      south-west of Hamburg, in the
      port area of Hamburg-Altenwerder.
      In the north, it is bordered by the Köhlbrand
      Bridge, in the east by the Köhlbrand basin, in
      the south by the site of port operator Hansaport
      Hafenbetriebsgesellschaft and in the west by the
      Rugenberger Damm embankment.

      A fold-out flow chart of the plant’s processes can    Any electricity produced
      be found on page 24.                                  which is surplus to own require-
                                                            ments is fed into the Hamburg grid.
      MVR is designed to handle a throughput of             Steam is tapped from the steam turbine
      approx. 320,000 Mg of municipal waste. Waste          for the plant’s own use (e. g. for heating or
      recovery is performed in two process lines, each      hydrochloric acid treatment) and, in par-
      with grate firing and a steam generator with a        ticular, for the supply of district heating
      waste throughput of 21.5 Mg per hour.                 (steam and heating water).

      The waste incineration process releases energy        To ensure a constant supply of steam
      in the form of heat in the flue gases. This heat is   to our industrial clients and, as of
      used to convert the boiler feed water (deminer-       October 2004, the supply of district
      alised water) in the steam generator into steam       heating, the plant operates two addi-
      which is then used in a steam turbine that is         tional auxiliary steam generators
      coupled with a generator to produce electrical        which are fired with natural gas.
      energy (power).
raw materials

 In parallel with waste incineration and recovery of energy, flue gas cleaning
 begins in the boiler by ensuring an optimum incineration process. The nitro-
 gen oxides are reduced by spraying ammonia water into the combustion
 chamber (SNCR method).
                                                                                          Flow chart (see p. 24)
 Each incineration/steam-generating process line has its own flue
 gas cleaning unit. Adsorbent that has already been used in bag
 house filter 2, but with a low uptake, is added to the flue gas
 leaving the boiler.

                                                                The adsorbent consists of a mixture
                                                              of 70 % trass and 30 % hearth furnace
                                                            coke. This mixture ensures that any heavy         5
                                                          metals and organic pollutants are separated.
                                                       In bag house filter 1, any residual dust particles
                                                     in the flue gas from the steam generator are
                                                   separated together with the adsorbent.

                                               In the next cleaning process, the flue gas passes through
                                             a 2-stage HCl-scrubber where process water is added to
                                          separate any readily soluble halogen compounds containing
                                        chlorine, fluorine, bromine and iodine. Any harmful gases are
                                      dissolved in many water droplets and thus separated from the
                                   flue gas.

                               The oxides of sulphur SO 2/SO 3 are separated by a neutral single-stage
                             scrubber. Here lime is used to bind the oxides of sulphur. The lime com-
                           bines with the sulphur compounds and part of the residual oxygen in the
                        flue gas to form calcium sulphate, commonly known as gypsum.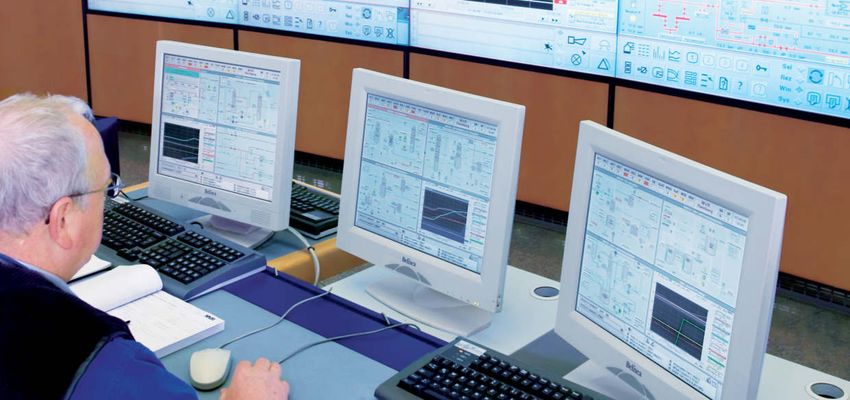
What we produce:

      For central heating – for domes

                        The energy released by thermal
                       recovery is used twofold: to gener-
                       ate heat and power. The quantity and
                      “quality” of the waste received play
                      an important role here.

                    To a large extent, residual waste
                    consists of combustible material and
                   therefore has a calorific value (energy
                   content) comparable to that of lignite
                  (brown coal). The steam generators in
                 the MVR plant are designed for waste
                 with calorific values ranging from 6.5 to
6               14 MJ/kg. For comparison: lignite has a
                calorific value of around 10 MJ/kg.

                The heat created by the incineration is used
               to produce steam from demineralised water.
               The MVR steam generators have a very high              Steam supplies: The steam is supplied to
              level of efficiency in comparison with other            industrial clients and households in the form
            systems because of the great extent to which              of process steam and heating steam. Uninter-
           the energy in the waste gas is utilised.                   rupted supply is contractually guaranteed. To
          In 2019 the MVR plant achieved an R1 energy                 meet this obligation, the plant has two auxiliary
         efficiency factor of 0.83 (cf. Annex II of                   steam generators on standby, each with a
         Directive 2008/98/EC, without climate-correc-                production capacity of approx. 20 MW (giving
        tion factor).                                                 about 25 Mg/h of steam).

      Overview of steam supplies                                      The quantity of heat supplied to our steam
       Year        Steam Heating water             Heat utilisation   clients largely depends on the customers’
                 supplied     supplied (usable heat as a percent-
                                         age of total energy input)
                                                                      production requirements and the weather.
                    MWh          MWh                             %
      2016      516,595           52,598                      53.1    The only way to improve the efficiency of the
      2017      507,781           46,944                      52.9    heat supplies is to reduce the input of primary
      2018      523,846           31,673                      52.3    energy (using less gas and more waste) and
      2019      523,392           18,699                      51.6    to level out demand by acquiring additional
                                                                      customers.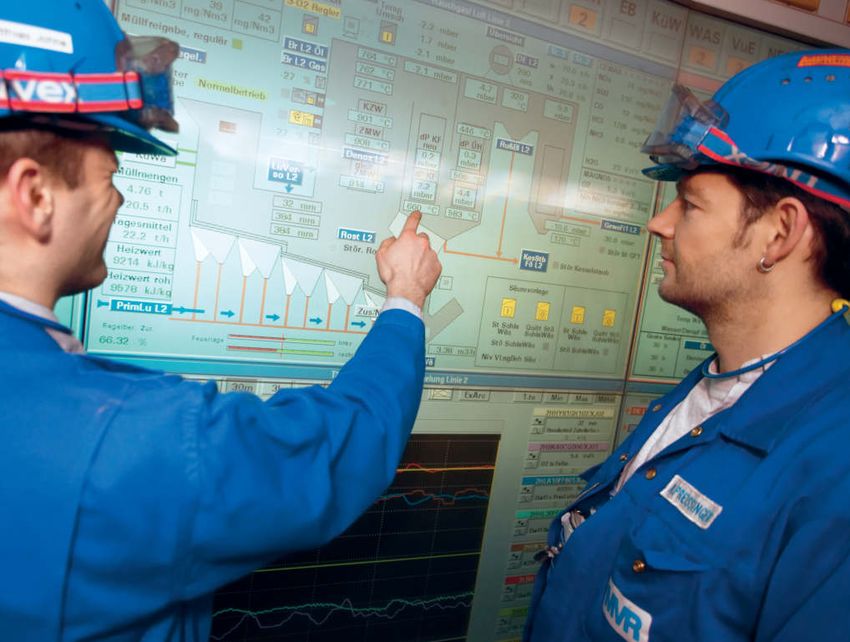
tic power

                                                                                                                                                            7

 Since autumn 2004, MVR has also been supplying             Simultaneous production of electricity (power)
 district heating in the form of hot water (heating         and heat is known as combined heat-and-power
 water) to an HanseWerk Natur supply area in                generation (CHP operation). In this mode gener-
 Harburg-Neuwiedenthal/Neugraben.                           ation of the two energy types, heat and power, is
 Approx. 18,700 MWh were produced in 2019. This             particularly efficient.
 brought the heat utilisation rate to 51.6%. Here,
 too, the customers want these heat supplies to
 be guaranteed by MVR’s auxiliary boilers as far
 as possible.

 Electricity generation: MVR’s extrac-         Overview of electricity consumption
 tion condensing turbine can generate a max-   Year       Total electricity Grid infeed / produced                            In-house       Electricity
 imum electricity output of 29 MW in                          production        by CHP generation                            electricity    purchased
                                                                                                                          requirements
 straight electricity generation, known as
                                                                        MWh                                  MWh                  MWh             MWh
 the condensing mode. During heat off-
                                               2016                   77,462                  36,131/27,076          1)
                                                                                                                                   43,815   2,485/1,0092)
 take, electricity generation is reduced to    2017                   70,619                  35,201/26,3361)                      43,683   8,265/3,6702)
 around 6 MW at maximum possible               2018                   80,857                 41,926/31,7031)                       42,866   3,934/2,0262)
 steam output.                                 2019                   83,531                  44,818/35,5111)                      41,661   2,893/1,5572)
                                               1) in accordance with the CHP Act of 1 April 2002   2) proportion from renewable energies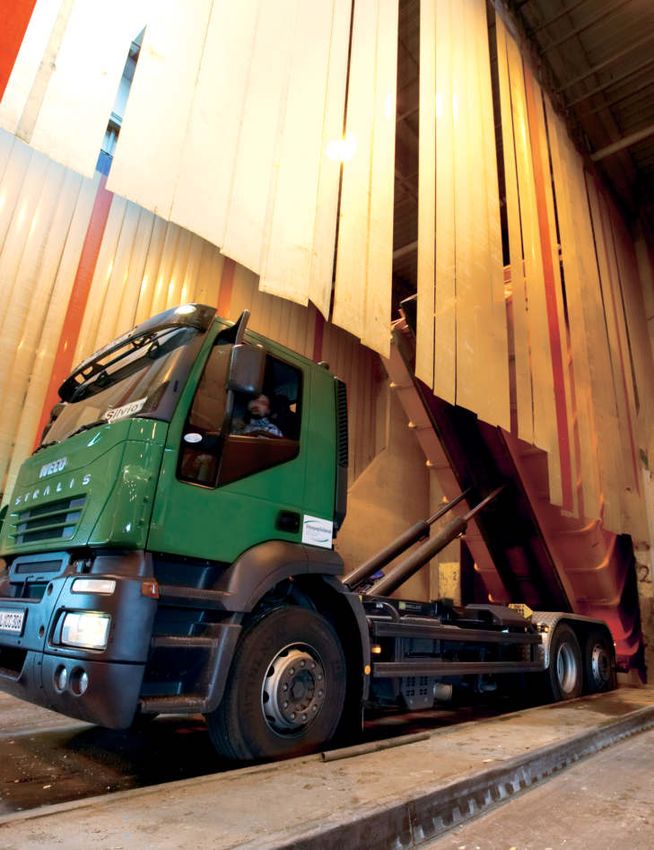
What we produce:

      For the construction sector                                                                                    –

      In addition to energy products in the form of power and heat, sub-           The slag complies with the rel-
      stances of commercially available quality are produced in the               evant technical guidelines and
      course of waste incineration and flue gas cleaning at MVR, name-            delivery conditions currently in
      ly slag, scrap metal, acid and gypsum.                                     force. It was also marketed in
                                                                                the year 2019 over the company
      Slag: After combustion, what is left on the grate are the non-           Hanseatisches Schlackenkontor
      combustible components of the waste plus the inert (no longer            GmbH (www.schlackenkontor.de)
      capable of reacting) materials produced during combustion, which        and is involved mainly in road and
      are known as slag or bottom ash.                                        path construction.

                                                                              The slag treatment separates
                                                                             the scrap iron and non-ferrous
                                                                            metals which can then be reused
8                                                                           as raw materials in smelteries. In
                                                                           the external slag storage facility,
                                                                           non-ferrous metals are again sepa-
                                                                          rated in a downstream non-ferrous
                                                                         metal separation of the already
                                                                         processed slag.

                                                                       Scrap iron: The scrap iron, separ-
                                                                       ated from the bottom ash using mag-
      The bottom ash is washed with additional water in the           nets, only contains very small amounts
      slag extraction unit to reduce the content of readily sol-      of bottom ash residues. The scrap
      uble salts. It is sifted, broken up and freed from             metal produced by MVR thus easily
      unburned components in order to produce a tested               meets the scrap metal industry’s purity
      and approved building material comparable to a mineral        requirements, which stipulate an iron
      mixture made from processed building rubble. The             content of more than 92 % for scrap from
      unburned components of the bottom ash are returned           waste incineration plants.
      to the waste bunker to pass through the incineration
      process once more.                                           Non-ferrous metals: An eddy-current
                                                                   process is used to separate, and thus
      The slag is of high quality as a result of the washing      recover, more than 90 % of the non-ferrous
      process in the extraction unit and its extensive            metals (not separable with magnets) from the
      mechanical treatment. The proportion of soluble            slag. These metals are mostly aluminium,
      minerals is comparatively low and the residual            copper and brass, but pieces of chromium
      separable metal content is close to 0 %.                  steel are also included. The mixed scrap goes
                                                               to an external company.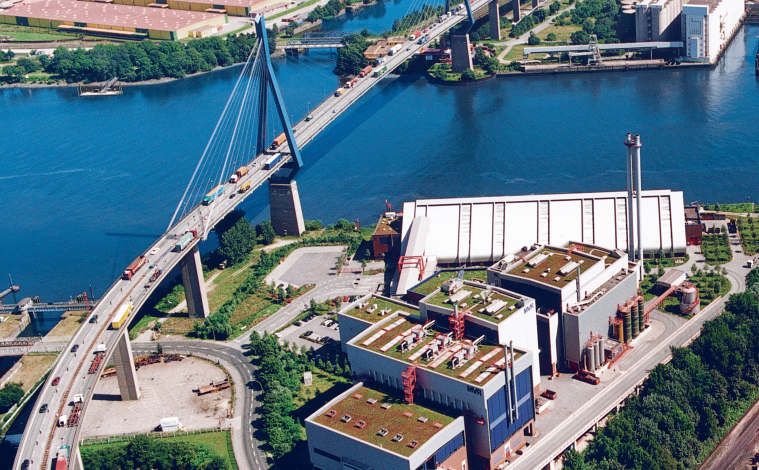
for industry

 Hydrochloric acid: The acid scrubbing process used in the flue gas treatment system
 produces raw hydrochloric acid (HCl) with a strength of 10 % to 12 %. This is sent
 to a rectifying unit (operated separately), where its concentration increases
 to 30 %. Various treatment stages remove chlorine as well as other halogen
 compounds such as bromine, iodine and fluorine, and also ammonia, partic-
 ulates, and other inorganic and organic impurities, after which HCl gas is
 produced from the pre-treated crude acid in a distillation process.
 Demineralised water is used to prepare hydrochloric acid with a
 concentration of 30 % from this HCl gas. Diligent operation of the
 rectifying unit and intensive checks mean that conformity of the
 hydrochloric acid to EN 939 can be guaranteed.

                                                                                                            9

                                                                                       By-products (see p. 24)

                                                   Gypsum: A gypsum suspension is removed
                                                 from the SO 2 scrubber and the gypsum is separat-
                                               ed from the suspension. The gypsum is then washed
                                            in a centrifuge to remove any readily soluble salts and
                                          then dried to a moisture content of less than 10 %.

                                      The quality of this gypsum is very high. Since our operations
                                    started, the parameters to be monitored have always been well
                                 within the values laid down in the Beckert Study for FGD gypsum
                               (gypsum from the desulphurisation units of power plants) and
                             natural gypsum. The gypsum which is generated corresponds to the
                           EUROGYPSUM quality criteria. The gypsum is supplied to the building
                         industry for manufacturing gypsum plaster.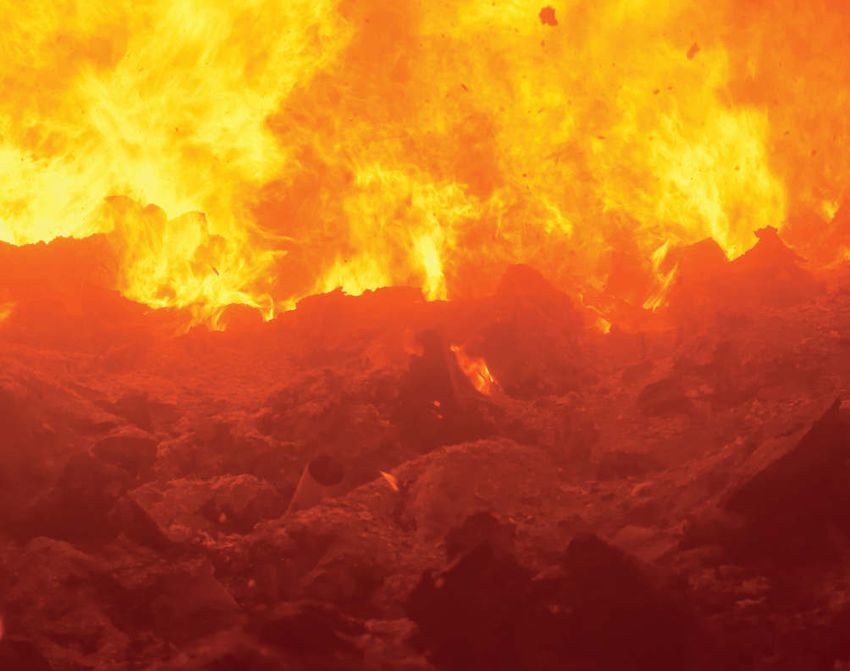
How we look after our environment:

      Waste incineration –
      the cleanest solution
      On 1 June 2005 a new law was introduced prohibiting the landfill of
      untreated waste. In our opinion, thermal recovery is an economical-
      ly and ecologically superior process offering the best alternative.
      Compared with mechanical-biological treatment or landfill, we
      find incineration in a plant such as MVR provides by far the most
      environmentally friendly method for the treatment and recov-
      ery of waste, and the cost is roughly the same.

      In 2019, MVR received some 342,614 Mg of non-hazardous
      waste which was subjected to thermal treatment, a figure
      well in excess of the 320,000 Mg per year contractually
      agreed with Stadtreinigung Hamburg (Hamburg’s munic-
      ipal refuse collection service).
10
      The quantity of waste received has progressed
      as follows:

       Waste received
       Year                    Waste
                             received
                                  Mg
       2016                  351,005
       2017                  349,879
       2018                  341,860
       2019                  342,614
Residual waste – reduction through concentration Thermal waste recovery cannot make every substance that is contained in the waste simply disappear. However, the pollutants can be concentrated into a small fraction of residual material that amounts to just below 2% of the original quantity of waste. The vast majority of the pollutants can be taken out of circulation in this way. We take great care in the profession- al and safe storage of these residual materials in underground areas. Particulates: The dust quantity deposited in the exhaust gas clean- ing, with a value of 28 kg/Mg waste, is at the same level of the pre- vious year (28 kg/Mg). All of the particulates were used as backfill material in salt mines, and thus recovered. Mixed salts: The hydrochloric acid rectification unit produced mixed salts in aqueous solution (brine with a concentration of 11 20 %). These composite minerals remove halogens such as bromine, iodine, fluorine and also ammonium compounds from the materials cycle and they are then safely deposit- ed in scoured-out salt caverns. Raw acid: The availability of the HCl rectification unit in 2019 was generally sufficient. Nevertheless, due to fairly extensive repair work, around 2,300 Mg of raw acid had to be disposed of. Pollutants: The organic pollutant dioxin is ini- tially destroyed by incineration, but dioxins are later partly reformed in the boiler. These are Residual waste (see p. 24) removed in the flue gas cleaning process.
How we look after our environment:

      Emissions –
      we’re doing fine
                      The emissions are still very low. A large part of the measured values are
                     below the relevant detection limit. In 2019, both the emitted loads and the
                    specific (volume-related) values were again well below the permitted val-
                    ues (see table). The utilisation rate of the permitted loads was between
                   0.1 % (PCDD/F) and 89 % (nitrogen oxide).
                  It is to be considered that the limit values of the MVR are in-part significant-
                 ly below the values of 17. BImSchV prescribed by law.
                 The somewhat higher SO2 values from 2015 can be attributed to experiments in
                power saving. In the meantime both lines have each been equipped with an SO2
                washer pump with frequency converter. First a control value of 8 mg/Nm3 was adju-
               sted in the cleaned gas in order to determine under which conditions this conversi-
              on brings about the required success. In discussion with the monitoring authority, the
              control value was then lowered to 5 mg/Nm3 for a longer experiment. With this opera-
12           ting mode, over 500 MWh current per line can be saved with continued secure compli-
            ance with the limit values. Meanwhile this operating mode has been authorised by govern-
            ment authorities for continuous operation.

            Although the statistics are good, it is inevitable that limits will sometimes be exceeded for
           short periods. This can be due to various reasons, such as poor-quality waste, breakdown of
           components or (in rare cases) operating errors.
          The number of such incidents has dropped significantly in recent years as a result of contin-
          uous process improvement and training sessions for the crew with specific goals in mind.
         In 2017 99.997 % of the half-hour average values were adhered to; in 2018 it was 99.999 % and
        in 2019 it was 99.997 %.
        See our homepage (www.mvr-hh.de) for a detailed account of MVR’s emissions in the last few years.
Emission loads
Year NOx 1) CO SO2 Dust Ctot HCI HF NH3 Cd/TI Hg Sb,...,Sn PCDD/F As,...,BaP
kg kg kg kg kg kg kg kg g g kg mg kg
Annual load3) 2019 139,464 15,884 9,054 1,706 209 1,390 45 566 0.00* 0.00* 8.4 0.08 1.9
Limit value (annual load) 157,542 78,771 23,631 4,726 12,603 4,726 158 - 3,150 31,510 79 79 792)
Utilisation of the load 2015 86.6% 29.1% 33.6% 7.6% 4.3% 18.7% 32.4% 25.2% 1.1% 14.7% 0.3% 2.9%
limit value 2016 89.2% 32.9% 24.8% 15.1% 3.5% 12.9% 27.2% - 25.1% 1.1% 13.8% 0.2% 2.9%
2017 87.4% 29.6% 22.6% 22.8% 3.6% 9.5% 33.5% - 24.8% 1.1% 13.8% 0.6% 2.8%
2018 88.7% 24.8% 34.0% 39.3% 1.6% 28.3% 32.0% - 25.2% 1.1% 18.6% 0.4% 3.4%
2019 88.5% 20.2% 38.3% 36.1% 1.7% 29.4% 28.6% - 0.0* 0.0* 10.7% 0.1% 2.5%
1) including auxiliary steam generators 2) limit value according to the 17th Emission Control Ordinance 3) From 2012: determination of mass flows with nonvalidated values
Emission concentration
mg/Nm3 mg/Nm3 13
200 10 Permissible limit value
according to the 17th Emission
100 94 5 Control Ordinance
Limit-value permission:
80 1.2
daily mean values (DMV) or
mean value of samples (MVS)
60 0.9 0.8
Values measured in 2016–2019
0.6
40 0.6 (2019 also stated in figures).
20 0.3 * Value=0.0 if the measured value
is below the determination limit.
7.3 0.11
5.5 0.03
0 0
NOx CO SO2 Dust Ctot HCl HF
(DMV) (DMV) (DMV) (DMV) (DMV) (DMV) (MVS)
mg/Nm3 mg/Nm3 ng/Nm3 µg/Nm3
0.5 10 0.1 50
0.1 0.6 0.06 3
0.05 0.5 0.05 2.5
0.04 0.4 0.04 2
0.35
0.03 0.3 0.03 1.5 1.4
0.02 0.2 0.02 1
0.01 0.1 0.01 0.5
0.06
0.0000* 0.0000*
0.0001
0 0 0 0
Cd/TI Hg Sb,...,Sn NH3 PCDD/F As,...,BaP
(MVS) (MVS) (MVS) (Dioxine, Furane) (MVS)
(MVS)How we look after our environment:
Overview of energy
consumption –
utilisation instead of wastage
In 2019, MVR used some
9,670 MWh of heating oil/ nat-
ural gas in the waste boilers
and about 16,900 MWh of natu-
ral gas in the auxiliary steam
generators to provide process
steam and hot water for their
customers.
The requirement on primary energy is
basically influenced by the take-up of
the customers, by the weather and by
14 the time availability and performance
availability of the garbage vessels.
Primary energy
Year Waste Auxiliary steam Total
boilers generators
MWh MWh MWh
2016 7,800 46,100 53,900
2017 9,030 34,300 43,330
2018 7,340 26,050 33,390
2019 9,670 16,850 26,520
For various reasons, MVR has to use primary energy – The high time and capacity availability
fuel oil/natural gas – in addition to waste. of the waste-fired boilers has made a
Primary energy is used intermittently in the waste-fired significant contribution to the saving of
boilers in order to ensure the minimum combustion primary energy.
temperature even in unfavourable conditions. And
natural gas is also used in the auxiliary steam gener- In-house steam consumption
ators if the energy acquired from the waste does Year In-house steam
not suffice in order to supply the district-heating consumption
MWh
customers of the MVR on cold days.
2016 105,862
2017 112,089
2018 117,125
2019 101,988Use of Operational resources (see p. 24)
operational resources –
less is more
The use of vital operational resources, i. e. materials that are neces-
sary to operate the plant and to improve the production yield, is
similar to that in previous years. The fluctuations are mainly due to
the different compositions of waste and the quality of the water from
the River Elbe.
Other operational resources *
Year Activated Aluminium Calcium Iron Sodium Hydrochloric
charcoal chloride chloride chloride hydroxide acid 1)
Mg Mg Mg Mg Mg Mg
2017 8 132 5 28 468 914
2018 8 150 5 43 564 1,062
2019 19 124 9.6 30 635 986
* annual amounts received 1) from MVR’s own HCl production
15
CO 2 –
saving where we can
Approximately 50% of municipal solid
waste is derived from biogenic sources
(National Inventory Report published by the
Federal Environment Agency (UBA)). Since MVR
makes optimum use of the energy released by
waste incineration, the consumption of primary ener-
gy is correspondingly reduced.
MVR’s auxiliary steam generators must comply with the
Greenhouse Gas Emissions Trading Act. For the third period of
operation from 2013 to 2020, MVR receives 62,348 certificates
(1 certificate corresponds to 1 Mg CO2) in total1). In 2019 3,283 of
these were required.
1) 7,682 certificates were issued in 2016. Each year, the number decreases due to corrective factors to 7,038 in 2020.How we look after our environment:
Water –
every drop counts
Drinking water: In 2019, MVR purchased 489 m 2 of drinking water, mainly for sanitary purposes,
most of which was released into the sewage network of Hamburg’s municipal sewage system.
Rainwater: In 2019, approx. 12,700 m 3 of rainwater were collected from roofs and traffic
areas for use as process water, e. g. for slag washing or flue gas cleaning.
Water from the River Elbe: There are strict regulations regarding the amount of water
MVR can extract from the Elbe for use as cooling water in its turbine condensers. The speci-
fied amount of water may only be heated by max. 6.0 °C in the summer* and by max. 7.5 °C
in the winter* and must not exceed the temperature of 28 °C when discharged back into the
river. The MVR complied with regulations: in 2019, the cooling water throughput amount-
ed to approx. 27.8 million m3 of river water, only about 70% of the quantity * permitted.
The max. heating in summer operation was 5.8 K and in winter operation was 7.3 K.
16 The oxygen content of the water is increased close to saturation limit by way of cas-
cades in the outlet structure. Boiler feed water for steam generation has to be fully
cleaned and demineralised. The water for this is taken from the cooling-water flow
and treated. After using the heat from the steam supplied, our customers return
about 60 % as condensate which is then treated and reused. In 2019, around
389,000 m 3 of water from the Elbe had to be cleaned and demineralised to
compensate for the loss. The process of neutralising the minerals and pollu-
tants produces neutralisation waste water in the water and condensate-
treatment plant. The plant was enlarged in 2004 to reduce the concentra-
tion of pollutants in the water (in particular, filterable substances). In 2019,
around 41,300 m 3 of treated waste water from the neutralisation process
was channelled into the Elbe.
* Amended water law permit
Summer operation: 01.04 — 30.11
Winter operation: 01.12 — 31.03
Quantity again reduced by a third
Monitoring values as sliding 6-hour average values
Water collection
Year Rain Water from the Elbe Public Waste water 1)
water Cooling of which boiler Fire extinguishing water/ water supply Cooling Neutralisation
water feed water process water Drinking water water waste water
m3 m3 m3 m3 m3 m3 m3
2017 16,163 27,162,271 372,462 75,359 1,500 26,789,809 34,869
2018 8,894 31,930,104 408,898 73,591 282 31,521,206 50,945
2019 12,703 27,802,000 388,879 141,572 489 27,413,000 41,257
1) directly channelled into the KöhlbrandNoise pollution and
operational disruptions –
all under control
17
MVR is located in the heart of Hamburg’s port area.
The noise level in the vicinity of this industrial area, where there is a large amount
of traffic, is relatively high. MVR complies with all the relevant noise level limits
along its site boundaries. The Workplace Ordinance relating to areas within the site
is also strictly adhered to. In the few parts of the plant where soundproofing is
restricted by technical limitations, either soundproof casing has been fitted or else
hearing protection is mandatory for employees.
Operational disruptions can have adverse effects on the environment. In 2019
there were 7 operational interruptions in all, 2 of which were scheduled stop-
pages (overhaul) and 5 unplanned stoppages for various reasons. None of the
operational disruptions were malfunctions as defined in the Statutory Ordinance
on Hazardous Incidents, and none of them had any effects on the area outside
of the plant premises. Dealing with the effects of the disruptions caused no prob-
lems. There were no serious work-related accidents.How we look after our environment:
Flora and fauna –
protecting biotopes
Obviously the con-
struction of MVR’s
plant had an ad-
verse effect on the
flora and fauna on the
site during the building
phase. Approx. 43,870 m2
were sealed through build-
ings and traffic areas.
MVR has created green
spaces on the undeveloped
areas of the site to compensate
18 for this and has planted vegeta-
tion on approx. 7,000 m 2 of roof
space. As an additional measure,
MVR has purchased a 13-hectare site
(Höfnermoor) about 4 km south of
the plant and restored it to its original
marsh-like condition.
A major finding of the expert appraisal of
the compensatory measures, which was
carried out in recent years and completed
in 2005, was that the substitute area had
developed favourably. The measures for improve-
ment stipulated in the final report will be carried
out on an ongoing basis.
Area consumption
MVR of which of which Near-natural areas
grounds sealed near-natural away from MVR
m2 m2 m2 m2
61,600 43,870 17,730 132,500Establishing connections –
having an influence
In addition to the environmental effects described above that are directly attributable to MVR, its
operations also have indirect environmental effects. An overall examination of the environment
was therefore carried out as part of MVR’s approval application. On this basis, MVR continually
pursues all the environmental aspects of its operations in accordance with the EU directive.
a) Directly attributable environmental aspects are assessed on an annual basis and their
development is continuously monitored.
b) The indirect environmental aspects include the quality of the products and of the waste
which can for the most part be marketed. Only if the materials delivered by MVR meet the
required quality criteria can natural resources be spared. The recycling should not entail a
concentration of harmful substances in the recovered substance cycle. High quality stan-
dards are demanded of our materials in the light of this aspect. They are subject to ongo-
ing quality control. The marketing and handling of the proper disposal of the residual 19
materials are organised by an externally accredited company, enabling the benefit of
experience and the exploitation of synergies.
The philosophy adopted for the procurement of operating resources is similar. Any by-
products from other production processes or treated substances which are available
are used if they are of the requisite quality (e.g. ammonia water, heating oil). We are
constantly searching for alternatives to hazardous substances. In this respect we
also try to encourage environmentally responsible behaviour and production
processes in the companies with which we work.
Another aspect of indirect environmental relevance is the noise nuisance caused
by delivery vehicles coming onto the site. The main delivery service provider, the
Stadtreinigung Hamburg municipal refuse collection authority, claimed that all
its vehicles are low in noise and pollutant emissions.How we guarantee protection:
Management system – organisi
20
Level 1
At MVR, under the motto “Action, not reaction” we Principles; integrated management; environmental
take an active part in environmental protection, protection policy, objectives, and programme;
making a significant contribution to preserving regulated structures and processes; assignment
the natural basis of life and to making our com- of responsibility and authorisation.
pany a safe place. To reach this goal, MVR has a
unified management system that is under con- Level 2
stant development and takes into consideration Operating and shift-related instructions; instruc-
the requirements concerning environmental tions on action in the event of malfunctions;
protection, health and safety at work, and risk detailed regulations concerning work routines
management as it performs its duties. All our and action.
employees are actively involved in our environ-
mental protection and health and safety activities. We regularly conduct environmental company
There are two levels at which the company ensures audits during which we assess the application
that the statutory, regulatory and corporate and effectiveness of our system, our compliance
requirements are adhered to. with legal requirements and the achieved envi-
ronmental performance.ng success
21
The technical director is wholly responsible for The Head of Operational Quality Control is assisted
MVR’s environmental protection. He is responsi- by the Safety Engineer, who also observes the
ble for the development and application of, as tasks of an Environmental Management Agent.
well as compliance with, the binding obligations,
applicable in environmental protection, as well as Other staff members have been appointed to
in the area of occupational safety. The director oversee radiation protection and health and
delegates important executive duties in this field safety at the workplace.
to the Head of Operational Quality Control. As
the Environmental Management Officer working MVR has outsourced the responsibilities for dan-
in accordance with DIN ISO 14001 and the EMAS gerous goods.
III regulation, he is responsible for implementing,
maintaining and developing the environmental Committees meet to discuss and monitor the
and safety management system. He performs the effective execution of these duties and ensure
statutory duties as the company officer responsi- that the staff and works council are involved.
ble for waste, emission protection and water pol-
lution prevention, and coordinates the tasks per-
formed by outside contractors.What we want to improve:
Environmental objectives –
doing our homework
MVR already meets the highest environmental standards. However, we do not cease to
strive for even better environmental compatibility. Our environmental targets and pro-
gramme will continue to be updated every year.
Emissions
Combustion Line 1 has higher clean gas dust values than Line 2. Overall the dust values are
slightly increasing but are still well below the limit values. This is an indication of material
fatigue of the fabric filter bags on the fabric Filter 2. The previous hoses made of needle felt
should therefore be replaced by membrane hoses made of Teflon, as these have a lower dust
slip (high level of sealing) and should be more durable. Line 1 will be started first.
(2020-2021, maintenance, 150 Te per line)
The following projects were completed in 2019
22 Energy saving
Operation of the SO 2 scrubber pump by means of a frequency converter: After successful test
runs on both combustion lines with frequency converter controlled SO 2 scrubber pumps, the
power consumption could be significantly reduced (approx. 500 MWh per pump/a). The operation
mode was approved for continuous operation.
In addition, flow-optimised nozzles were installed in the HCl scrubbers to reduce the circulation
volume required to separate the noxious gases. As a result, smaller pump impellers could be used,
which means lower power consumption for the pump motors.
The savings potential here is about 36% per scrubber, which corresponds to approx. 880 MWh el/a.
Recording of all essential compressed air consumption quantities: There was insufficient information
about the actual compressed air consumption of various plant components and aggregates. To record
the consumption quantities, the various distribution lines were measured and evaluated in order to
identify possible savings potential. Over the last four years, corresponding projects have reduced
compressed air consumption by almost 50%. No further savings potential is currently apparent.Environmental aspects
Our environmental
performance at a glance
The following table contains the most important key indicators for 2014 to 2018 in accordance
with EMAS III.
Energy efficiency 2015 2016 2017 2018 2019
Steam and hot water supplied (MWh/Mgwaste) 1.6 1.6 1.6 1.6 1.6
In-house steam consumption (MWh/Mgwaste) 0.30 0.30 0.32 0.34 0.30
Primary energy input (fuel oil/natural gas) (MWh/Mgwaste) 0.12 0.15 0.12 0.10 0.08
Electricity production (MWh/Mgwaste) 0.23 0.22 0.20 0.24 0.24
In-house electricity consumption (MWh/Mgwaste) 0.13 0.12 0.12 0.13 0.12
Proportion of electricity consumption (%) 32.8 40.6 44.4 44.4 53.8
from renewable energies
Material efficiency
Ammonia water (kg/Mgwaste) 2.4 2.4 2.5 2.6 2.8
Adsorbent (kg/Mgwaste) 1.8 1.8 1.8 2.1 2.2 23
Quicklime (kg/Mgwaste) 1.5 1.4 1.4 1.5 1.6
Sodium hydroxide (kg/Mgwaste) 1.6 1.5 1.3 1.6 1.9
Hydrochloric acid (kg/Mgwaste) 2.7 2.7 2.6 3.1 2.9
Water
Consumption of cooling water (m3/Mgwaste) 81 76 78 93 81
3
Consumption of water from the Elbe (m /Mgwaste) 1.4 1.1 1.1 1.3 1.4
By-products/waste
Slag (kg/Mgwaste) 199 216 201 217 204
Boiler particulates (kg/Mgwaste) 13 13 14 14 14
Filter particulates (kg/Mgwaste) 13 13 14 14 14
Biological diversity
Area used (developed) (m2/Mgwaste) 0.13 0.13 0.13 0.13 0.13
Emissions
CO2 emissions * Mg 322,524 338,203 338.927 347,474 354,030
(kg/Mgwaste) 929 964 969 1,016 1,033
SO2 emissions (kg/Mgwaste) 0.023 0.017 0.015 0.024 0.026
NOx emissions (kg/Mgwaste) 0.393 0.400 0.393 0.409 0.407
Particulate emissions (kg/Mgwaste) 0.0010 0.0020 0.0030 0.0054 0.0050
* 50% of which has no impact on climate change, in relation to the waste (NIR UBA (National Inventory Report published by the Federal Environment Agency))
CO2 calculation for municipal waste, natural gas and heating oil with reference to emission factors, cf. https://wiki.prtr.bund.de/wiki/Emissionsfaktoren.
Other substances identified as greenhouse gases, such as CH4, N20, hydrofluorocarbons, perfluorocarbons and SF6, are not relevant.Flow chart:
p. 15 Operational resources *
Year Ammonia Boiler feed Quicklime Adsorbent
water water
Mg Mg Mg Mg
2016 847 375,305 474 634
2017 873 372,462 481 633
2018 897 408,898 527 707
2019 951 388,879 548 767
* annual amounts received
Process steam/industrial steam/heating water
Turbine
Boiler feed
Ammonia water
water Electricity
Cleaned gas
p. 5 Flow chart
Adsorbent
Waste Adsorbent Water Milk of lime
Boiler from quicklime
from bag house
filters 2
SNCR
Flue
Bag
house
filter 1 HCl
Grate scrubber SO2
scrubber Bag
Induced
draught 24
house
filter 2
Bottom ash HCl
treatment treatment Gypsum
treatment
Returned to
bag house filter 1
p. 8/9 By-products **
Year Slag Scrap Hydrochloric Gypsum
metal acid
Mg Mg Mg Mg
2016 75,932 10,387 4,240 769
2017 70,309 10,452 3,863 670
2018 74,057 10,202 4,141 768
2019 69,917 10,061 3,972 822
** annual amounts delivered Non-ferrous from reworking: 2015 303 Mg
p. 11 Residual waste**
Year Boiler Filter Mixed
particulates particulates salts
Mg Mg Mg
2016 4,779 4,779 2,285
2017 4,846 4,846 2,457
2018 4,782 4,782 2,266
2019 4,753 4,753 2,275
** annual amounts deliveredBasic data
Quantity of waste received norm. Mg/h 2 x 21.5 Steam generator
max. Mg/h 2 x 23.0 Flues 4
Calorific value range kJ/kg 6,500–14,000 Steam Mg/h 72
Auxiliary fuel: natural gas/fuel oil Steam pressure bar 44
Waste delivery weekdays 0–24 h Temperature °C 400
Number of trucks per day approx. 150 Flue gas exhaust temperature °C 170
Combustion air system
Supplies to the plant Primary air (max.)
Secondary air (max.)
Nm3/h
Nm3/h
67,186
48,761
Tipping hall
Length m approx. 51 Turbine
Width m approx. 33 District heat offtake max.:
Height (roadway height) m NN approx. 20 District heat MW 70
Number of tipping bays 12 Electricity (gross) MW 6
Electricity offtake:
Waste bunker District heat MW 0
Length m approx. 50 Electricity (gross) MW approx. 29
Width m approx. 20 Plant use MW approx. 5
Storage height (max.) m approx. 30
Floor thickness m NN 0
Storage volume m3
approx. 20,000 Flue gas data at flue
related to normalised dry conditions and to oxygen
Waste bunker – mechanical equipment content of operation 25
Cranes Number 2
Volume flow (design) m3/h 80,000
Type/working load –/Mg Polyp/4.5
Oxygen content (design) % bV 8.5
Bulky-waste shredders Number 1
Process O2 % bVAudited – certified
Declaration of the environmental verifier on the audit and validation actitvities (in accordance
with Regulation (EC) No. 1221/2009 taking into consideration the Ordinance (EU) 2017/1505
dated 28.08.2017): The undersigned, Stefan Krings EMAS Environmental Verifier with the registra-
tion number DE-V-0168 accredited or authorised for 38,2 (NACE code), (waste treatment and dispos-
al), here with confirms that he has verified that the organisation as stated in the updated 2020
Environmental Statement of Müllverwertung Rugenberger Damm GmbH & Co. KG Rugenberger
Damm 1, 21129 Hamburg, registration number D-131-00027, has fulfilled all the requirements of
Regulation (EC) No. 1221/2009 taking into consideration the Ordinance (EU) 2017/1505 dated
28.08.2017 of the European Parliament and the Council of 25 November 2009 concerning the volun-
tary participation of organisations in a joint Eco-Management and Audit Scheme (EMAS) system.
The signature on this Declaration confirms that
• the audit and validation was carried out in complete compliance with the requirements of
Regulation (EC) No. 1221/2009 taking into consideration the Ordinance (EU) 2017/1505
dated 28.08.2017,
• the findings of the audit and validation confirm that there was no indication of
any deviations from the relevant environmental regulations,
• the data and information of the updated 2020 Environmental Declaration
of Müllverwertung Rugenberger Damm GmbH & Co. KG provide a reli- 26
able, credible and correct view of all the organisation’s activities
within the areas stipulated in the Environmental Declaration.
Ratingen, signed on 1-April-2020
This Environmental Statement was issued by
MVR Müllverwertung Rugenberger Damm GmbH &
Co. KG in April 2020 and declared valid by the accred-
Stefan Krings ited environmental verifier. The next consolidated
Accredited Environmental Statement is expected to be presented in 2021.
environmental verifier
Contacts:
(DE-V-0168)
Graduate in Business Dr.-Ing. Martin Reymann
Management, Jörg Mischer Technical Director
Commercial Director Tel.: +49 (0) 40/741 86-100
Tel.: +49 (0) 40/741 86-300
Dipl.-Ing. Markus Steinmeister Dipl.-Ing. Matthias Seiffert
VALIDATED
Works Manager Head of Operational Quality Control
INFORMATION
REG.NO. D-131-00027 Tel.: +49 (0) 40/741 86-102 Tel.: +49 (0) 40/741 86-10427
MVR MÜLLVERWERTUNG RUGENBERGER DAMM GmbH & Co. KG
               Rugenberger Damm 1 • 21129 Hamburg • Germany • Telephone: +49 (0) 40/741 86-100
E-mail: mvr@mvr-hh.de • www.mvr-hh.de • within the Vattenfall Europe New Energy GmbH association
You can also read