SUSTAINABLE ALTERNATIVES FOR ELECTRIC POWER GENERATION - in the Upper Paraguay Basin (BAP)
←
→
Page content transcription
If your browser does not render page correctly, please read the page content below
EXECUTIVE
SUMMARY
  BR

2020

       SUSTAINABLE ALTERNATIVES
       FOR ELECTRIC POWER GENERATION
       in the Upper Paraguay Basin (BAP)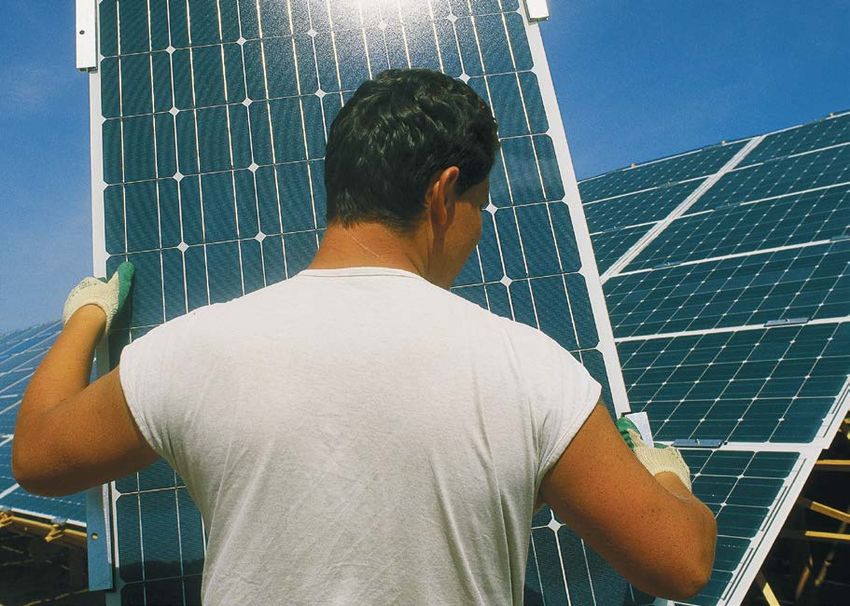
WWF-BRAZIL

Executive Director: Mauricio Voivodic

Green Economy Director: Alexandre Prado

Cerrado and Pantanal Manager: Julio César Sampaio

TECHNICAL TEAM:

Text: Aurélio de Andrade Souza (Usinazul) and Luís Gustavo
Tudeschini, Ph.D

Technical Review: Alessandra Mathyas; Breno Melo and Ri-
cardo Fujii (WWF-Brazil)

Editing and proofing: Davi Miranda

Desktop Publishing and Image Processing: Supernova Design

Cover Photo: Regina Alves – Concurso Áreas que Protegem a
Vida – Pantanal /WWF-Brazil

Acknowledgments: Profa. Dra. Suani Teixeira Coelho,
Dra. Marilin Mariano dos Santos e Dra. Vanessa Pecora
Garcilasso, from the Bioenergy Research Group (GBio)
of the University of São Paulo (USP)

This report is a product of WWF-Brazil, prepared as part of the sudy “Evaluation of the Replacement of Hy-
droelectric Projects in the Upper Paraguay Basin (BAP) by Renewable Electricity Generation Alternatives in the
States of MT and MS”.
SUSTAINABLE ALTERNATIVES
FOR ELECTRIC POWER GENERATION
in the Upper Paraguay Basin (BAP)

                    Brazil

                    2020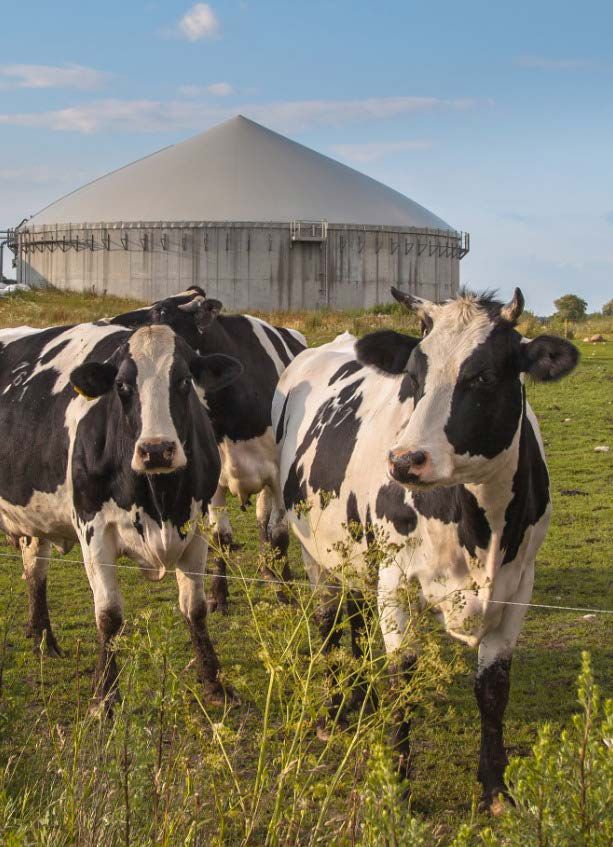
SUMMARY

1. INTRODUCTION                                                                 6
2. Electric power generation in Brazil                                         10
2.1. Hydroelectric power generation in the hydrographic region
     of Paraguay (RH – Paraguay)                                               14
3. Sustainable alternatives for electric power generation                      16
3.1   Solar energy                                                             18
3.2   Sugar cane biomass                                                       25
3.3   Urban solid waste – USW                                                  28
3.4   Wastewater treatment                                                     30
3.5   Job creation                                                             37
4. Combining alternatives for electric power generation – 2030                 40
References                                                                     44
Annex: Methodology                                                             48
1. Calculation of potential of electric power generation in MT and MS states   50
1.1 Photovoltaic                                                               50
1.2 Sugar cane                                                                 52
1.3 Urban solid waste (USW) in the states of MT and MS and the potential for
    electric power generation                                                  54
1.4 Wastewater treatment                                                       55
1. INTRODUCTION

Foto: © ABiogás
1. Introduction
Today, there are over 125 hydroelectric power projects under study in
Paraguay’s hydrographic region. Most of them are small hydro (PCHs)
projects. Data from the Water Resources Planning of Paraguay River
Hydrographic Region (PRH – PARAGUAI) show that the explored
hydropower potential of the area has a capacity today of 1.2 GW.
(ANA, 2018).
Upper Paraguay Basin (BAP) encompasses an area of 1,100,000 Km2, including
the biomes of Pantanal and part of Cerrado. The Hydrographic Region is 4.3% of
the Brazilian territory (363,446 km²), including parts of Mato Grosso and Mato
Grosso do Sul, the largest part of Pantanal (61% of total), world’s largest wetlands.
The main watercourses are Paraguai river, Taquari, São Lourenço, Cuiabá, Itiqui-
ra, Miranda, Aquidauana, Negro, Apa and Jauru. (ANA, 2018) 1.
Picture 1 – Map of the Hydrographic Region of Paraguay. Source: ANA, 2018.
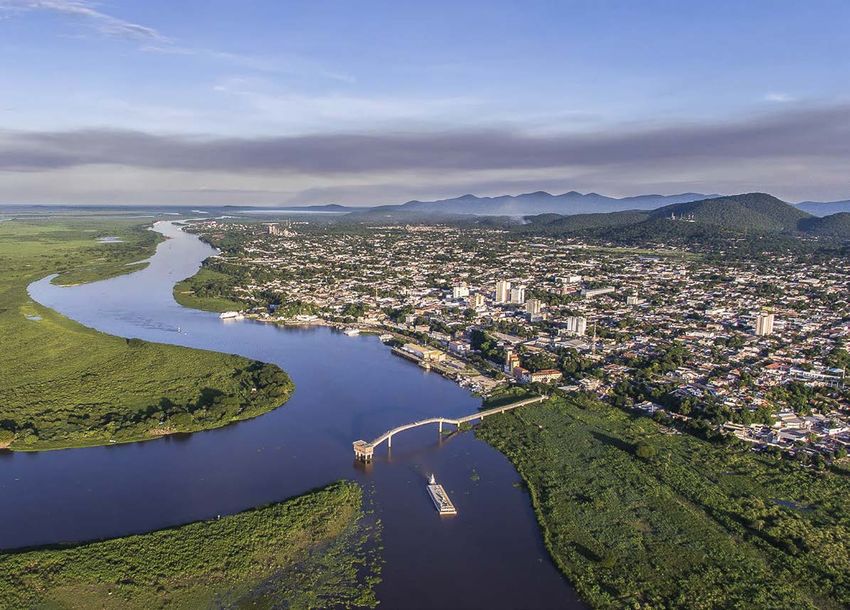
The area where BAP is located has a high rainfall index, and Pantanal is the world’s
largest wetland, regulating the flow of Paraguay river. The generation of hydro-
electric power energy at BAP is one of the activities that may cause a drastic im-
pact in the rivers of the basin.
1 http://www3.ana.gov.br/portal/ANA/noticias/ana-interrompe-temporariamente-conces-
sao-de-outorgas-para-novas-hidreletricas-na-regiao-hidrografica-do-paraguai
8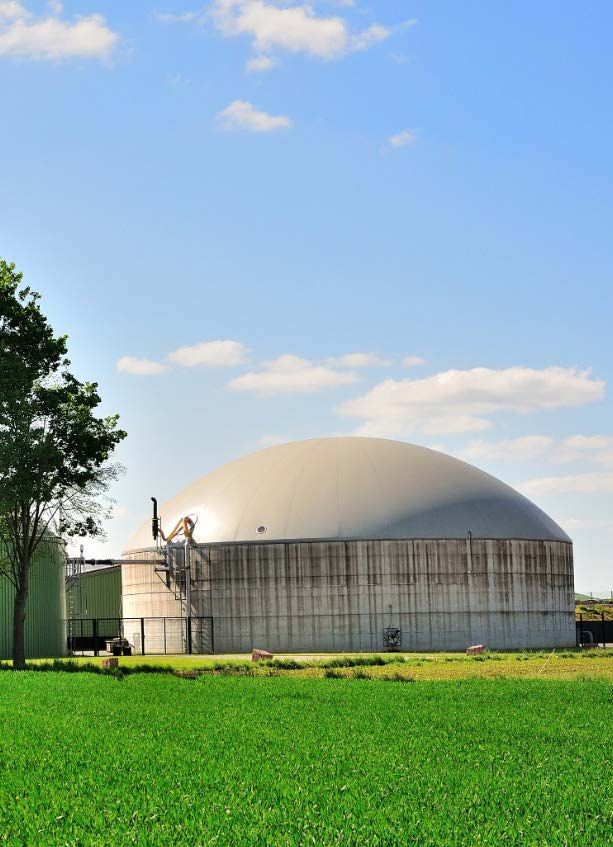
According to PRH-Paraguai, the main issue with hydroelectric power projects
are the socioeconomic impacts (specially fishing and tourism), caused by changes
in watercourses and decrease in water quality, “creating challenges to ensure its
multiple use, which requires incorporating constructive and operative specifici-
ties in future projects, besides rigorous environmental impact studies within its
licensing”.

Pantanal area is very sensitive to hydro projects due to its geographical and en-
vironmental unique characteristics. According to PRH-Paraguay, the “threats to
water resources not always have a direct measurable impact due to diffuse and sys-
temic effects, but it’s acknowledged they affect quantity, quality, regime or access to
water” and mostly “involve situations of environmental degradation”.

One of PRH-Paraguai first recommendations is the incorporation of “constructive
and operative specificities in the studies and projects for hydroelectric power us-
age aiming to minimize possible impacts and preservation of local environment”.
Besides, PRH-Paraguai recommends the energy sector to consider the current re-
sults obtained by Brazilian National Water Agency to evaluate the effects of im-
planting these hydroelectric projects in BAP, in a way that the conclusions meet                            THE HYDROGRAPHIC
the society’s needs, providing the best energy use possible.                                                REGION IS
Within this context, WWF invited specialists in the subject, with focus on non-hy-
dro renewables, to analyze the potential of other sources of clean energy that could
be promoted and used in the states of MS and MT, guaranteeing the energy supply
                                                                                                            4.3%
as stated in the 10-Year Energy Expansion Plan. The sources considered were solar
photovoltaic energy, sugar cane biomass energy, urban solid waste energy (spe-
                                                                                                            THE BRAZILIAN
cially from the two main cities in the region, Cuiabá and Campo Grande), besides
sanitary sewers and animal waste.
                                                                                                            TERRITORY
                                                                                                            INCLUDING PARTS OF
This study considers only these Brazilian states and their energy demands but in-                           MATO GROSSO AND
tends to open the discussion about alternatives for the entire Upper Paraguay Ba-
sin, including the borders with Bolivia and Paraguay. It’s important to highlight
                                                                                                            MATO GROSSO DO SUL,
that until this moment, hydroelectric power projects for this area in the neighbor-                         THE LARGEST PART OF
ing countries are not known of, which reinforces the importance of a specific look                          PANTANAL.
into Brazil, which may have consequences beyond borders.

                                                  Sustainable Alternatives for Electric Power Generation in the Upper Paraguay Basin (BAP)   9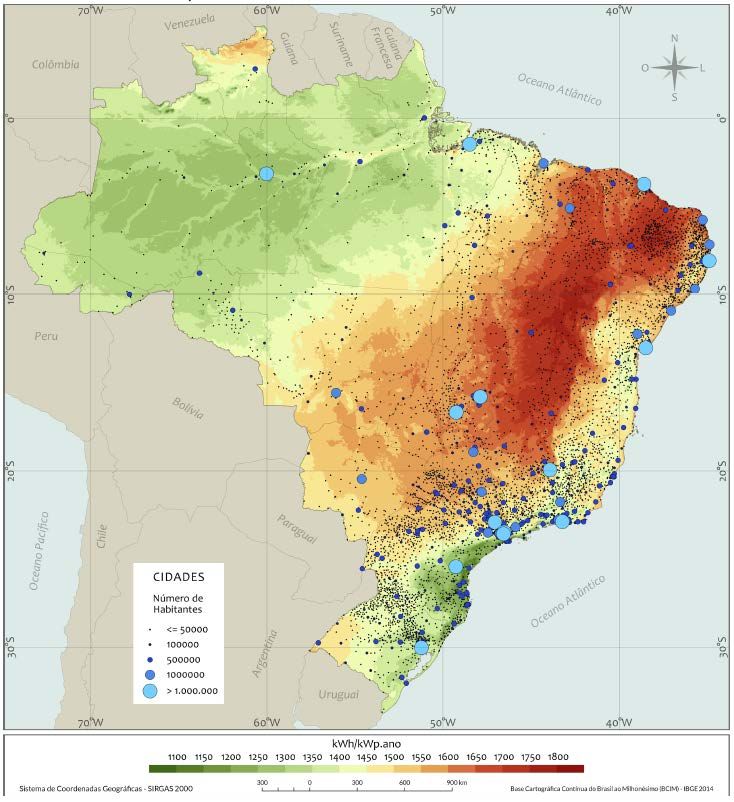
2. ELECTRIC POWER
     GENERATION IN
     BRAZIL

10
Foto: © ABiogás
2. Electric power generation in Brazil

                                          Brazil is a country highly dependent on hydroelectric power, according
                                          to studies of the Brazilian Energy Balance (BEN, 2018), with more than
                                          60% of electric generation depending on that source.

                                          The second largest is thermoelectricity (gas, coal, diesel, etc.). Third is wind en-
                                          ergy, with almost 8% of the country’s capacity. The small hydro (PCHs) represent
                                          3.2% of the capacity.

                                          The Picture 2 shows how the energy generation is divided by source. Hydroelec-
                                          tric power generation is 63.1% of electric energy in Brazil; followed by thermo-
                                          electricity (fossil and biomass) and wind energy. The data allows quantifying
                                          how each of them contributes in Brazil.

                                                                            1.15%
                                                                                1.21%

                                                                                                              Biomass
                                                                                8.57%
                                                                                                              Wind power
                                                                                        8.71%
                                                                                                              Fossil fuel

                                                                                                              Hidropower
                                                                   60.84%                14.79%

   THE STATE OF MATO                                                                                          Nuclear energy

   GROSSO (MT) IS THE
                                                                                                              Solar photovoltaic

      SECOND EMITTER
     IN BRAZIL, WITH A
TOTAL OF 231.6 M tCO2
  (GROSS) AND 192.1 M                     Picture 2 – Participation of each source of electric power generation in Brazil. BEN, 2018. Source:

   TCO2E (NET), LOSING                    EPE, 2019.

 ONLY TO THE STATE OF                     The next table shows data by region (EPE, 2018). These data, from 2017 (BEN,
                 PARÁ.                    2018), shows Southeast is responsible for almost 50% of the electric power genera-
                                          tion in Brazil.

                                          Table 1 – Electric Power Generation (GWh) by region. Source: EPE (2018).

                                                                                    Generation                      Participation
                                                        Region
                                                                                      (GWh)                              (%)

                                                       Southeast                         232,515                            49.77%
                                                        South                            84,997                             18.19%
                                                       Northeast                          79,731                            17.07%
                                                       Midwest                           35,408                             7.58%
                                                        North                            34,510                             7.39%

12
Despite representing only 7.58% of electric power generation in the country, the
Midwest can raise its contribution by using solid waste (urban and rural), biomass
and solar, all of them very significant in the region, and contribute for energy ge-
neration without the construction of new PCHs.
The hydroelectric potential in the BAP area has the capacity to duplicate the cur-
rent electric power generation based on these studies, however, other sources can
replace future projects, keeping the rivers “free” without human interference.
Diversifying the energy sources locally can contribute to reduce greenhouse gas
emission (GHG). Considering data from the Electric Power Annual 2018, base
year 2017, consumption of electric power in Brazil was 587,962 GWh, which is
equivalent to the annual emission of 61.14 MtCO2, around 11.1% of the energy
generated in the MW. The data from the System for Estimating Greenhouse Gas
Emissions (SEEG), base year 2017, published in 2019, show that around 21% of
greenhouse gas emissions come from the energy sector (including transports).
6G 600k [Energy] Generation of eletricity (GWh)
5G 550k
4G 400k
Emissions
3G 450k
2G 400k
1G 350k
0G 300k
2000 2002 2004 2006 2008 2010 2012 2014 2016
2001 2003 2005 2007 2009 2011 2013 2015 2017
Land use Waste Industrial Farming Energy Generetio
change processes of eletricity
(GWh)
Picture 3 – Total greenhouse gas emissions and energy generation in Brazil. Source:
SEEG, 2019.
According to SEEG database, base year 2017, the state of Mato Grosso do Sul (MS)
emitted 72.3 MtCO2e (gross) and 69.8 MtCO2e (net), occupying the 13th position
in the national index. The state of Mato Grosso (MT) is the second emitter in Brazil,
with a total of 231.6 M tCO2e (gross) and 192,1 M tCO2e (net), losing only to the
state of Pará.
Sustainable Alternatives for Electric Power Generation in the Upper Paraguay Basin (BAP) 132. Electric power generation in Brazil
Considering only the electric power generation sector of each state, the emission
of GHG in MS represents 12.2% of the state’s emissions. In MT, it represents only
4.9% of the state’s emissions. (SEEG, 2019).
Greenhouse gas emissions in the states of Mato Grosso and Mato Grosso do Sul
1.200
1000
800
600
400
200
0
2000 2001 2002 2003 2004 2005 2006 2007 2008 2009 2010 2011 2012 2013 2014 2015 2016 2017
Land use Waste Industrial Farming Energy
change processes
Picture 4 – Historic series of GEE emissions in MT and MS. Source: SEEG, 2019.
2.1 HYDROELECTRIC POWER GENERATION IN THE HYDROGRAPHIC
REGION OF PARAGUAY (RH – PARAGUAY)
Small hydro (PCHs) are small plants with reduced power, mandatorily between
5 and 30 megawatts (MW), and, originally, with an area of 3km2 at most, ac-
cording to the Normative Resolution nº 652/2003 of Brazilian Electricity Regu-
latory Agency (ANEEL). In the 4th section, it’s possible to change the criteria of
the flooded area upon evidence that the size of the reservoir is related to other
projects other than energy generation.
However, in November 22nd 2016, ANEEL published the Normative Resolution
nº 745, updating the rules for projects in Energy Generation, including PCHs,
changing the reservoir’s area up to 13km2 and power between 5 and 30 mega-
watts (MW).
Although characterized as a project with low environmental impact, PCHs need
environmental licensing (previous license, installment license and operation li-
cense) and granting of the hydro resources rights to get the real dimension of
the impacts in the biosystems, biotas, aesthetic and sanitary conditions of the
environment, among social, economic and cultural aspects.
14Today, the hydroelectric power potential of the hydrographic region of Paraguay
(RH-Paraguai) is explored by 7 hydroelectric power plants (UHE), 30 small hydro
(PCH) and 16 hydro dams (CGH), with a total capacity of 1.2 GW (ANA, 2018a).
However, the development of new hydroelectric projects raises a series of con-
cerns regarding socioeconomic impacts, changes in the hydrological regime
and decrease in water quality (ANA, 2018a).
TODAY, THE
HYDROELECTRIC
POWER POTENTIAL OF
THE HYDROGRAPHIC
REGION OF PARAGUAY
Picture 5 – Hydroelectric projects and navigation on RH-Paraguai. Source: ANA (2018b)
IS EXPLORED BY 7
Furthermore, ANEEL studies show that there’s potential to double this capacity, HYDROELECTRIC
adding 1.172 MW with the development of 125 new hydroelectric projects with POWER PLANTS, 30
a size of around 9.376 kW each PCH. Currently, the average capacity of PCHs in SMALL HYDRO AND 16
the MW is 17.336 kW (operating and under construction). HYDRO DAMS, WITH A
Considering that there are 125 projects under study, and, if each new project TOTAL CAPACITY
(PCH) use the maximum allowed reservoir area limit (13 km2), the theoretical OF 1.2 GW
limit of the area to be flooded and transformed into a reservoir is 1.625 km2
(162,500 hectares) or around 228,000 soccer fields.
If these reservoirs formed one single lake, and if it had the shape of a square, it
would be necessary 17 days (408 hours) to walk 1,625 km, which would be one
of the sides of this square. If it was on a bike, it would be necessary 3.4 days (82
hours) to ride this same side.
Sustainable Alternatives for Electric Power Generation in the Upper Paraguay Basin (BAP) 153. SUSTAINABLE
ALTERNATIVES FOR
ELECTRIC POWER
GENERATION
16Foto: © ABiogás
3. Sustainable alternatives for electric power generation

                                           3.1 SOLAR ENERGY
                                           The energy from the Sun can be used in many ways, but most of all for generation
                                           of electricity and thermal energy in houses and industries. The main ways are: (i)
                                           by using solar thermal collectors for water heating; (ii) by using solar concentra-
                                           tors (heliothermic energy or concentrated solar power (CSP) for uses both ther-
                                           mal and electric and; (iii) through direct conversion of luminosity in electricity,
                                           through photovoltaic modules and photoelectric effect.

                                           This study will focus in photovoltaic solar technology, considering the set of equip-
                                           ment that form the photovoltaic solar power system. The photovoltaic system is an
                                           association of photovoltaic modules connected in series and/or parallel to produce
                                           electric power in the voltage determined by each project.

                                           To dimension a photovoltaic generator, it is important to know the electric charac-
                                           teristics of the modules, such as: electrical current, voltage and power, and features
                                           related to the efficiency of these components, losses related to temperature, dust,
                                           etc. The guidelines change according to the manufacturer, construction’s charac-
                                           teristics, type of semiconductor material, internal electric resistance, technology
                                           and place of installation. However, one of the most important data is to know the
                                           solar energy source potential available at the site.

                                           The Brazilian Solar Energy Atlas shows long term rates of solar sources (the next
                                           picture shows the global horizontal irradiance - GHI), which is one of the cli-
                                           mate phenomena that determines the potential for generation of solar energy in a
                                           specific location. Considering a global horizontal irradiance, the daily average in
                                           Campo Grande (MS) is 5.35 kWh/m2. The daily average in Cuiabá (MT) is 5.36
                                           kWh/m2. According to the Brazilian Solar Energy Atlas, the annual average for the
                                           entire MW is 5.07 kWh/m2.
                                                                                                                             © Adam Oswell / WWF-Canon

18
CITIES
Number of
Inhabitants
Picture 6 – Photovoltaic solar generation potential ((kWh/kWp.year). Source: IBGE,
2014. INPE, 2018
Global Tilted Irradiation (GTI) is the total amount of direct and diffuse radiation
received from above on a tilted surface. Compared to horizontal surface, the tilted
receives a bit more of solar radiation reflected on the ground, hence the GTI value
por Alternativas Renováveis de Geração de Energia Elétrica nos Estados de MT e MS 193. Sustainable alternatives for electric power generation
is higher than GHI value. For example, the daily average GTI in Campo Grande
is 5.70 kWh/m2.
According to the Global Solar Atlas and Solargis2, the estimated daily produc-
tion of solar energy for each kWp (kilowatt-peak)3 in the MW area is between
4.20 kWh/kWp and 4.40 kWh/kWp. When comparing Campo Grande (MS) and
Cuiabá (MT) one can notice that the production varies from 4.39 kWh/kWp
and 4.25 kWh/kWp, respectively. These values represent a relative variation be-
tween the cities of around 3%, which is a value below measurement deviations
and accuracy.
The World Bank selected Solargis as the global electric power potential data and
solar energy evaluation services supplier, based on the databank they own and
keep. When compared to the data from National Institute for Space Research
(INPE) in the second edition of the Brazilian Solar Energy Atlas, the values of
Solargis and INPE are close and compatible with the scenario of regional electric
power generation.
Therefore, it was considered an electric power production index of 4.32 kWh/
kWp-day , which corresponds to 1,577 kWh/kWp-year, as shown in Picture 6.
Combining the solar potential to the regulation of distribution of the energy,
Pantanal can have a substantial energy potential. Since ANEEL’s Normative Reso-
lution nº 482, April 17th 2012 – which regulated the distribution in the Brazilian
energy matrix.
Consuming Units (CU), whether people or companies, who generate their own
energy (Distributed Generation - DG) up to 5MW are included in the Registra-
tion System of Consuming Units with Distributed Generation by ANEEL, and
they can put in the transmission network the energy which exceeded the con-
sumption. It’s not possible to sell these “leftovers”, but it can be compensated in
up to 5 years, in its own consuming unit or another, as long as it is in the same
distribution company area.
After the Resolution 482/12, 83,000 photovoltaic systems were installed, 86 CGHs
(small hydro with up to 5MW), 57 wind farms and 162 biomass power plants,
with the total amount of 1,015 MW (~1 GW). Table 2 shows an overview of the
DG systems installed until June 15th, 2019.
2 https://globalsolaratlas.info/?c=11.609193,8.261719,3
3 kWp representes the capacity of the solar PV system. It’s associated to the full power
installed in solar energy modules.
20Table 2 – Overview of Distributed Generation in Brazil. Source: Aneel,
2019.
Type Quantity Power (kW)
Micro hydro 86 81,343,60
Wind 57 10,314,40
Solar PV 83,308 879,161,91
Thermal 162 44,795,78
TOTAL 86,613 1,015,615.69
The map below shows how solar PV systems are distributed across Brazil.
THE WORLD BANK
SELECTED SOLARGIS AS
THE GLOBAL ELECTRIC
POWER POTENTIAL
DATA AND SOLAR
ENERGY EVALUATION
SERVICES SUPPLIER,
BASED ON THE
DATABANK THEY OWN
AND KEEP.
Picture 7 – Distribution of solar energy systems in Brazil. Source: ANEEL, 2019. The
maps shows the systems together with data sets according to registers from ANEEL, using
the methodology “High-density Scatter Charts”, which shows the number of systems by
consuming unit, so every circle gives information about the GD system registered.
Sustainable Alternatives for Electric Power Generation in the Upper Paraguay Basin (BAP) 213. Sustainable alternatives for electric power generation
Picture 8 shows the number of DG systems that use solar PV as energy source. An
increasing growth can be seen in the last years, starting in 2012 when the Norma-
tive Resolution RN 482/2012 was implemented.
35,070
25,877
14.025
6,787
1,476
60 308
5
2012 2013 2014 2015 2016 2017 2018 2019
Picture 8 – Number of solar PV systems in Brazil. Source: ANEEL, 2019.
Separating the data from the MW region, there are 9,292 PV systems installed un-
til June 2019, with the total amount of 122,884 kWp, representing a little less than
14% of the installations in the country.
Picture 9 –Solar PV systems in the Midwest. Source: ANEEL, April 2019.
22Like the rest of Brazil, in the last years, solar PV systems have grown in the MW,
especially in residential and commercial sites. Residential units count 6,815 in-
stallations, with the total amount of 39,274 kW (average power 5.76 kWp) and
commercial 1,654, with the total amount of 51,020 kW (average power 30.84
kWp).
Regarding the area, solar systems in residences in the states of the Midwest sum
235,644 m2 (considering 6m2/kWp), around 33 soccer fields. Commercial ones
sum 306,120m2, around 43 soccer fields.
Another important data is about the type of generation. In the MW, the prevail-
ing one is the generation at the consuming unit (next to the energetic charge),
with 8,584 units, followed by 696 units in the remote consumption model and
12 in the shared generation model (in both cases, photovoltaic power stations
far from the charge).
When looking at each state, distributed generation prevails in Goiás, followed
by Mato Grosso, Mato Grosso do Sul and Federal District, as shown in the Table
3. The states of Mato Grosso and Goiás combined represent 75% of the instal-
lations in the MW.
Table 3 – Amount of solar PV DG units by state. Source: ANEEL, 2019.
State Amount od DG Units Power (kW) Percentage (%)
FD 982 13,083 11%
GO 3,218 33,645 27%
MS 1,653 17,650 14%
MT 3,438 58,504 48%
Total 9,292 122,844 100%
Considering a productivity of 1,577 kWh/kWp-year, the MW generates 193.73
GWh of solar energy annually, and, according to Table 1, the region generates
35,408 GWh of electric energy connected to the National System (SIN). The solar
energy represents 0.54%, but it can be so much more.
Another type of use of the solar power is the photovoltaic power plants, technically
called Centralized Solar Power Generation (GC).
Unlike DG, GC is characterized by a transmission network for distribution con-
necting the power plant to consuming units. The authorization for these types of
generating centrals with power higher than 5 MW should be requested to ANEEL
through a series of procedures.
Sustainable Alternatives for Electric Power Generation in the Upper Paraguay Basin (BAP) 233. Sustainable alternatives for electric power generation
Solar PV technology used in GC is the same as in DG, the changes are in the
power capacity and type of equipment, connection with transmission networks
and other protection and control techniques. At a solar PV power plant, the pro-
duction is higher, thus the cost is much lower.
3.1.1 DISTRIBUTED SOLAR ENERGY GENERATION PROJECTIONS
To project the DG type solar energy growth, the average growth of 33.56% from
the last 5 years and annual growth of 1% were considered. It was also considered
an average power of 13.22 kWp for each system installed, according to the average
verified until now.
180,000
Installed systems 2,037
160,000 2,000
Installed power
140,000
120,000 1,500
100,000
80,000 1,000
60,000
40,000 500
20,000
0 0
2013 2014 2015 2016 2017 2018 2019 2020 2021 2022 2023 2024 2025 2026 2027 2028 2029 2030
Picture 10 – Distributed solar energy generation projection by photovoltaic systems.
Source: the authors themselves.
The projection for 2030 based in the scenario above is 3,212 GWh / year. This
amount takes in consideration the average solar irradiation of 1,577 kWh/kWp-
year, for the capacity of 2,036,520 kWp (2.04 GWp). In this scenario, the solar
energy generation in 2030 would be enough to supply around 1 million families
with an average consumption of 250 kWh. The area to install 2.04 GWp would be
12,219,120 m2 , considering the current efficiency of photovoltaic modules.
The cost of investment considers the current cost of this technology, which is
R$ 4,500 / kWp, with the total amount of around R$ 9.2 billion. Considering the
technology will have a reduction in its cost of 5% until 2030, then the total amount
would be R$ 7.6 billion.
Comparatively, if the alleged lake formed by the construction of 125 PCHs (1,625
km2) was covered with photovoltaic modules, the total power would be the same
24of a solar power plant with 270.83 GWp. Today, there is no more than 3 GW of
photovoltaic systems currently in use in Brazil (DG and GC). This comparison is
to show the potential of solar energy in Brazil (and the world).
3.2 SUGAR CANE BIOMASS
In Brazil, the sugar-energy industry has an important role in diversifying the en-
ergy matrix producing ethanol as fuel and generating electric power through a
process of cogeneration (treated here as bioelectricity). In 2017, these sugar cane
products represented around 17% of the energy supply in the country, with ethanol
covering 16% of the energy in the transportation system and bioelectricity repre-
senting around 6.5% of the electric sector capacity (EPE, 2018). Today, there are
405 plants with a total amount of 11.4 GW of power, 60% more than the Brazilian
part of Itaipu hydroelectric power plant (ANEEL, 2019). The cogeneration in su-
gar cane plants can contribute to the expansion and diversification of the electrical
matrix in the states of MT and MS.
4.1.1 SUGAR CANE PRODUCTION IN THE STATES OF MT AND MS AND THE
POTENTIAL FOR ELECTRIC POWER GENERATION
In the last two decades the sugar-energy industry went through major expansion,
increasing the harvested area in 112% and 133% in the amount produced (IBGE,
2019a). This growth was boosted by the favorable circumstance of internal and
external demand and the prices of sugar and ethanol.
Ethanol grew internally due to popularization of Flex Fuel cars specially after
2006. According to UNICA, these vehicles went from 6.1% in 2005 to over 76%
of the Brazilian fleet in 2018 (UNICA, 2019). The 2027 Energy Plan – PDE2027
(MME/EPE, 2018) projects a growth of 4,3% per year in ethanol demand, with
consumers changing gradually from gasoline to ethanol. PDE2027 also projects
construction of 11 new plants and productive expansion in another 23 plants,
that together with the existing ones will produce around 44 billion liters of ethanol
in 2027.
The dynamics of this sector is deeply connected to sugar international markets. In
the 2018/2019 harvest, Brazil was the second largest producer of this commodity,
with the total amount of 29.5 million tons, and India was the main producer with
33 million tons. European Union was third with 18.2% million tons (FAS/USDA,
2019). Projections of OECD/FAO( 2016) show the sugar global market will grow
around 2.1% per year, and the total production will be 210 million tons in 2025.
The same report by FAO estimates that Brazil will remain as one of the largest
producers: 42 million tons in 2025.
Sustainable Alternatives for Electric Power Generation in the Upper Paraguay Basin (BAP) 253. Sustainable alternatives for electric power generation
In Brazil, the states of MS and MT are respectively the fourth and sixth largest pro-
ducers of sugar cane, with a total amount of 66 million tons in 2017 (IBGE, 2019a).
However, as shown in Picture 11, the extent of sugar cane production expansion
has different patterns in both states. Between 2000 and 2017, the production in MS
increased 700%, going from 5.8 million to 46.9 million tons. In the same period,
the production in MT went from 8.5 million to 19.3 million tons, an increase six
times smaller (IBGE, 2019a).
60
MT
50
MS
40
Millions of tons
30
20
10
0
2000 2001 2002 2003 2004 2005 2006 2007 2008 2009 2010 2011 2012 2013 2014 2015 2016 2017
Picture 11 – Production of sugar cane in the states of MS and MT. Source: the authors
themselves based on IBGE (2019a).
To project scenarios of energy generation through sugar cane waste cogeneration
there are two main aspects: i) the rate of growth in the amount of sugar cane pro-
duced and ii) conversion rate of sugar cane into electricity. For the first one, it was
considered the conservative pace of expansion4 of around 8% per year in MS and
6% in MT. The capacity projections consider two technological scenarios accord-
ing to the methodology developed in (Coelho et al., 2012):
• Scenario A: generation system with the capacity to produce 60
kWh per ton, with the plants operating only during harvest (April
to November), with a total of 5,563 hours (around 63%);
• Scenario B: generation system with the capacity to produce 120
kWh5 per ton, with the plants operating during harvest and off-season,
with a total of 7,446 hours. This scenario assumes that different types
of waste would be used, such as bagasse, cane tops, and straw.
4 Between the years of 2000 and 2017, the amount of sugar cane in the state of MS grew na
average of 14% /year. (IBGE, 2019a).
5 New technologies make possible for other types of production that can reach up 160
kWh/t (Nova Cana, 2019).
263000
Scenario A
Scenario B
2000 2019 Base
1500
1000
MW
500
0
2020 2021 2022 2023 2024 2025 2026 2027 2028 2029 2030
Picture 12– Projection of capacity based on different scenarios. Source: the authors
themselves based in Coelho et al. (2012) and IBGE ( 2019a)
Today, there are 31 plants in the region that generate electricity, 23 in MS and 8
BETWEEN 2000 AND
in MT. These plants together have a 1,263 MW capacity and show the adoption 2017, THE PRODUCTION
of the technological path as shown in Scenario B. OF SUGAR CANE IN
Picture 12 shows the evolution of the capacity considering two scenarios. In the
IN MS INCREASED
scenario A the projection is that both states will sum 1,794 MW in 2030, which 700%, GOING FROM
would mean adding around 531 MW to the current production of 2.9 TWh per 5.8 MILLION TO 46.9
year. In Scenario B, the power would almost double adding 1,132 MW, summing MILLION TONS.
2,395 MW. Looking at the parameters in Scenario B, this additional power could
generate 8.4 TWh per year. That would mean expanding supply from 1.5 million
houses in A, to 4,4 million houses in B6.
The expansion of sugar-energy industry can happen by expanding and modern-
izing the existent plants (Brownfield) or by building new ones (Greenfield). The
options require different levels of investment. In the case the expansion happens
entirely with investments in Brownfield the total amount would be of around
R$ 23 billion, and the Greenfield alternative would require R$ 32 billion. It’s
important to highlight that these investments could produce 3 billion liters of
ethanol per year, besides 8.4 TWh of electricity per year, and sugar. When the
investment is divided in these three products, the value falls to R$ 7,7 billion
with Brownfield and R$ 10,8 billion with Greenfield.
6 Does not consider losses with transmission and distribution. Average monthly consump-
tion of kWh per month. (MME/EPE, 2017)
Sustainable Alternatives for Electric Power Generation in the Upper Paraguay Basin (BAP) 273. Sustainable alternatives for electric power generation
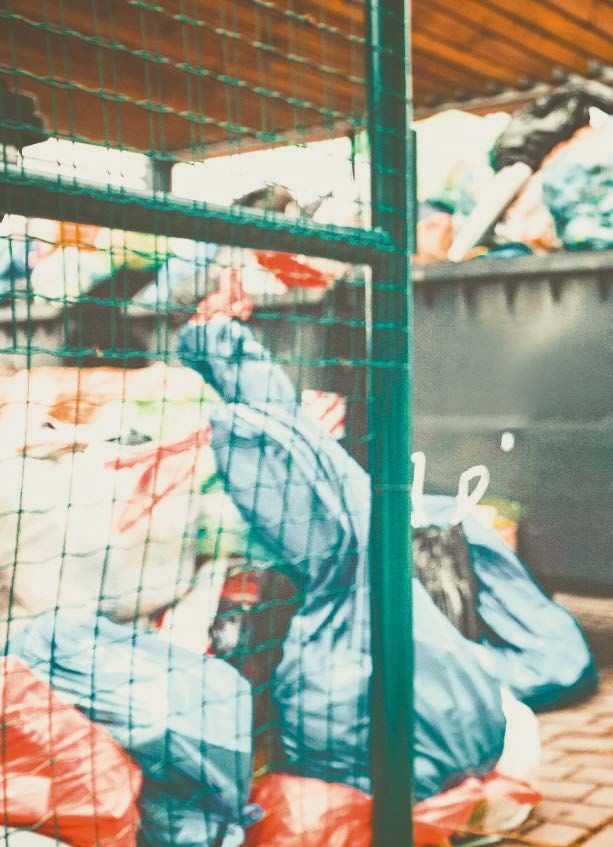
3.3 URBAN SOLID WASTE – USW
It’s estimated that in 2030 the Brazilian population will be 225 million people,
of which 4 million will live in Mato Grosso and 3.1 million in Mato Grosso do
Sul (IBGE, 2019b). If the patterns of production and consumption per capita
stay the same, there’s going to be 234,000 tons of urban solid waste (USW) a day
that will demand 278 million TOE7 of energy. The adoption of waste-to-energy
technologies contributes to a sustainable future where efficient management of
USW and energy generation are connected.
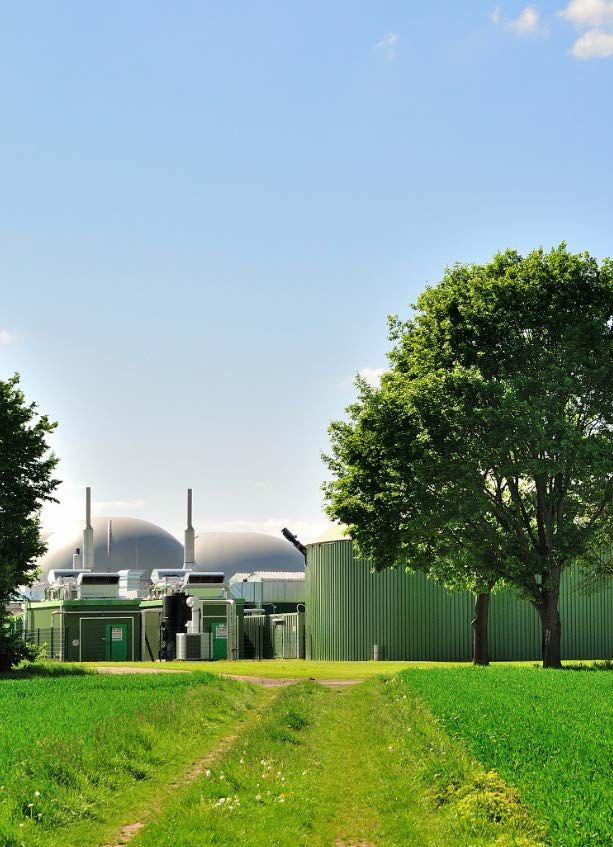
Waste-to-energy technology can be used in synergic way to help expand the
energy supply in a decentralized way and help reduce the negative impact of
inappropriate waste management. This is possible through the process of gasifi-
cation, a thermochemical process that transforms the carbon in chemical struc-
tures by decomposing organic matter into gas.
The process of gasification occurs in equipment called gasifiers. The main types are:
• Fixed-bed gasifier: The matter to be gasified is moved by gravity.
These gasifiers are built with a fixed bed, where fuel is over a
grille, with an up-draft flow or down-draft flow. This is the most
common, known and operationally mastered technology, and it
has been implemented in small scale.
• To generate electric power, fixed-bed gasifiers has been used to
feed internal combustion engines, in systems between 1kW and
200 kW.
• Fluidized bed gasifier: In this type of gasifier, the matter is kept
suspended on a bed of fluidized material (usually sand), kept in
movement by the air flow. The biomass is dragged on a fluidized
bed. They can be of the bubbling type or the circulating type,
according to the speed with which the matter crosses the bed. In
the bubbling type the speed is up to 3 m/s and in the circulating
type the speed can reach higher than 3 m/s, allowing a better
mixture of the air with the fuel to be gasified.
3.3.1 URBAN SOLID WASTE (USW) IN THE STATES OF MT AND MS AND THE
POTENTIAL FOR ELECTRIC POWER GENERATION
Approved in August 2010, the Brazilian National Policy on Solid Waste (PNRS,
Portuguese acronym) is the most important milestone in solid waste management.
The main goal is to promote healthy and sustainable ways of USW management in
the 5570 cities of Brazil (Brasil, 2010). However, indicators show few advances in the
7 TOE: ton of oil equivalent, approximately 42 GJ.
28first decade since PNRS was implemented. Between 2010 and 2016, the Brazilian
population with access to solid waste collection decreased from 82% to 75%, and
the proper management of the collected waste raised only 0.8% which resulted in
around 81,000 tons of waste without proper management (ABRELPE, 2016; MCI-
DADES.SNSA, 2018; SNIS, 2016).
In the Midwest, around 99% of the population has access to USW collection (Pic-
ture 11), but only 13.9% of the cities manage this collected waste properly (sani-
tary landfill). The proper management considers ways of environmental protection
and occupational safety that aim to reduce or eliminate contamination of water, soil
and air. The use of gasification has important synergies with the expansion of USW
proper management, such as: i) reduce the volume of waste that goes to the landfills,
ii) reduce the risks of soil contamination, iii) reduce greenhouse gas emissions, and
iv) generate distributed electricity and closer to great urban areas.
IN THE MIDWEST,
AROUND 99% OF THE
POPULATION HAS
ACCESS TO USW
COLLECTION, BUT
ONLY 13.9% OF THE
IN016 - Household collection rate
in relation to urban population in%, CITIES MANAGE THIS
COLLECTED WASTE
PROPERLY.
No information
Picture 13 – Household collection rate in relation to urban population in%, (indicator
IN016). Source: (Brasil, 2019)
To understand how USW gasification can contribute to the expansion of energy
supply in the states of MS and MT, two main factors were considered. The first
one is populational growth in the cities of both states between 2019 to 2030, which
was estimated considering populational projections calculated by IBGE (2019b).
This data is important to estimate the amount of waste by each city and later have
a dimension of the processing units. The second factor is the minimum size of the
power plant, so the project is economically viable.
Sustainable Alternatives for Electric Power Generation in the Upper Paraguay Basin (BAP) 293. Sustainable alternatives for electric power generation
The manufacturers indicate the viability of projects that can meet the needs of
20,000 people (Carbogás, 2019), but this study adopted a minimum of 45,000 peo-
ple to keep conservative estimates and close to the investors scale of attraction.
Between 2017 and 2030, the population in the state of MS is estimated to grow around
12%, going from 3.5 to 3.9 million people. The population of MT will grow less, 11%,
going from 2.8 to 3.07 million. These growth rates, when applied to cities, showed that
the number of cities with more than 45,000 people will grow from 23 to 25. Consider-
ing the consumption and waste production patterns are kept in the next years, the daily
production of solid waste in these cities will grow from 5.9 to 6,500 tons.
Picture 14 shows the estimated evolution of capacity potential in electric power
generation projects through USW gasification. By the end of the analyzed period,
the estimate is an expansion of the capacity in around 64,7 MW, with the potential
of 567 GWh per year, supplying 295,000 houses with an investment around R$ 1.3
billion. One can notice in the diagram the growth in capacity in 2028, which can
BIOGAS IS ONE OF be explained by two cities that grow big enough to get the minimum necessary for
the construction of a gasification plant.
THE BYPRODUCTS
PRODUCED BY
ANAEROBIC DIGESTION 70,0
OF ORGANIC 60,0
COMPONENTS OF 50,0
LIQUID EFFLUENTS, 40,0
AND DUE TO ITS
MW
COMPOSITION CAN BE
30,0
USED A SOURCE OF
20,0
RENEWABLE ENERGY. 10,0
-
2020 2021 2022 2023 2024 2025 2026 2027 2028 2029 2030
Picture 14 - Estimated evolution of capacity potential in electric power generation pro-
jects through USW gasification. Source: the authors themselves based in Carbogás (2018)
and IBGE (2019b)
3.4 WASTEWATER TREATMENT
3.4.1 ANIMAL PRODUCTION
Traditionally, Brazil is one of the major animal protein producers in the world. In
2017, it was the biggest cattle producer, with a total amount of 215 million heads
of cattle. It’s the fourth biggest chicken producer, with a total amount of 1.4 billion
30chickens, and the third biggest swine producer, with a total amount of 41 million
animals (FAO, 2019). Even though there are positive economic impact, the animal
production is associated with two major environmental problems: greenhouse gas
emission (GHG) and large amounts of animal waste.
In 2016, livestock industry was the second biggest source of emissions in Brazil,
almost 500 million tons of CO2, mainly composed of enteric fermentation, animal
waste management and nitrous oxide from the use of nitrogen fertilizers (OC -
Observatório do Clima, 2018). These types of animal production waste are rich in or-
ganic matter that release carbon in the atmosphere during decomposition. This high
organic concentration leads to the second great environmental impact; when they
are not properly managed, they can pollute local water sources (Coelho et al., 2018).
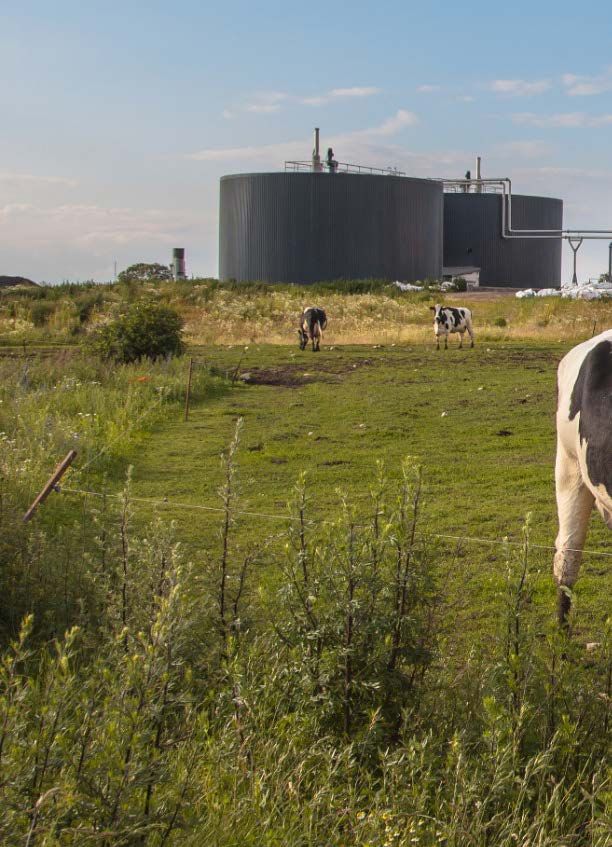
However, the use of biodigesters as an alternative technology can produce bio-
gas and generate electric power and reduce the negative impact of animal pro-
duction waste.
Biogas is one of the byproducts produced by anaerobic digestion of organic
components of liquid effluents, and due to its composition can be used a source
of renewable energy. Usually, the gas is composed of 60% methane (CH4), 35%
carbon dioxide (CO2), and 5% other gases, such as: nitrogen, ammonia, hy-
drogen sulfide gas, carbon monoxide and oxygen, among others (Coelho et al.,
2018). The potential for energy use is because of the high methane concentra-
tion that can be used for heating – replacing fossil fuels in vehicles, for electric-
ity and as a biofertilizer.
Waste Waste Waste
collection Accumulator
Biodigester
Effluent Accumulation Effluent
Fertigation
pond
Biogas
Heat or power
generation
Picture 15 – Process of biodigestion of animal waste. Source: the authors themselves
based in Coelho et al. (2018)
Sustainable Alternatives for Electric Power Generation in the Upper Paraguay Basin (BAP) 313. Sustainable alternatives for electric power generation
The use of biogas for electric power generation consists on the transformation of
chemical energy in the gas into mechanical energy, which is then converted into
electric energy. Different from other renewable sources, the generation of electric-
ity through biogas is constant and can be used to alleviate the intermittency of the
generation system.
3.4.1.1 ANIMAL PROTEIN PRODUCTION IN THE STATES OF MT AND MS AND THE POTENTIAL
FOR ELECTRIC POWER GENERATION
In the last two decades, the animal protein industry went through important
transformation in the states of MT and MS. Analyzing the types of herd between
2000 and 2017, livestock production was the one with the smallest variation,
growing 57% the number of cattle in MT and a decrease of 3% in MS. The swine
herd grew around 200% in MT and 110% in MS, while chicken industry grew
158% in MT and 49% in MS (Picture 20). This expansion is naturally followed
by the raise in the number of animal waste, with a production of around 191.1
million tons in 2017.
35
30
25
Herds - millions of heads
20
15
10
5
0
2000 2001 2002 2003 2004 2005 2006 2007 2008 2009 2010 2011 2012 2013 2014 2015 2016 2017
BIOGAS AND
Cattle - MS Chicken MS Swine - MS
Cattle - MT Chicken MT Swine - MT
ELECTRICITY
GENERATION IN SWINE
INDUSTRY BENEFITS Picture 16 – Historic evolution of herds in the states of MT and MS. Source: the authors
FROM THE HIGH LEVEL themselves based in (IBGE, 2018)
OF ORGANIC MATTER To understand how animal waste biodigestion can contribute to the expansion
AND THE HERD’S and diversification of the energy matrix in the region, the generation potential
CONFINEMENT. for each type of waste was estimated. It was considered the total number of
chicken and swine produced in 2017, analyzed by Municipal Livestock Survey
(IBGE, 2018). The largest part of cattle production in Brazil is extensive, which
32makes impossible to collect and biodigest the waste. That’s why it was consid-
ered that 2%8 of the herd is kept confined, thus have the potential for biodiges-
tion.
According to Picture 17, the use of this technology has the potential to add 211
MW to the region’s energy matrix according to the production in 2017. The
state of Mato Grosso is the one with the biggest potential, 134 MW. Biogas and
electricity generation in swine industry benefits from the high level of organic
matter and the herd’s confinement. The swine industry today has the biggest
generation potential, with 110 MW. Cattle has the second biggest potential,
with 72 MW, but it can double this number in 13 years if confinement rates
keep growing like it is today.
120
MT
MS
100
80
60
40
20
0
Swine Cattle Chicken
Picture 17 – Estimation of electric power generation potential from animal
waste biodigestion, Source: the authors themselves with data from (IBGE,
2018) and methodology developed by (Coelho et al., 2012)
Picture 18 shows the estimated capacity projection for biodigestion projects for elec-
tric power production keeping the growth rates constant in the three types of herd:
swine, cattle and chicken. In 2030, the total power can reach 410MW and generate
around 3 TWh per year, making it possible to supply electricity to around 1.5 mil-
lion houses with an investment around R$ 1.57 billion. The swine production has
the biggest capacity, representing 63% of power, followed by cattle with 23% and
chicken with 14%.
8 National average of cattle confinement. (Molin, 2018).
Sustainable Alternatives for Electric Power Generation in the Upper Paraguay Basin (BAP) 333. Sustainable alternatives for electric power generation
450
400
350
300
250
MW
200
150
100
50
-
2020 2021 2022 2023 2024 2025 2026 2027 2028 2029 2030
Total cattle (MW) Total chicken (MW) Total Swine (MW)
Picture 18- Estimated capacity projection for biodigestion projects for electric power pro-
duction by type of herd. Source: the authors themselves based in Coelho et al. (2012) e
IBGE (2018)
3.4.2 MUNICIPAL WASTEWATER (SANITARY SEWER)
The expansion in the use of technologies that use biodigestion for sanitary sewers
contributes with the mitigation of two important challenges: the national basic
sanitation deficit and the need for power generation. In Brazil, although there were
important advances in expanding basic sanitation in the last decade, there’s still a
huge difference of access to its major elements: water supply and sanitary sewers.
In 2017, around 93% of urban population had access to water supply, but only 60%
had access to sanitary sewers (SNIS, 2019a).
In the states of MT and MS there’s a similar pattern: while water supply access is
around 97% (MT) and 99% (MS) for urban population, sanitary sewer network is
only 49% (MT) and 59% (MS). Absence of collecting and treatment of wastewater
has severe environmental impacts - polluting water and soil, and people’s quality
of life, since sewage is a large disease disseminator (Santos et al., 2016).
In Brazil, biodigestion in sanitary landfills is not yet widespread and there are few
power plants operating. Two great examples are ETE Arrudas in Belo Horizonte/
MG and ETE Ribeirão Preto/SP. The first one supplies energy for 1.7 million peo-
ple, with 2,4 MW using 12 microturbines; while the second supplies energy for
600,000 people, with 1.5 MW (Brasil, 2016).
343.4.2.1 SANITARY SEWER IN THE STATES OF MT AND MS AND THE POTENTIAL FOR
ELECTRIC POWER GENERATION
Picture 19 shows the historic evolution in wastewater treatment in the last two
decades. There are two moments of great expansion, first one in the 2000’s, grow-
ing six times the treated volume, and the second one from 2010 to 2017, when
the treated volume in MT went from 16.7 million m3 to 38.4 million m3, and 31.1
million m3 to 56.1 million m3 in the state of MS. This trend creates a favorable
scenario for investments by raising the scale and treatment plants.
IN BRAZIL,
BIODIGESTION IN
SANITARY LANDFILLS IS
NOT YET WIDESPREAD
AND THERE ARE FEW
POWER PLANTS
Treated wastewater (106m3/year)
40 OPERATING.
State
MS
MT
20
0
1995 2000 2005 2010 2015
Year
Picture 19 – Treated wastewater volume in Mt and MS. Source: the authors themselves
with data from (SNIS, 2019b).
Aiming to understand how electric power generation through wastewater treat-
ment (WWT) can contribute to the expansion and diversification of the energy
matrix, the theoretical generation potential was estimated under two scenarios.
In the first one, identified as “Current”, the current level of treatment coverage
was considered, which is 40% of urban population in MT and 59% in MS. In the
Sustainable Alternatives for Electric Power Generation in the Upper Paraguay Basin (BAP) 353. Sustainable alternatives for electric power generation
second one, hypothetically, 100% of the population would have access to waste-
water collection and treatment. Both scenarios assume that the entire volume is
biodigested and biogas is converted into electric power.
As shown in the Picture 20, the “Current” scenario estimates a potential of
1.8MW in MS and 1.2 MW in MT, with a total amount of 3 MW. In the “100%”
scenario the potential is around 12 MW, 5.6 MW in MS and 6.4 MW in MT,
CONSIDERING THE enough to supply around 34,000 people.
JOB CREATION
GLOBAL AVERAGE PER
SOURCE, THE IMPACT 6000
ON THE LOCAL JOB
MARKET DUE TO
IMPLEMENTATION OF Scope of the
sanitation coverage
GENERATION PROJECTS 4000
Current
BY OTHER RENEWABLE 100%
SOURCES PROPOSED
IN THIS STUDY WAS 2000
ESTIMATED.
0
MS MT
Picture 20 – Comparison of electric power generation potential considering two sanita-
tion coverage scenarios: Current and 100%. Source: the authors themselves based in
(SNIS, 2019b)
The projected expansion of generating capacity is illustrated in Picture 21. This
scenario considers the official projections of populational growth by state accord-
ing to IBGE (2019b), the maintenance of urbanization rate of 85.6% in MS and
81.9% in MT, collecting and treatment of 100% of wastewater produced by urban
population. According to the projections for 2030, the electric power generation
projects through biodigestion of wastewater can add around 14 MW, generate 101
GWh per year, with investments around R$ 522 million.
3614.0
13.8
13.6
13.4
13.2
13.0
MW
12.8
12.6
12.4
12.2
12.0
11.8
2020 2021 2022 2023 2024 2025 2026 2027 2028 2029 2030
Picture 21 - Projected expansion of urban sewage electricity generation capacity. %.
Source: the authors themselves based in Coelho et a. (2012) and (SNIS, 2019b)
3.5 JOB CREATION
Renewable energy employs over 11 million people around the world (data from
2018). The types of production that create the most jobs are photovoltaic (3.6
million), biofuel (2.1 million) and hydroelectric power (2.5 million). However,
when the amount of jobs created is analyzed by capacity, biogas, biofuels and
solar power, they create respectively, 20 jobs/MW, 9.9 jobs/MW and 9 jobs/MW
(IRENA, 2019).
Considering the job creation global average per source, the impact on the local job
market due to implementation of generation projects by other renewable sources
proposed in this study was estimated. Picture 22 shows these results, where one
can notice that three biggest job creators are, respectively, sugar cane bioelectric
power, photovoltaic and animal waste biodigestion. In 2030, the total amount of
people employed by these industries would be around 29,000, with potential to
raise salaries in the states in about R$486 million9 per year.
9 Average income in the states of MS and MT in 2018: R$ 1,412.50 (IBGE, 2019c)
Sustainable Alternatives for Electric Power Generation in the Upper Paraguay Basin (BAP) 373. Sustainable alternatives for electric power generation
35
30
25
Thousand jobs
20
15
10
5
-
2020 2021 2022 2023 2024 2025 2026 2027 2028 2029 2030
Animal waste Urban effluents
PV Urban solid waste (USW)
Sugar cane
Picture 22 – Projection of the number of workers involved in electric power generation
activities, by source. Source: the authors themselves based in (IRENA, 2018)
38Patrik Oening Rodrigues - Concurso Áreas que Protegem a Vida – Pantanal//WWF-Brazil
IN BRAZIL, ALTHOUGH THERE WERE IMPORTANT ADVANCES
IN EXPANDING BASIC SANITATION IN THE LAST DECADE,
THERE’S STILL A HUGE DIFFERENCE OF ACCESS TO ITS
MAJOR ELEMENTS: WATER SUPPLY AND SANITARY SEWERS.
Sustainable Alternatives for Electric Power Generation in the Upper Paraguay Basin (BAP) 394. COMBINING ALTERNATIVES FOR ELECTRIC POWER GENERATION – 2030
Foto: © ABiogás
4. Combining alternatives for electric power generation – 2030

                                         Picture 23 shows the results of projections on all electric power ge-
                                         neration alternatives mentioned in this study. The three main sources
                                         are sugar cane cogeneration, solar PV and animal waste biodigestion,
                                         representing, respectively, 55%, 21% and 20% of the energy in 2030.

                                         By the end of the period mentioned in the scenarios, these projects could generate
                                         approximately 3,690 MW, which is three times more than the power of 125 new
                                         PCHs planned for construction in the Hydrographic region of Paraguay. By 2030,
                                         these PCHs would generate around 15.3 TWh, which is equivalent to the annual
                                         consumption of 7.9 million houses.

                                                    18

                                                    16

                                                    14

                                                    12
                                         TWh/year

                                                    10

                                                     8

                                                     6

                                                     4

                                                     2

                                                     0
                                                         2020   2021    2022   2023   2024   2025   2026   2027   2028   2029   2030

                                                           Animal waste                              Urban effluents

                                                           PV                                        Urban solid waste (USW)

                                                           Sugar cane

                                         Picture 23 – Projections of electric power generation in the states of MT and MS. Source:
                                         the authors themselves based in (Coelho et al., 2012; IBGE, 2019, ANEEL, 2019)

                                         When considering the construction of 100% of the new PCHs (adding 1.72W to
                                         the MW energy matrix in 2023) and a 50% average capacity factor, the energy
                                         potential would be 5 TWh per year (5,000 GWh/year).

                                         According to Picture 23, as indicated by the red line, the same amount of energy
                                         produced by PCHs could be generated by alternative sources (solar PV, biomass,
                                         USW, wastewater and animal waste), without the need to build more dams. The
                                         socioenvironmental benefit would be preservation of existing ecosystems without
                                         harming the hydro regime.

42
The investment for these alternative projects is estimated in R$ 20.3 billion, around
R$ 5.5 million per MW (Table 4). Data from Brazilian Association of PCHs and
CGHs show the economic viability of PCHs projects between R$ 5 million and
R$ 6 million per MW (ABRAPCH, 2017). The cost to choose for other types of
sources are quite similar to the cost estimated by the hydroelectric sector.
Table 4 – Investment cost and investment per MW by alternative source
CAPEX
Source MM R$/MW
(R$ Billion)
Animal Waste 1.6 3.8
Wastewater 0.5 37.9
Solar PV 7.6 3.7
USW 1.3 20.3
Sugar cane (Bioelectricity) 9.3 8.2
Total 20.3 5.5
Note: In December 2019, the dollar to real conversion rate was on average US$1 = R$ 4.
Source: Banco Central do Brasil
Three important characteristics of this alternative generation system must be
highlighted. The first one is the renewable aspect, which can use solar power as
well as economic activities waste. The second is the combination of sugar cane
waste cogeneration and animal waste biodigestion; which can compensate the
issue of light hours in solar PV systems. Furthermore, the use of waste for energy THE
generation allows a proper management, meeting the current regulations. The SOCIOENVIRONMENTAL
third characteristic is the energy generation would be distributed, raising the
levels of security in the system, decreasing costs and losses with transmission in
BENEFIT WOULD BE
long distances. PRESERVATION OF
EXISTING ECOSYSTEMS
One can conclude that is possible to generate energy in the Midwest in a distributed
way, meeting the demands of populational and economic growth very easily, by
WITHOUT HARMING
using renewable sources of energy and aligning them with the region’s production. THE HYDRO REGIME.
This decentralized model of energy development could place MW ahead of the
rest of Brazil when it comes to this subject.
The highlight is the sugar cane biomass energy, followed by animal waste, both
largely available in the region. Third is solar PV, which can overcome by 2030 the
power from the 125 new PCHs currently under study, but in a smaller area than
the lakes formed by the hydro plants.
Sustainable Alternatives for Electric Power Generation in the Upper Paraguay Basin (BAP) 43REFERENCES
References

                  AGÊNCIA NACIONAL DE ÁGUAS. Plano de recursos hídricos da RH-Paraguai. Brasília: ANA,
                  2018a.
                  ______. Plano de recursos hídricos da Região Hidrográfica do Paraguai: Resumo
                  Executivo. Brasília: ANA, 2018b.
                  AGÊNCIA NACIONAL DE ENERGIA ELÉTRICA. Atlas de energia elétrica do Brasil. Brasília:
                  ANEEL, 2008.
                  ______. Banco de Informações de Geração. Brasília: ANEEL, 2019.
                  ASSOCIAÇÃO BRASILEIRA DE EMPRESAS DE LIMPEZA PÚBLICA E RESÍDUOS ESPECIAIS.
                  Panorama dos Resíduos Sólidos no Brasil 2016. Disponível em: . Acesso em: 28 set. 2019.
                  ASSOCIAÇÃO BRASILEIRA DE PEQUENAS CENTRAIS HIDRELÉTRICAS. Notícias Custo médio
                  de PCHs e CGHs ficou em R$ 225/MWh desde 2010, aponta estudo. ABRAPCH, Curitiba, 3 ago.
                  2017. Disponível em: . Acesso em: 15 out. 2019.
                  BRASIL. Ministério das Cidades. Guia técnico de aproveitamento energético de biogás em
                  estações de tratamento de esgoto. Brasília: Ministério das Cidades, 2015.
                  ______. Ministério das Cidades. Viabilidade técnico-econômica de produção de energia
                  elétrica em ETEs no Brasil a partir do biogás. Brasília: Ministério das Cidades, 2016.
                  ______. Ministério das Cidades. Secretaria Nacional de Saneamento Ambiental. Sistema Nacional
                  de Informações sobre Saneamento: Diagnóstico do Manejo de Resíduos Sólidos
                  Urbanos – 2016. Brasília: Ministério das Cidades, 2018.
                  ______. Ministério das Minas e Energia. Empresa de Pesquisa Energética. Plano Decenal de
                  Expansão de Energia 2027. Brasília: MME/EPE, 2018.
                  ______. Ministério das Minas e Energia. Empresa de Pesquisa Energética. Anuário Estatístico de
                  Energia Elétrica. Brasília: MME/EPE, 2018.
                  ______. Secretaria Nacional de Saneamento Ambiental. Probiogás. Tecnologias de digestão
                  anaeróbia com relevância para o Brasil: substratos, digestores e uso de biogás. Brasília:
                  Ministério das Cidades, 2015.
                  ______. Lei nº 12.305, de 2 de agosto de 2010. Institui a Política Nacional de Resíduos Sólidos;
                  altera a Lei no 9.605, de 12 de fevereiro de 1998; e dá outras providências. Brasília, [2010]. Disponível em:
                  . Acesso em: 23 out. 2019.
                  CARBOGÁS. Dados técnicos gaseificadores. Mauá: Carbogás, 2018.
                  ______. Gaseificadores. Mauá: Carbogás, 2019.
                  CENTRO NACIONAL DE REFERÊNCIA EM BIOMASSA. Projeto Gaseifamaz. São Paulo: Cenbio/
                  IEE/USP, 2006.
                  COELHO, S. T. et al. Tecnologias de produção e uso de biogás e biometano. São Paulo: IEE-
                  USP, 2018.
                  COELHO, S.T.; MONTEIRO, M. B.; KARNIOL, M. R.; GHILARDI, A. Atlas de Bioenergia do
                  Brasil. São Paulo: Cenbio, 2012.
                  COMPANHIA NACIONAL DE ABASTECIMENTO. A Geração Termoelétrica com a Queima do
                  Bagaço de Cana-de-Açúcar no Brasil. Brasilia: Conab, 2011.
                  DANTAS, D. N. Uso da biomassa da cana-de-açúcar para geração de energia elétrica:
                  análise energética, exergética e ambiental de sistemas de cogeração em sucroalcooleiras do interior
                  paulista. 2010. Dissertação (Mestrado em Ciências da Engenharia Ambiental) – Escola de Engenharia
                  de São Carlos, Universidade de São Paulo, São Paulo, 2010.
                  Duffie, J. A.; Beckman, W. A. Solar engineering of thermal processes. 4ª ed. New York: John Wiley &
                  Sons, 2013.
                  EMPRESA DE PESQUISA ENERGÉTICA. Balanço Energético Nacional 2018. EPE, 2018.
                  Disponível em: . Acesso em: 10 set. 2019.

46
You can also read