Woodland natural capital accounts, UK: 2020 - Office for National ...
←
→
Page content transcription
If your browser does not render page correctly, please read the page content below
Statistical bulletin

Woodland natural capital accounts, UK: 2020
Natural capital accounts containing information on ecosystem services for woodlands in
the UK.

Contact:                        Release date:                       Next release:
Hazel Trenbirth and Adam Dutton 28 February 2020                    To be announced
natural.capital.team@ons.gov.uk
+44 (0)1633 580051

                                  Correction
11 March 2020 11:34
Due to a typing error, a single word was missing in the Energy: wood fuel paragraph of Section 5: Provisioning
ecosystem services: quantity and value, which has now been corrected.

26 March 2020 14:00
A correction has been made to the total annual value of ecosystem services. This was because of a formula error
in the spreadsheet. This has affected the Main points, Section 4: Overall quantity and value of woodland
ecosystem services, Figure 8 and Woodland natural capital accounts, UK: supplementary information . We
apologise for any inconvenience this may have caused.

                                                                                                            Page 1 of 47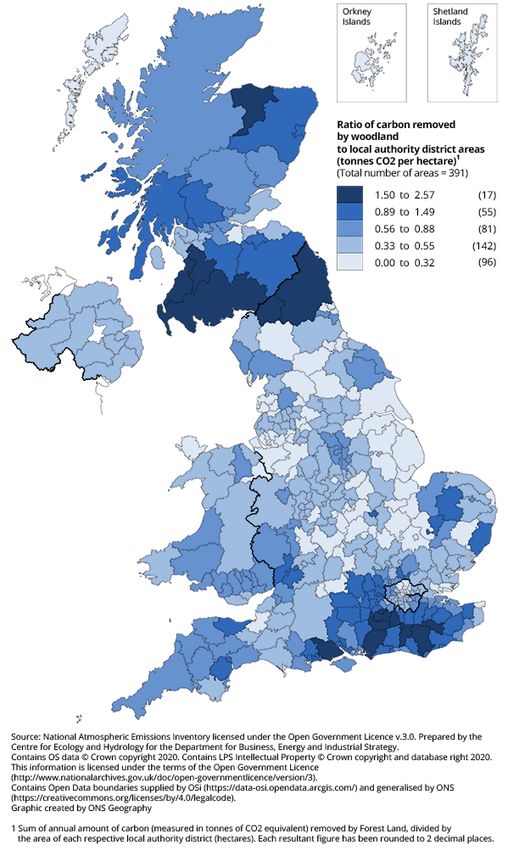
Table of contents
1. Main points

2. Size of the area covered by woodland

3. Condition of UK woodlands

4. Overall quantity and value of woodland ecosystem services

5. Provisioning ecosystem services: quantity and value

6. Regulating ecosystem services: quantity and value

7. Cultural ecosystem services: quantity and value

8. Asset value of woodlands

9. Woodland ecosystem services data

10. Glossary

11. Measuring the data

12. Strengths and limitations

13. Related links

                                                               Page 2 of 47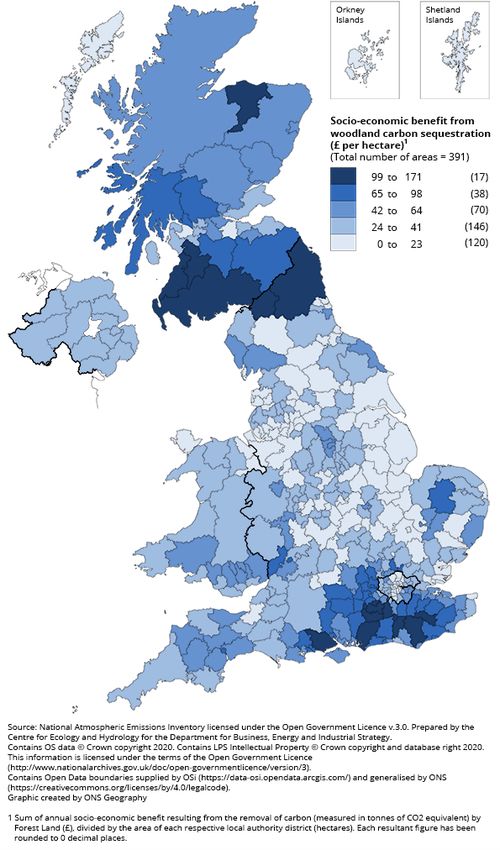
1 . Main points

      There were an estimated 475 million visits to woodlands in 2017, on which the public spent £515.5 million
      collectively.

      The non-market benefits of woodland exceed the market benefits of timber by approximately 12 times;
      timber represents £275.4 million out of £3.3 billion total annual value of woodland in 2017.

      The asset value of UK woodlands was estimated as £129.7 billion in 2017, with timber representing £8.9
      billion (6.9%).

      The removal of air pollution by woodland in the UK equated to a saving of £938.0 million in health costs in
      2017.

      Woodland in the UK removed 18.1 million tonnes of carbon dioxide equivalent in 2017, equating to a value
      of £1.2 billion; this is equivalent to 4% of total UK greenhouse gas emissions in 2017. 1

      Urban woodlands cooled 11 city regions sufficiently on hot days to save £229.2 million in labour
      productivity and avoided air conditioning costs during 2018.

      Woodlands occupy 13% of the land area of the UK with 3.2 million hectares.

Notes for: Main points

   1. Total greenhouse gas emissions in 2017 were 460 MtCO2e.

2 . Size of the area covered by woodland

Woodlands in the UK are tree-covered areas, which include plantation forests, more natural forested areas, and
lower density or smaller stands of trees.

The natural world is valued in many different and important ways, but it can be valued as a set of assets
supplying goods and services that the economy and society benefit from. For example, food, water or clean air.
These habitat capital accounts monitor the size and condition of woodland assets as well as the quantity and
value of the services supplied.

                                                                                                             Page 3 of 47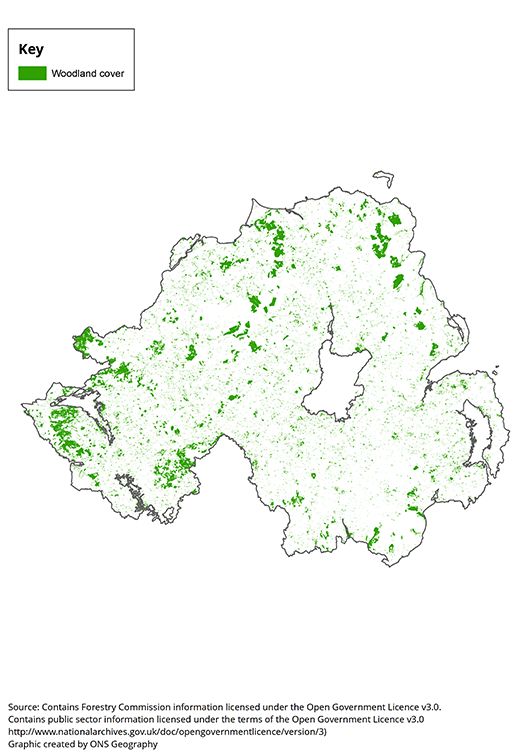
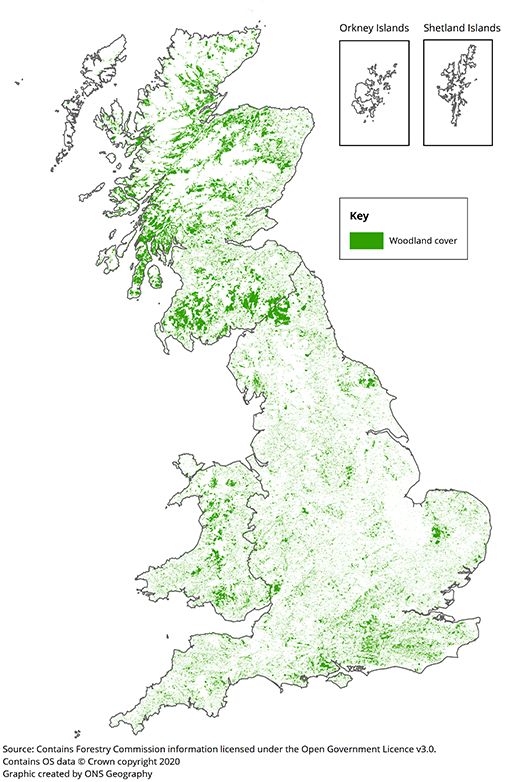
Figure 1: Extent of Great Britain woodland, 2018

Source: Forestry Commission – National Forest Inventory

                                                          Page 4 of 47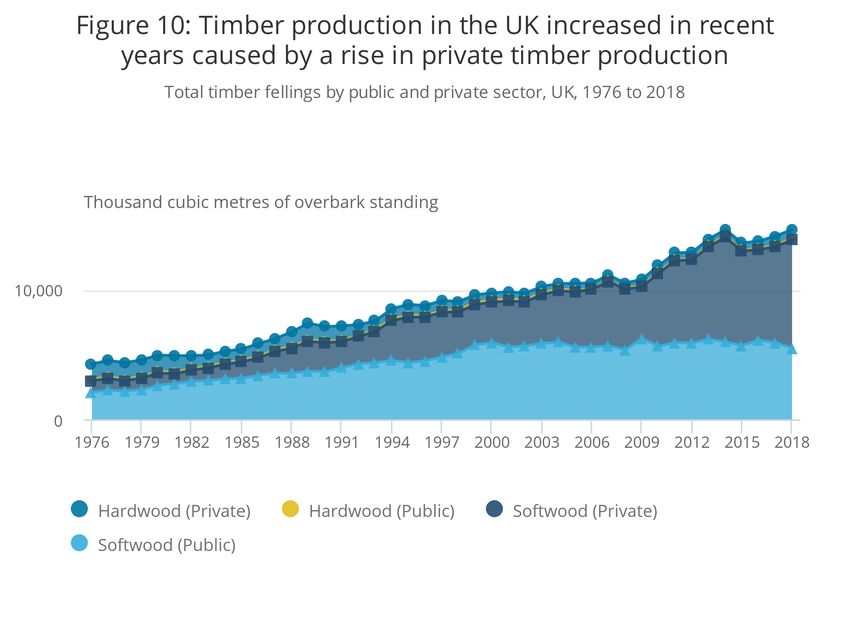
Figure 2: Extent of Northern Ireland woodland, 2018

Source: Forestry Commission – National Forest Inventory

Land covered by forestry (Figures 1 and 2) has increased steadily by 4.4% from 3.05 million hectares in 2009 to
3.19 million hectares in 2019. Scotland has 46% of the UK’s woodlands, England has 41%, Wales has 10% and
Northern Ireland has 4%. As a percentage of the total land area, woodlands account for:

       13% of the UK

       10% of England

       15% of Wales

       18% of Scotland

       8% of Northern Ireland

Conifers account for approximately half (51%) of the UK woodland area in 2019 (Figure 3), with just over half
(55%) of these conifers privately owned. In contrast, the majority (92%) of broadleaved woodland is privately
owned.

                                                                                                                Page 5 of 47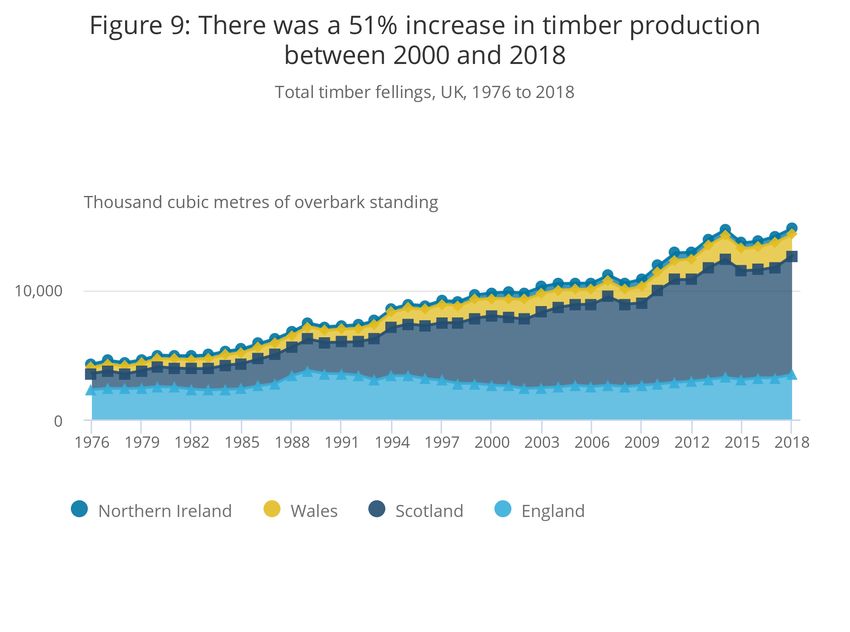
The proportion of woodland that is publicly owned fell slightly in the past 10 years, from 29% (872,000 hectares)
of total woodland in 2009 to 27% (863,000 hectares) of total woodland in 2019, with the private ownership
proportion rising from 71% (2,182,000 hectares) in 2009 to 73% (2,325,000 hectares) in 2019.

National Forest Inventory (NFI) statistics from the Forestry Commission have been used for the extent account as
it provides the most up-to-date dataset focussing solely on woodland. Currently, only woodland used for forestry
that is over 0.5 hectares in extent and greater than 20 metres in width is included in the extent account. This
includes areas recently felled but expected to be replanted and open space within woodland.

Figure 3: Conifers accounted for 51% of UK woodland area in 2019

Extent of woodland, UK, 2007 to 2019

Source: Forest Research – National Forest Inventory

In addition to woodland areas, the Forestry Commission estimates there are 390,000 hectares of small woods in
Great Britain (non-NFI wooded areas of over 0.1 hectare in extent). There are also 255,000 hectares of groups of
trees (that is, clusters and linear tree features of less than 0.1 hectare in extent) and an estimated total canopy
cover of 97,000 hectares from lone trees in Great Britain (Figure 4). For Great Britain, that is a total woodland
area of 3,719,000 hectares.

                                                                                                              Page 6 of 47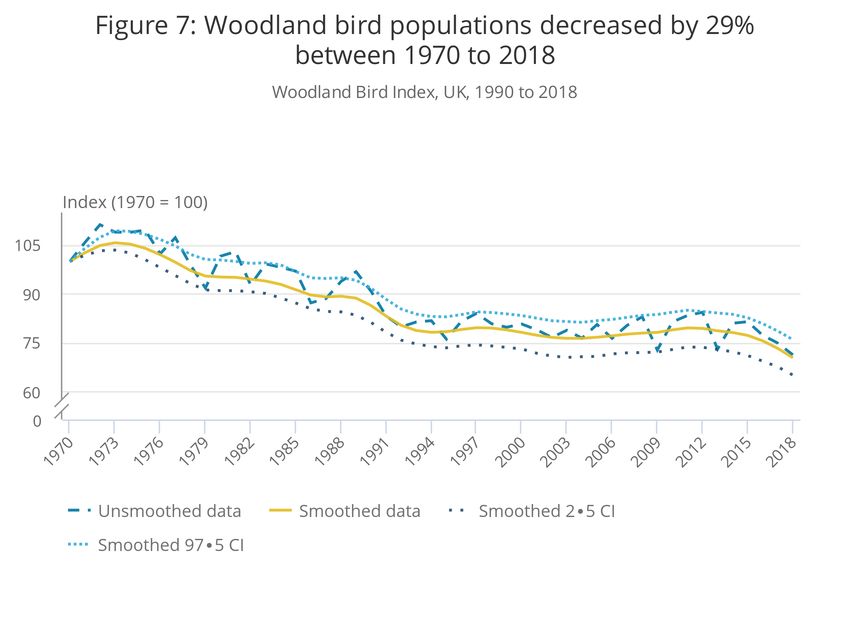
Figure 4: Lone trees represented 2.6% of woodland area in 2019 for Great Britain

Total woodland extent, UK and Great Britain, 2019

Source: Forest Research and Forestry Commission – National Forest Inventory

3 . Condition of UK woodlands

The health of woodlands can be measured through a range of metrics. Woodland age structure, the variety of
trees present, presence of different mammals and birds, the understory vegetation, and the presence of
deadwood all reflect woodland ecological health.

Ecologists regularly use a simple set of descriptive words to summarise the overall status of a habitat or species:
“Favourable” being good, “Unfavourable” being bad, and “Destroyed” meaning the habitat at a site is no longer
present and there is no prospect of being able to restore it. These descriptions are based on an assessment of an
appropriate set of metrics dependent on what is being measured.

While certified woodlands and access are increasing, several indicators of woodland condition are unfavourable
or in decline (Table 1). Out of the seven NFI condition indicators, two are considered unfavourable across the
majority of woodland: the presence of veteran trees and deadwood (Figure 5).

The butterfly and bird indices for woodlands are both in a long-term decline, having a negative impact on
biodiversity. Woodland fires in the UK also have a negative impact. There has been a significant rise in the area
of woodlands having large fires over the last decade, with 29,396 hectares affected during 2019 to 2020 (Table
7). There has been an increase in the area of Forest Stewardship Council (FSC) certified woodlands and
increased access to woodlands for the population. An estimated 74% of the population have access to woodland
within four kilometres of their home, as of 2017.

                                                                                                              Page 7 of 47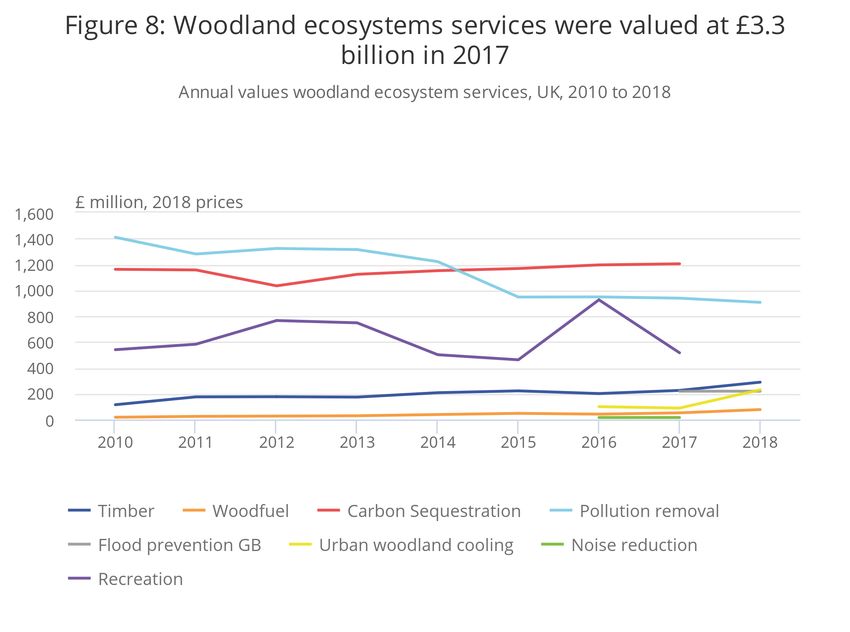
Table 1: Summary of the condition of UK woodlands
                                                                                                   Short term
Type             Indicator              Condition                               Long term trend
                                                                                                   trend

Biodiversity     Butterfly index UK     Long term decline 1990 to 2018          Declining          Little or no
                                                                                                   change

                 Woodland bird          Decrease of 29% between 1970 to         Declining          Declining
                 index UK               2018

                 Tree age structure     NFI first assessment 42% area
                 GB                     unfavourable

                 Regeneration GB        NFI first assessment 0% area
                                        unfavourable

                 Veteran trees GB       NFI first assessment 99% area
                                        unfavourable

                 Tree health GB         NFI first assessment 85% area
                                        favourable

                 Deadwood GB            NFI first assessment 77% area
                                        unfavourable

                 Herbivores &           NFI first assessment 49% area
                 grazing GB             favourable

                 Invasive plant         NFI first assessment 92% area
                 species GB             favourable

Certified        Area FSC certified     Improvement 32% from 2001 to 2019       Increasing         Increasing
woodlands        woodlands UK

Space for        Access to              Improvement 0.1% from 2012 to 2016      Increasing         Increasing
people           woodlands UK

Protected sites Scotland SSSIs          51% favourable in 2018
                /SACs

                 England SSSIs          37% favourable 2018/19

Pressure         Wildfires UK           2019-20 29,396 hectares affected        Increasing         Increasing
indicators                              (EFFIS data)

Source: Department for Environment, Food and Rural Affairs; British Trust for Ornithology; Royal Society for the
Protection of Birds; Joint Nature Conservation Committee; Butterfly Conservation Society; Centre for Ecology and
Hydrology; Forest Research; Woodland Trust; and European Forest Fire Information System

Notes

   1. The long-term and short-term trend vary depending on the dataset. Each dataset has a different time
      series; therefore short term refers to the most recent year’s data available. Back to table

There is significant variation in condition scores across various metrics. For example, very few forests are
“favourable”, but 85% of woodland is favourable for tree health (Figure 5).

                                                                                                                  Page 8 of 47
Figure 5: 85% of woodlands are in a favourable condition for tree health in Great Britain
Summary of National Forest Inventory (NFI) condition indicators 2010 to 2015 survey cycle, percentage of area classified as
unfavourable, intermediate or favourable
Source: Forest Research – National Forest Inventory
Biodiversity
Biodiversity, though its impact is hard to quantify, lies at the heart of or at least affects all woodland ecosystem
services. Examples of biodiversity include the roles of fungi and bacteria, nutrient cycles, and culturally important
mammals and birds. Increasing biodiversity improves the provision and sustainability of ecosystem services (ZIP,
2.67MB). The ecology of woodlands is mainly determined by the amount of light beneath the canopy, if the tree
species are native or non-native, the age of the trees, and the number of different microhabitats available. The
Forestry Commission identified (PDF, 259KB) that while there is no definitive relationship between tree age and
biodiversity, there is evidence of an increase in biodiversity with stand age. The analysis for mammals and birds
revealed that after a short initial increase, as trees grow from saplings, there is a decline in biodiversity until the
trees reach 20 years of stand age, then it increases.
Indicators of biodiversity in woodlands investigated in this publication include the woodland butterflies and bird
indices, age of the trees, presence of veteran trees, health of the trees, and impacts from herbivore grazing and
invasive plant species.
Page 9 of 47Butterfly index
The number of woodland butterflies has been decreasing over time. In 2012, it began to flatten, showing little to
no change in the index, as seen in the smoothed data. According to the Department for Environment, Food and
Rural Affairs’ (Defra’s) Butterflies in England report , this long-term decline is largely because of fewer open
spaces within woodland and a lack of management of these woodlands. This includes thinning trees within
woodlands to allow sufficient light in, thereby helping with the growth of multiple food sources. When unmanaged,
these food sources do not grow sufficiently, leaving butterfly species without the necessary nutrients to survive
within the woodland.
The unsmoothed (raw) index for butterflies shows fluctuation throughout the entire time series (Figure 6). This is
because of the butterflies’ response to weather conditions, such as the summer heatwave in 2018 . This change
in weather caused around two-thirds of species to increase that season.
The State of the UK’s Butterflies 2015 report observes that many butterfly species have been declining since
1976. But there are three species that have shown a positive response: the ringlet, orange-tip and peacock.
Figure 6: The woodland butterfly population is in a long-term decline
Woodland Butterfly Index, UK, 1990 to 2018
Source: Butterfly Conservation; Centre for Ecology and Hydrology; Department for Environment, Food and Rural Affairs –
Woodland Butterfly Index
Page 10 of 47Bird index
Woodland bird populations decreased by 29% between 1970 to 2018, a very similar decrease to that of the
butterfly population but at a much slower rate. We can see that there was a steep decrease in the 1990s, with the
index then beginning to flatten. That is, until 2012, when the index once again began to decline (Figure 7). Some
possible reasons for this decline are outlined in the following, but none of these can be confirmed and the Royal
Society for the Protection of Birds (RSPB) is investigating for a more concrete explanation.
The majority of woodland bird species have either decreased (32%) or had no change at all (46%) over the long
term, with a minority of 22% increasing over time such as the great spotted woodpecker and the nuthatch.
According to Defra’s Wild Bird Populations in the UK, 1970 to 2018, this decrease may be a result of a lack of
woodland management along with increased deer-browsing pressure. Both of these result in a lack of diversity
within woodland and few suitable nesting habitats.
The willow tit species has experienced the largest decline at 94% since 1970. While the reason for this large
decline is unclear, the RSPB’s managing willow tit habitat project highlights changes in habitat structures and the
drying out of woodland soils as possible reasons for this, among others.
Figure 7: Woodland bird populations decreased by 29% between 1970 to 2018
Woodland Bird Index, UK, 1990 to 2018
Source: British Trust for Ornithology; Royal Society for the Protection of Birds; Department for Environment, Food and Rural
Affairs – Woodland Bird Index
Page 11 of 47Bats
Some bat species are heavily dependent on woodlands and so can also be used as a biodiversity condition
indicator for woodlands. The Bat Conservation Trust has identified six species that are woodland specialists.
These are Bechstein’s bats, barbastelles, Natterer’s bats, noctules, lesser horseshoe bats and brown long-eared
bats. The Bat Conservation Trust will be instigating monitoring of woodland bat populations in summer 2020, with
an initial baseline index value available in spring 2021 and a provisional trend available from spring 2023.
National Forest Inventory (NFI) condition indicators
The NFI survey is based on data collected between 2009 and 2015. Full details on the Forest Research’s NFI
survey methods are available.
Table 2: Summary NFI condition indicators for Great Britain, 2010 to 2015 survey cycle
Unfavourable Intermediate Favourable
Invasive species 7.3 0.8 91.9
Tree health 2.6 12.9 84.5
Herbivores and grazing 40.0 11.4 48.6
Regeneration 0.0 89.4 10.6
Age distribution 42.0 46.9 11.2
Deadwood 76.6 17.3 6.1
Veteran trees 99.3 0.2 0.5
Source: Forest Research – National Forest Inventory
A varied tree age structure in woodland benefits biodiversity as differently aged trees provide different ecological
habitats. As a percentage of the total trees in Great Britain :
24.3% of trees are aged 20 years or younger
33.0% of trees are aged 21 to 40 years
23.9% of trees are aged 41 to 60 years
18.8% of trees are aged 61 years or older
For a woodland to be classified as favourable, it needs to have young, intermediate and old trees present.
Regeneration is an important indicator of biodiversity to predict the future health of woodlands. It is an
assessment of seedlings, saplings and young trees. To be classed as favourable, the woodland areas sampled
need to have trees with a 4cm to 7cm diameter as well as having saplings and seedlings present.
Tree diseases and pests can have a negative impact on woodland biodiversity. While dead and decaying wood
provides more light to reach the forest floor and an important micro-habitat, rapid widespread tree death can harm
ecological health.
Page 12 of 47The NFI investigated tree health. This was calculated using a combination of survey data on tree mortality, tree
health indicator of crown dieback and tree diseases for a condition calculator.
A Statutory Plant Health Notice (SPHN) is issued to fell diseased trees to prevent the spread of diseases and
pests.
Table 3: Number of sites where a Statutory Plant Health Notice has been served, UK, between 2010 to 2011 and
2018 to 2019
Year England Wales Scotland Northern Ireland UK
2010 to 2011 114 46 1 10 171
2011 to 2012 131 90 14 16 251
2012 to 2013 168 89 123 15 395
2013 to 2014 244 272 76 28 620
2014 to 2015 140 71 9 17 237
2015 to 2016 73 57 34 3 167
2016 to 2017 75 53 71 0 199
2017 to 2018 43 153 71 14 281
2018 to 2019 136 215 491 0 842
Source: Forestry Commission, Scottish Forestry, Natural Resources Wales, and Forest Service
Table 4: Felling areas under Statutory Plant Health Notices, thousand hectares, UK, between 2010 to 2011 and
2018 to 2019
Year England Wales Scotland Northern Ireland UK
2010 to 2011 1.2 0.8 0.0 0.3 2.3
2011 to 2012 0.5 0.5 0.1 0.1 1.1
2012 to 2013 0.5 1.5 0.4 0.2 2.5
2013 to 2014 0.8 4.6 0.3 0.5 6.2
2014 to 2015 0.3 0.4 0.0 0.0 0.7
2015 to 2016 0.2 1.5 0.1 0.0 1.8
2016 to 2017 0.3 0.2 0.2 0.0 0.7
2017 to 2018 0.1 1.3 0.3 0.1 1.7
2018 to 2019 0.6 1.9 1.4 0.0 3.8
Source: Forestry Commission, Scottish Forestry, Natural Resources Wales, and Forest Service
Invasive species are one of the major causes of biodiversity loss. One estimate put the cost of invasive non-
native species in the UK at £1.8 billion per year. The NFI estimates 221,723 hectares are classified as
unfavourable for invasive species. For example, rhododendron is a prominent invasive species in UK woodlands.
Page 13 of 47Damage from herbivores may impact biodiversity when there is excessive browsing, especially from deer, as it
can impact on natural regeneration. The NFI investigated the damage done by herbivores from browsing and
stripping the bark damage and found woodlands classified as unfavourable for grazing and herbivore damage
account for 40% of total woodlands (Table 2).
The presence of veteran trees in a woodland is considered a boost to biodiversity as they create unique micro-
habitats supporting a wide range of other organisms. Forest Research uses Natural England’s definition of a
veteran tree (PDF, 339KB) as “A tree that is of interest biologically, culturally or aesthetically because of its age,
size or condition”. The NFI considers a woodland as being in a favourable condition when two or more veteran
trees are present per hectare. The inventory only classified 0.5% of all woodland area as favourable for veteran
trees (Table 2). However, veteran trees are commonly found outside of woodlands in parklands, hedgerows and
wood pasture, which are not currently included as they do not meet the NFI’s classification of a woodland.
Deadwood is important for woodland biodiversity. It provides an important habitat for small animals, cavity-nesting
birds, insects dependent on decomposing wood and decomposer fungi. The NFI considers a favourable condition
for deadwood to be greater than or equal to 80 cubic metres per hectare for volume of deadwood lying or
standing. Of all woodland in Great Britain, 6.1% is considered favourable for deadwood (Table 2).
Certified woodlands
In the UK, certified woodland has been independently audited against the UK Woodland Assurance Standard
(UKWAS). One certification scheme is the FSC. In March 2019, 1.4 million hectares of woodland in the UK were
FSC certified. This represented 44% of the total UK woodland area and is an increase of 32% since December
2001. To be FSC certified, woodland managers are required to meet certain standards to ensure the forest is
being managed in a way that preserves the natural ecosystem. Another scheme is the Programme for the
Endorsement of Forest Certification (PEFC) . At present, all woodlands in the UK that are certified under PEFC
are also certified under FSC.
Access to woodlands
Accessible woodland is an indicator of the ability to supply recreational services to the population. It is defined as
“any site that is permissively accessible to the general public for recreational purposes”. The area of accessible
woodland increased slightly (0.1%) between the years 2012 to 2016 (Table 5). The estimated percentage of the
UK population with access to 20 hectares of woodland within four kilometres of their home also increased, from
61% in 2007 to 74% in 2017.
Table 5: Area of recorded accessible woodland, hectares, UK, 2012 and 2016
Area accessible woodland hectares %
Region 2012 2016 change
England 382,407 397,149 3.9
Wales 121,192 120,317 -0.7
Scotland 780,484 765,204 -2.0
Northern Ireland 73,696 75,929 3.0
UK total 1,357,779 1,358,599 0.1
Source: Woodland Trust – Space for people
Page 14 of 47Protected sites
There are several formal designations, including Special Areas of Conservation (SACs) or Sites of Special
Scientific Interest (SSSIs) in Great Britain and Areas of Special Scientific Interest (ASSIs) in Northern Ireland. An
SSSI or ASSI is an area of interest to science that has rare fauna or flora present or important geological or
physiological features. In Northern Ireland, the area of woodland with a protected site designation of SSSI or
ASSI and SAC is 4.4% of total woodland; for Great Britain, this is 8.3% of total woodland.
In 2018, Scottish Natural Heritage identified 50% of its broadleaved, mixed and yew woodland SSSIs and SACs
as being in a favourable condition. Of Scotland’s coniferous woodland protected areas, 61% are in favourable
condition. There were improvements across all broad woodland types in protected areas from 2007, when only
46% of broadleaved, mixed and yew woodlands were favourable and 53% of coniferous sites were favourable.
Scottish investigations by the Joint Nature Conservation Committee (JNCC) revealed no obvious differences in
the underlying pressures and issues affecting the condition of coniferous woodlands in comparison with
broadleaved woodlands.
The most frequently reported activity for unfavourable condition is over-grazing. Over-grazing leads to a lack of
regeneration. Forestry England identified for 2018 to 2019 that 37% of woodland SSSIs are in favourable
condition, 61% are in unfavourable recovering conditions and 1% are in unfavourable declining conditions with
high deer populations browsing the native flora.
Table 6: Summary statistics for protected sites for broadleaved and mixed woodlands for the UK and coniferous
woodlands for Scotland, 2005
SAC SSSI/ASSI Total
Broad leaved and mixed
Favourable condition 25% 45% 43%
Monitoring coverage UK England,
Scotland,
Northern Ireland
Coniferous
Favourable condition 38% 55% 50%
Monitoring coverage Scotland only Scotland only
Source: Joint Nature Conservation Committee – Habitats
Only 25% of the reported SAC features were in a favourable condition in 2005 for the UK broadleaved and mixed
woodlands, and 38% of the coniferous SACs in Scotland were in a favourable condition (Table 6).
Pressure indicators
Pressure indicators are defined here as damage inflicted on woodlands by humans. We can report on litter, fly
tipping, dog fouling, vandalism and farm waste. Wildfires can also be considered a pressure indicator; most UK
wildfires are started by people, with and without intent.
Wildfires are increasingly in the news worldwide as climate change leads to hotter and drier springs and
summers. In some parts of the world, fire has long been an important part of natural and human ecological
management. This is especially true for woodlands. However, in the UK woodlands, fires almost all have negative
impacts.
Page 15 of 47Most UK wildfires are set by humans rather than natural. The vast majority of UK wildfires occur in open
landscapes. Most of the prominent wildfires in recent years within the UK have occurred on mountains, moors,
heaths and grasslands.
Climate change is expected to increase the number of woodland wildfires in the UK. Management of forests is
being adapted to cope with this, including more broken up planting, training of fire services and species changes.
There are two main sources of data on wildfires: reported fires and satellite data. Reported fires catch wildfires of
all sizes attended by England’s Fire and Rescue Services but may miss some remote fires that are addressed by
land managers. Satellite data capture fires in both built up and remote places but might miss smaller fires under
30 hectares. Forestry Commission estimates (PDF, 275KB) of woodland fires are based on reported data from
incidents attended by Fire and Rescue Services and so may miss some remote fires. EU-wide reporting on
overall forest wildfires is based on satellite data. For this reason, the two datasets are not directly relatable, but
comparison can be useful (Table 7).
Satellite data for the most recent years in the UK saw an apparent increase in the number and area of burning
incidents. The two datasets appear to show some correlation for wildfires in earlier years and later years with the
correlation of mild winters with higher temperatures, heatwaves, and prolonged dry periods across spring and
summer. Periods of low wildfires correlate with heavy periods of rainfall in spring and summer as well as wetter
winters. A large number of small fires are excluded from the European Forest Fire Information System (EFFIS),
meaning the number of fires is smaller.
Table 7: The total area of woodland fires in both datasets appear to correlate with woodland fires increasing in
size, England and UK, between 2010 to 2011 and 2019 to 2020
FC Woodland Fires England EFFIS recorded Fires UK
Year Number Area hectares Number Area hectares
2010 to 11 7,986 1,276 0 0
2011 to 12 8,917 8,675 44 17,197
2012 to 13 2,454 423 0 0
2013 to 14 5,058 1,508 16 5,445
2014 to 15 3,138 881 1 85
2015 to 16 5,067 1,410 4 2,127
2016 to 17 4,186 804 9 1,197
2017 to 18 19 5,126
2018 to 19 79 18,031
2019 to 20 137 29,396
Source: Forestry Commission analysis of Fire and Rescue Service Incident Recording System; National Forest
Inventory; and European Forest Fire
Notes
1. Number of woodland fires and area in hectares for England from Forestry Commission. Back to table
2. Number of woodland fires and area in hectares for UK fires from EFFIS. Back to table
3. EFFIS data are for calendar years. Back to table
Page 16 of 474 . Overall quantity and value of woodland ecosystem
services
This section assesses the contribution woodland services provide to the economy and society.
Table 8: Woodland annual physical flow by service, UK, 2010 to 2017
Type
Provisioning Regulating Cultural
service
Carbon Pollution Noise
Year Timber Woodfuel Recreation Recreation
Sequestration removal reduction
Total fellings (000's m3 Million tonnes Thousand Number Visits (millions) Time at habitat
overbark standing) tonnes buildings (million hours)
benefited
000s
2010 10,363 1,544 19 274 356 388
2011 11,345 1,544 19 273 371 414
2012 11,263 1,666 17 277 370 492
2013 11,983 1,972 18 278 399 496
2014 12,405 2,277 18 277 435 564
2015 11,255 2,400 18 273 448 544
2016 11,455 2,339 18 271 466 655
2017 11,564 2,622 18 269 167 475 718
Source: Office for National Statistics – Woodland natural capital accounts
The value of woodland ecosystem services was estimated at £3.3 billion in 2017 (Figure 8). Data are only
available for the seven ecosystem services annual valuations in 2017. This is a partial valuation with potentially
significant exclusions such as food and Christmas trees.
Page 17 of 47Figure 8: Woodland ecosystems services were valued at £3.3 billion in 2017
Annual values woodland ecosystem services, UK, 2010 to 2018
Source: Office for National Statistics – Woodland natural capital accounts
5 . Provisioning ecosystem services: quantity and value
Provisioning ecosystem services creates products. Within woodlands, these products include timber, food and
bioenergy sources.
Timber fellings
Between 2000 and 2018, there was a 51% increase in timber production (Figure 9), with 14,797,496m 3 overbark
standing timber fellings in 2018.
Page 18 of 47Figure 9: There was a 51% increase in timber production between 2000 and 2018
Total timber fellings, UK, 1976 to 2018
Source: Forestry Commission – Forestry Statistics 2019
Scottish production has driven the UK trend, with production increasing 72% between 2000 and 2018 (Figure 9).
In 2018, 62% of timber was sourced from Scotland, 23% from England, 11% from Wales and 3% from Northern
Ireland.
Page 19 of 47Figure 10: Timber production in the UK increased in recent years caused by a rise in private timber
production
Total timber fellings by public and private sector, UK, 1976 to 2018
Source: Forestry Commission – Forestry Statistics 2019
Notes:
1. Hardwood includes broadleaved trees such as oak, birch and beech.
2. Softwood includes coniferous trees such as spruce, pine and larch.
Private sector production has driven much of the increase in timber fellings. In 2000, 62% of timber came from
the public sector; this reduced to 38% in 2018 (Figure 10). The change is primarily because of differences in the
age structure and timing of timber production between woodlands on the public and private forest estates. This is
a result of a period of high levels of planting by the private sector in Scotland between 1970 and the late 1980s.
The proportion of timber that is softwood and hardwood has remained fairly constant. In 2000, 93% of timber
removed was softwood, rising to 94% in 2018.
Page 20 of 47Figure 11: Woodfuel increased to 21% of total timber in 2018
Total fellings showing proportion wood fuel, UK, 2000 to 2018
Source: Forestry Commission – Forestry Statistics 2019
The proportion of timber used for wood fuel increased from 3% in 2000 to 21% in 2018 (Figure 11). However,
data collection methods have improved, and this may account for some of the increase. The other uses of wood
processors include wood-based panel mills, pulp, paper mills and exports.
Page 21 of 47Figure 12: With increasing removals and increasing prices, timber had a series high in 2018
Timber provisioning excluding wood fuel annual value, UK, 2000 to 2018
Source: Forestry Commission – Forestry Statistics 2019
Figure 12 shows the value of timber excluding that which is used for wood fuel; this is presented in the following
Energy: wood fuel subsection. The annual value of timber had a series high in 2018 at £288 million. Fluctuations
in value were because of changes in stumpage price. The stumpage price is the price paid per standing tree for
the right to harvest it. Using projected timber removals over the next 100 years, the asset valuation of the timber
provisioning service excluding wood fuel reached £8 billion in 2018. Observing recent trends and Forestry
Commission forecasts, valuations are expected to increase in the coming years as timber price and production
continues to grow.
Energy: wood fuel
Energy from fuels created directly from plant matter or waste food are referred to as biofuels and are part of the
renewable energy ecosystem service. Wood makes up a significant part of the market in biofuels in the UK, being
used in domestic fires, modern pellet-burning boilers and even large electricity-generating power stations. In
2018, the generation of electricity from bioenergy, including wood fuel, accounted for 31.6% of renewable
electricity generation.
Since the mid-2000s, there has been an increase in the amount of timber used for wood fuel (Figure 11).
Deliveries of UK-grown softwood and hardwood timber for wood fuels rose from 289 thousand cubic metres
(2.9% of total timber) in 2000 to 3,100 thousand cubic metres (20.9% of total timber) in 2018. One of the reasons
for the increase could be the UK Government’s Renewable Heat Incentive (RHI) , which started in 2014 and
provided a financial incentive for renewable heat generated.
Page 22 of 47Figure 13: With increasing removals and price rises, the value of wood fuel continues to rise
The annual value of the total timber sold as wood fuel, UK, 2000 to 2018
Source: Forestry Commission – Forestry Statistics 2019
The annual value for timber used for biofuels rose significantly between 2000 and 2018, from £3.3 million to £76.4
million (a series high) (Figure 13). Using projected timber removals over the next 100 years, the asset valuation
of the timber-provisioning service for wood fuel reached £2 billion in 2018.
Bioenergy has been increasing steadily since 2011. New wood-burning power plants are opening to supply
increased demand, the largest being Lynemouth Power Station, a former coal-powered station that was
converted to a wood-burning power plant in 2018. As biofuels are transportable, there is a significant proportion of
wood pellets being imported, as the demand for wood fuel far exceeds supply in the UK. For example, Drax,
which has four biomass power plants in the UK, reported using 7,171,074 tonnes of biomass pellet feedstock in
2018 with only 1% (47,740 tonnes) being sourced from the UK. Of their wood fuel, 99% is imported with 62%
comes from the USA.
Food
Trees can both produce food directly (such as apples) and form an active part of farms in practices known as
agroforestry, in which trees can be combined with livestock, crops or mixed farming. Supporters of this approach
state that this land management approach has benefits that include increasing wildlife, enhancing soil health,
improving animal welfare and contributing to climate change mitigation through sequestering of carbon. In the UK,
this includes hedgerows and buffer strips, silvoarable cropping where alleys of trees are grown on arable land,
and silvopasture where there is a mix of trees and livestock (the trees provide shade and shelter for the grazing
livestock).
Page 23 of 47The Department for Environment, Food and Rural Affairs (Defra) estimates there are 551,700 hectares of
agroforestry in the UK, based on a very broad definition. Livestock agroforestry is the largest area of agroforestry,
at 547,600 hectares, where there is a mix of trees and livestock (Table 9). Included in the Defra estimate for
livestock agroforestry are 50,700 hectares of shrubland with sparse tree cover and 239,300 hectares of grassland
with sparse tree cover. Full methodology can be found in the AGFORWARD report.
Table 9: The vast majority of existing uptake in the UK is agroforestry associated with livestock
Estimated area of agroforestry, in thousands of hectares, UK, 2016
Type agroforestry Area thousand hectares % land area
Arable 2.0 0.0
Livestock 547.6 3.3
High value tree 14.2 0.1
Total 551.7 3.3
Source: Department for Environment, Food and Rural Affairs – Agroforestry Review
One proxy used by the Committee on Climate Change (CCC) on areas of agroforestry is the use of hedges and
trees for buffer strips. Around 1% of agricultural land is estimated to be hedgerows in the UK.
How we include food from agroforestry in these accounts will require some thought and methodological
development. For example, we note that The Agroforestry Handbook includes potential net revenue gains for
swapping conventional farming to selected agroforestry schemes. We need to consider whether the full food
production from agroforestry is appropriate or merely the potential uplift from the regulating service provided by
trees.
Woodlands also contain wild foods such as mushrooms, fruit and foliage that are harvested on a non-commercial
and commercial basis. Research in Scotland found that around 200 different non-timber forest products are
sourced from woodlands, with 110 being edible. Other products included those for craft and medicinal use. The
wild food is mainly being used by the gatherers for their households. Owing to the free nature of these foraging
products, it is difficult to assess their value. However, there is a small number of gatherers who make an income
from this activity.
Game from hunting provides both food and recreation. Scottish research suggests approximately a quarter of red
deer live in woodland. According to a Public and Corporate Economic Consultants (PACEC) 2014 survey , out of
1.8 million hectares of land managed for shooting purposes, 500,000 hectares are woodland. From 1,110 sites
sampled in 2012 to 2013, on average the typical area of a hunting site that is woodland is 22%. The survey
suggested 184,000 deer were shot in 2012 to 2013 in the UK across all habitats, including woodland. The
PACEC survey suggests on average 97% of all game shot was destined for the food chain, from a sample of
1,050 providers. The PACEC report states that there is a small amount of income from the venison market but
that this will rarely be enough to cover the costs of hunting. Forestry England also state that because of the
variation in the price of venison, the costs of wildlife management exceed any income received in some years.
For this reason, we are not actively developing game as a monetary account but will continue to look for overall
production data.
Christmas trees
It is estimated that there are approximately 320 Christmas tree suppliers in the UK, selling around 7 million trees
annually according to the British Christmas Tree Growers Association (BCTGA) . The BCTGA has also stated that
the Christmas tree market was worth £7 million as of 1980, but there are no current data on the value of the
market as at 2019. We found no verifiable data on the number of Christmas trees grown in the UK.
Page 24 of 476 . Regulating ecosystem services: quantity and value
This section discusses the benefits provided by the regulation of natural processes, including air quality
regulation, climate regulation, and natural hazard regulation such as flood mitigation.
Carbon sequestration
The amount of carbon sequestrated by UK woodland was greater between 1998 to 2010 but fell in 2012 and has
not recovered to 2011 levels (Figure 14). According to the UK Greenhouse Gas Inventory annual report , the
variation in the net sink is caused by afforestation in earlier decades and the effect on the age structure of the
present forest area, particularly conifer plantations. There were high levels of conifer afforestation between 1950
and 1990, but these forests are now reaching harvesting age; this means the older trees are replaced by younger
trees, which have a much lower rate of carbon absorption.
Figure 14: Harvesting of forests lead to lower levels of carbon sequestrated by UK woodland in the last
decade relative to 2000 to 2009
Carbon sequestration by woodland, UK, 1998 to 2017
Source: National Atmospheric Emissions Inventory
Despite carbon sequestration reducing over the time series, the annual value of the service has generally
increased year-on-year between 1998 and 2017, reaching a high of £1.2 billion in 2017 (Figure 15).
Page 25 of 47Figure 15: The annual value of carbon sequestration by woodland in the UK reached a peak of £1.2 billion
in 2017
Annual value of carbon sequestered by woodlands, UK, 1998 to 2017
Source: Office for National Statistics – Woodland natural capital accounts; National Atmospheric Emissions Inventory
This is because of increases in the non-traded carbon prices, which are estimated to keep increasing until 2080.
Consequently, the asset value of carbon sequestration by UK woodland was estimated to increase year on year,
reaching £54.6 billion in 2017.
Page 26 of 47Figure 16: From the top 17 local authorities that sequestrated 1.5 tonnes CO2 per hectare or greater in
2017, 13 of them were in England
Ratio of the forest carbon sink to the local authority area, UK, 2017
Source: National Atmospheric Emissions Inventory – prepared by the Centre for Ecology and Hydrology for the Department for Business,
Energy and Industrial Strategy
Page 27 of 47We can also look at which local authorities in the UK provide the greatest amount of carbon sequestration from
woodland per hectare (Figure 16). From the top 17 local authorities that sequestrated 1.5 tonnes CO2 per
hectare or greater in 2017, 4 of them were in Scotland and 13 of them were in England. The ratio of woodland
sequestration to the local authority area in 2017 was highest in South Ayrshire in Scotland (2.57 tonnes of CO2
equivalent by hectare), this equated to a value of £170 per hectare in 2017.
Page 28 of 47Figure 17: South Ayrshire benefitted the most from carbon removal during 2017 (based on the amount of
carbon removed per hectare of local authority)
Socio-economic benefit from woodland carbon sequestration per unit area of local authorities (£ per hectare), UK, 2017
Source: National Atmospheric Emissions Inventory – prepared by the Centre for Ecology and Hydrology for the Department for Business,
Energy and Industrial Strategy
Page 29 of 47To show the importance of woodland, we can look at the amount of carbon that is released into the atmosphere
from forest land being converted into different land types such as cropland, grassland and settlements. From the
UK Greenhouse Gas Inventory , we can see that owing to woodland being converted into cropland, grassland and
settlement, 1.4 million tonnes of carbon dioxide were emitted into the atmosphere in 2017 equating to a negative
externality (cost) of £94.1 million.
Air pollution removal
In 2017, the removal of pollution by woodland in the UK equated to a saving of £938 million in health costs.
The World Health Organization (WHO) estimated that air pollution contributed to 7.6% of all deaths in 2016
worldwide. Vegetation can play a useful role in lessening this danger by removing air pollution. Polluting gases
are absorbed by leaves’ stomata, and particulate matter, suspended in polluted air, settles onto leaves.
This physical flow account estimates the quantity of pollutants removed from the atmosphere by woodland. An
annual time series from 2007 to 2017 is available in the Data section .
In 2017, woodland in the UK removed 268.7 thousand tonnes of PM 10, SO2, NO, NH 3 and O3 (excludes PM2.5
as a subset of PM 10) (Figure 18). Ground-level ozone (O 3) represented the majority of total pollution removal by
mass (79%) in 2017, with PM 10 the second largest.
Figure 18: Ground level ozone represents the majority of pollutants removed by woodland
Pollution removal, UK, 2017
Source: Office for National Statistics – Woodland natural capital accounts; Centre for Ecology and Hydrology
Page 30 of 47It is estimated that in 2017, the avoided health costs in the form of avoided deaths, avoided life years lost, fewer
respiratory hospital admissions and fewer cardiovascular hospital admissions from the removal of harmful
pollutants amounted to a substantial £938 million (Figure 19). Although the removal of PM 2.5 represents only 7%
of the total mass of pollutants removed, the majority (97%) of the avoided health impacts are because of the
reductions in PM2.5 concentrations.
This is because PM 2.5 (fine particulate matter with a diameter of less than 2.5 micrometres, or 3% of the diameter
of a human hair) is the most harmful pollutant by mass. PM 2.5 can bypass the nose and throat to penetrate deep
into the lungs, leading to potentially serious health effects and healthcare costs.
Figure 19: The removal of PM2.5 by woodland in the UK made up 97% of total avoided health costs in
2017 owing to air pollutant removal
Avoided health costs from the removal of pollutants, UK, 2017
Source: Office for National Statistics – Woodland natural capital accounts; Centre for Ecology and Hydrology
The present long-term asset value of woodlands calculated over a 100-year period with income uplift and
population growth was £31.7 billion in 2017 (2018 price base).
Flood mitigation
Forests are known to reduce flood flows, according to a systemic review done by the UK Centre for Ecology and
Hydrology, which looked at 71 studies. There is broad support for the conclusion that increased tree cover in
catchments results in decreasing flood peaks, while decreased tree cover results in increasing flood peaks.
Therefore, woodlands reducing the risk of a flood can be captured as a regulating ecosystem service.
Page 31 of 47To capture the flood regulating service for woodland in Great Britain, Forest Research examined how much it
would cost to have flood water storage (that is, reservoirs) in an area where there was no woodland; they looked
at the substitution costs of having no woodland. For more information on the method, see the methodology report
.
An annual average was estimated at £218.5 million per year for Great Britain: it would cost an estimated £218.5
million per year to create reservoirs able to capture that water if woodland in flood risk catchment (FRC) areas
were replaced with grassland. In this study, 83% of the land area in Great Britain fell within a FRC area. The
country with the largest annual value was England (£139.6 million), owing to the country having more people and
settlements at risk of flooding. Some areas in Scotland were not included in the study as they were not deemed
as FRC areas. The total Great Britain asset valuation of this service over 100 years equated to £6,513 million.
However, there are a number of caveats with this calculation. For all limitations with this research, see the
methodology report.
Temperature regulation
Woodlands can cool urban environments, which benefits the economy by avoiding labour productivity losses and
reducing the use of artificial cooling, such as air conditioning.
Economics for the Environment Consultancy (EFTEC) and others estimated in 2018 the cooling effect provided
by woodlands for 11 city regions across Great Britain in Scoping UK Urban Natural Capital Accounts: Extension
to develop temperature regulation estimates (PDF, 834KB) . The aggregate cooling effect varies between 0.15
and 0.39 degrees Celsius (Figure 20). This variation is because of the amount of woodland relative to the size of
the city region; this is why Scottish regions have the highest cooling effects of all city regions.
Page 32 of 47Figure 20: Edinburgh city region observed the greatest cooling effect owing to the region having the
greatest amount of woodland relative to the size of the urban area
Average annual cooling effect of woodland in each of Great Britain’s city regions, 2014 to 2018
Source: EFTEC and others – Scoping UK Urban Natural Capital Account
The cooling effect is valued through the estimated cost savings from air conditioning and the benefit from
improved labour productivity. The benefit from improved labour productivity makes up most of the value, with
avoided air conditioning energy costs only accounting for a small fraction. For more information on the method,
see the Methodology section of the EFTEC and others 2018 report (PDF, 834KB) .
Page 33 of 47London gains the most as it has the biggest economy and the greatest number of hot days (22.9 days out of a
total of 67.6 hot days in 2018, as seen in Table 10). “Hot days” throughout this section refers to any days equal to
or between 28 degrees Celsius and 35 degrees Celsius.
The £141.2 million increase in value from 2017 to 2018 was caused by a threefold increase in hot days from
2016 (Table 10). The London city region, the largest economy in this study, saw 22.9 hot days in 2018, more than
double the 8.2 hot days experienced in 2016. Also, the Scottish regions of Edinburgh and Glasgow went from
having 0 hot days and therefore no avoided costs in 2017 to having a joint total of 1.5 hot days and £1.3 million in
avoided costs in 2018. While most city regions saw a significant increase in their annual value over the two years,
the North East was the only region to experience fewer hot days.
Table 10: The number of hot days increased significantly in 2018 to 67.6 days over the 11 city regions
Number of hot days in each of the 11 regions of Great Britain, 2016 to 2018
Number of hot days
City region
2016 2017 2018
Cardiff 1.3 3.1 5.0
Edinburgh 0.2 0.0 0.5
Glasgow 0.2 0.0 1.0
Greater Manchester 1.0 0.9 4.3
Liverpool 1.0 2.2 6.2
London 8.2 7.4 22.9
North East 0.4 0.0 0.1
Sheffield 2.4 1.9 5.7
West Midlands 2.8 4.6 10.6
West of England 1.6 4.6 8.5
West Yorkshire 1.1 1.0 2.8
Total 20.2 25.7 67.6
Source: EFTEC and others – Scoping UK Urban Natural Capital Account; Met Office
Page 34 of 47Table 11: The total annual value of cooling from urban woodland in 2018 was valued at £229.2 million
Total annual value of cooling from urban woodland space in each of Great Britain’s city regions (£ thousand,
2018 prices), 2016 to 2018
Avoided costs
City region
2016 2017 2018
Cardiff 1,195 1,812 1,448
Edinburgh 119 - 185
Glasgow 146 - 1,118
Greater Manchester 2,692 636 3,164
Liverpool 1,203 379 1,282
London 84,776 74,681 205,328
North East 108 27 33
Sheffield 1,209 1,122 2,713
West Midlands 4,116 5,140 8,228
West of England 1,607 3,483 2,967
West Yorkshire 1,723 725 2,675
Total 98,894 88,005 229,141
Source: EFTEC and others – Scoping UK Urban Natural Capital Account; Met Office
Notes
1. The value presented here is slightly different to the value presented in the last urban report as we have
adapted the air conditioning numbers to consider the amount of green space relative to London as well as
the area of office space. For a full outline of the method used to calculate cost savings for air conditioning
see Scoping UK Urban Natural Capital Accounts: Extension to develop temperature regulation estimates
(PDF, 834KB). Back to table
The total asset value increased by 54% from £4 billion to £6.1 billion between the 2012 to 2016 and 2014 to 2018
five-year averages (Figure 21). The number of hot days had significantly increased by 47 days.
Page 35 of 47Figure 21: The asset value of the urban cooling effect increased between the 2016 and 2018 averages by
54% owing to a rise in the number of hot days
Total asset value of the environmental assets for each city region in Great Britain over three five-year averages, 2012 to 2018
Source: EFTEC and others – Scoping UK Urban Natural Capital Account; Met Office
We can now examine the potential productivity benefits of converting one percentage point of the urban area into
woodland. An increase in woodland by one percentage point in all city regions (relative to the urban area) could
lead to an estimated saving in labour productivity of at least £12.8 million. These numbers are calculated using
the five-year hot-day average (2014 to 2018). As expected, we have seen an increase of just over £3 million from
the previous five-year hot-day average (2013 to 2017) owing to the progress of climate change.
Page 36 of 47Table 12: A one percentage point rise in woodland relative to the urban area can lead to an overall saving in
labour productivity of at least £12.8 million in 2018
Avoided productivity losses from a 1% rise in woodland by city region in Great Britain based on an average of hot
days between 2013 to 2017 and 2014 to 2018, (£, 2018 prices)
Avoided labour productivity costs
City region
2013 to 2017 2014 to 2018
Cardiff 115,480 126,540
Edinburgh 4,470 4,730
Glasgow 5,180 28,330
Greater Manchester 196,750 249,170
Liverpool 91,850 128,430
London 7,784,330 10,988,470
North East 9,010 7,890
Sheffield 131,430 173,860
West Midlands 589,130 640,630
West of England 261,650 280,500
West Yorkshire 137,190 172,190
Total 9,326,470 12,800,740
Source: Office for National Statistics – Woodland natural capital accounts; EFTEC and others – Scoping UK
Urban Natural Capital Account; and Met Office
Noise reduction
Vegetation acts as a buffer against noise pollution, in particular road traffic noise. Noise pollution causes adverse
health outcomes through lack of sleep and annoyance. EFTEC and others reported in 2018 (PDF, 834KB) initial
estimates of the benefits of noise reduction from vegetation, which just includes woodland. Urban vegetation
includes both large (greater than 3,000 square metres) and smaller (less than 3,000 square metres) woodlands
but does not include very small woodlands (less than 200 square metres).
These estimates are considered minimum values, but further work is needed to develop more refined and robust
estimates. According to the noise action plan in urban areas published by the Department for Environment, Food
and Rural Areas (Defra), 8,022,000 people were in agglomerations where road traffic was greater than 60
decibels. An example of sound that produces 60 decibels or more is normal speech. These are considered
minimum values, but further work is needed to develop more refined estimates.
The total number of buildings in UK urban areas that benefitted from a reduction in noise in 2017 was 167,000.
Page 37 of 47Table 13: 167,000 buildings in the UK benefited from noise reduction owing to woodland
Number of buildings where road noise levels are mitigated by woodlands, decibel, UK, 2017
Number of buildings benefiting from noise mitigation by urban vegetation
Noise band in noise (rounded to the nearest thousand)
metric by decibel Northern
England Scotland Wales UK
Ireland
Greater than or equal - - - - 0
to 80
75.0 to 79.9 1,000 - - - 1,000
70.0 to 74.9 8,000 - 1,000 - 9,000
65.0 to 69.9 36,000 1,000 3,000 1,000 41,000
60.0 to 64.9 98,000 6,000 8,000 4,000 116,000
Total 143,000 7,000 12,000 5,000 167,000
Source: EFTEC and others – Scoping UK Urban Natural Capital Account
Notes
1. 5dBA bands applied along with guidance in Defra’s noise pollution: economic analysis published in 2014.
Back to table
2. The number of dwellings receiving mitigation from woodland in Scotland is likely to be lower than the rest
of the UK because EFTEC and others (2018) used the Lden noise metric, which measures any level of
noise over a 24-hour period, with penalties later at night. However, the LA1018h is used for the rest of the
UK. This is because LA1018H was unavailable for Scotland. Back to table
The total annual value of noise reduction in the UK was £15.3 million in avoided loss of quality adjusted life years
(QALY) during 2017 (Table 14). Valuations based on QALY are economic welfare values, which look into how
noise reduction affects people’s social welfare.
Page 38 of 47Table 14: Noise mitigation provided by small woodlands in the UK led to a saving of £15.3 million in avoided loss
of quality adjusted years associated with adverse health outcomes
Monetary flow accounts for the noise mitigation of urban woodland, £ million (2018 prices), UK, 2017
Annual value of noise mitigation of 1dBA (£ million)
Noise band
England Scotland Wales Northern Ireland UK
Greater than or 1,000 - - - 1,000
equal to 80
75.0 to 79.9 148,000 - 11,000 2,000 161,000
70.0 to 74.9 1,104,000 8,000 106,000 56,000 1,274,000
65.0 to 69.9 4,026,000 124,000 313,000 141,000 4,604,000
60.0 to 64.9 7,778,000 481,000 672,000 324,000 9,255,000
55.0 to 59.9 - - - - 0
50.0 to 54.9 - - - - 0
45.0 to 49.9 - - - - 0
Total 13,057,000 613,000 1,102,000 523,000 15,295,000
Source: EFTEC and others – Scoping UK Urban Natural Capital Account: Extending noise regulation estimates
Notes
1. 5dBA bands applied along with guidance in Defra’s noise pollution: economic analysis published in 2014.
Back to table
The asset value for noise reduction based on estimated future benefits over 100 years was worth £833 million
(Table 15). A number of assumptions are also made when estimating the future flow of the noise mitigation value
by urban vegetation and woodland. For more information on these, see Scoping UK Urban Natural Capital
Account – Noise extension (PDF, 2.37MB) .
Table 15: The asset value for noise regulation in England provided by urban woodland had an estimated worth of
£710 million in 2017
Asset value of ecosystem service from noise mitigation, £ million (2018 prices), UK, 2017
Annual value of noise mitigation of 1dBA (£million/year)
Noise band
England Scotland Wales Northern Ireland UK
Greater than or - - - - 0
equal to 80
75.0 to 79.9 8 - 1 - 9
70.0 to 74.9 60 - 6 3 69
65.0 to 69.9 219 7 17 8 251
60.0 to 64.9 423 26 37 18 504
Total 710 33 61 29 833
Source: EFTEC
Page 39 of 477 . Cultural ecosystem services: quantity and value
Cultural ecosystem services provide non-material benefits like enjoyment of the landscape, recreation in
woodlands, education and cultural heritage.
Recreation
In 2017, there were an estimated 475.2 million visits to and 718 million hours spent in UK woodlands. This
service was valued at £515.5 million. Recreational visits in nature are valued based on expenditure per trip (that
is, fuel, public transport costs, admission costs and parking fees). For more information on how we calculate the
annual value, see Woodland natural capital accounts methodology guide, UK: 2020 . Visits and time spent in
woodland areas have generally gradually increased over the time series, with an especially steep increase in the
average time spent in woodland habitat from 2015 to 2017 (Figure 22).
Figure 22: Visits to UK woodlands have increased by 39% since 2009
Number of visits and hours spent in woodlands, UK, 2009 to 2017
Source: Monitor of Engagement with the Natural Environment Survey, The Welsh Outdoor Recreation Survey, and Scotland’s
People and Nature Survey
Page 40 of 47You can also read