The Core Proteome of Biofilm-Grown Clinical Pseudomonas aeruginosa Isolates - MDPI
←
→
Page content transcription
If your browser does not render page correctly, please read the page content below
cells
Article
The Core Proteome of Biofilm-Grown Clinical
Pseudomonas aeruginosa Isolates
Jelena Erdmann 1,2 , Janne G. Thöming 1 , Sarah Pohl 1,3 , Andreas Pich 2 , Christof Lenz 4,5,†
and Susanne Häussler 1,3, *,†
 1    Institute for Molecular Bacteriology, TWINCORE GmbH, Centre for Experimental and Clinical Infection
      Research, a joint venture of the Hannover Medical School and the Helmholtz Centre for Infection Research,
      Hannover 30625, Germany
 2    Research Core Unit Proteomics and Institute of Toxicology, Hannover Medical School, Hannover 30625,
      Germany
 3    Department of Molecular Bacteriology, Helmholtz Center for Infection Research,
      Braunschweig 38124, Germany
 4    Institute of Clinical Chemistry, Bioanalytics, University Medical Center Göttingen, Göttingen 37075,
      Germany
 5    Max Planck Institute for Biophysical Chemistry, Bioanalytical Mass Spectrometry, Göttingen 37077, Germany
 *    Correspondence: susanne.haeussler@helmholtz-hzi.de; Tel.: +45-3545-7784
 †    These authors contributed equally to this work.

 Received: 26 August 2019; Accepted: 19 September 2019; Published: 23 September 2019

 Abstract: Comparative genomics has greatly facilitated the identification of shared as well as unique
 features among individual cells or tissues, and thus offers the potential to find disease markers.
 While proteomics is recognized for its potential to generate quantitative maps of protein expression,
 comparative proteomics in bacteria has been largely restricted to the comparison of single cell lines or
 mutant strains. In this study, we used a data independent acquisition (DIA) technique, which enables
 global protein quantification of large sample cohorts, to record the proteome profiles of overall 27
 whole genome sequenced and transcriptionally profiled clinical isolates of the opportunistic pathogen
 Pseudomonas aeruginosa. Analysis of the proteome profiles across the 27 clinical isolates grown under
 planktonic and biofilm growth conditions led to the identification of a core biofilm-associated protein
 profile. Furthermore, we found that protein-to-mRNA ratios between different P. aeruginosa strains
 are well correlated, indicating conserved patterns of post-transcriptional regulation. Uncovering core
 regulatory pathways, which drive biofilm formation and associated antibiotic tolerance in bacterial
 pathogens, promise to give clues to interactions between bacterial species and their environment and
 could provide useful targets for new clinical interventions to combat biofilm-associated infections.

 Keywords: bacteria; DIA; mass spectrometry; microbiology; SWATH

1. Introduction
     Bacteria either grow as free-swimming planktonic cells, or organized into biofilms [1,2]. Microbial
biofilm communities are embedded in a thick, self-produced extracellular matrix and proliferate
attached to abiotic or biotic surfaces [3–5]. Their formation represents a universal bacterial survival
strategy, where the encapsulated bacteria are protected against a diverse array of environmental
stressors [6,7]. Biofilms occur in natural environments, but there are also biofilm-associated infections
of the eukaryotic host, which are notoriously difficult to treat [8–10]. These include infections of the
lower respiratory tract in cystic fibrosis patients and those resulting from biofilm growth on implanted
medical devices [11,12]. In biofilm-associated infections, bacteria show increased resistance against
antimicrobial therapy and the attacks of the host immune system [13,14]. There are several studies that

Cells 2019, 8, 1129; doi:10.3390/cells8101129                                        www.mdpi.com/journal/cells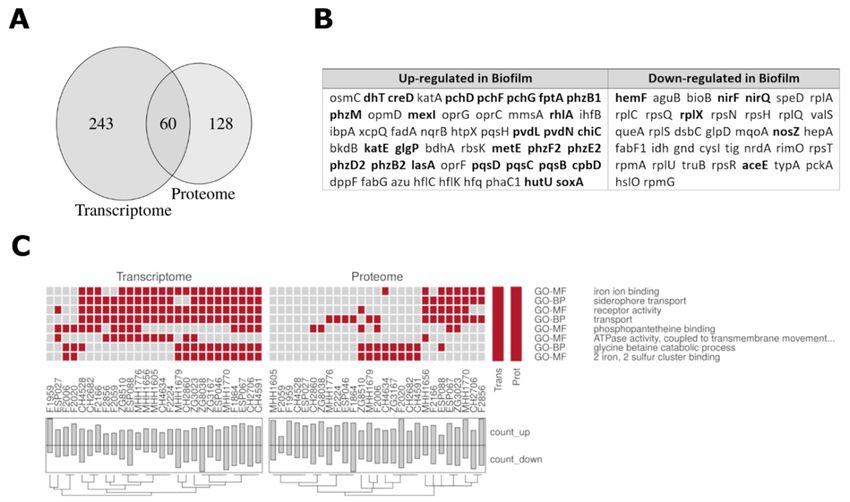
Cells 2019, 8, 1129                                                                                2 of 18

analyzed the proteome of biofilm-grown P. aeruginosa [15–17]. However, although it is recognized that
bacteria present in biofilms behave differently from their planktonic counterparts [18,19], there is only
a limited amount of studies that compare protein expression or mRNA abundance in planktonic and
biofilm bacteria across multiple bacterial strains of the same species [20–22]. Similar to comparative
genomics, comparative proteomics of multiple strains could uncover shared as well as unique features
among the strains [23–26]. The identification of a common biofilm specific protein expression profile
might reveal new insights into core regulatory pathways and adaptation strategies of bacterial biofilm
growth on the species level. Furthermore, the detection of common responses of bacterial strains to a
growth environment that drives tolerance towards environmental stressors might serve as a basis for
the development of novel treatment strategies aiming at combating biofilm-associated infections [26].
      In this study, we describe the proteome of 27 clinical isolates of the opportunistic human pathogen
Pseudomonas aeruginosa. Protein expression profiles were recorded from the isolates cultured under
planktonic as well as biofilm growth conditions using Sequential Window Acquisition of all Theoretical
fragment ion spectra mass spectrometry (SWATH-MS) [27]. SWATH-MS has emerged as a key data
independent acquisition (DIA) technique that enables global protein quantification of large sample
cohorts. It outperforms standard shotgun approaches using data dependent acquisition (DDA) in
terms of detectable peptides and associated proteins as well as measurement reproducibility [28,29].
We used SWATH-MS to quantify proteins in 108 samples (27 strains, two conditions, two biological
replicates) which were analyzed in two technical replicates. Analysis of the resulting isolate- and
lifestyle-dependent P. aeruginosa proteome profiles clearly differentiated the biofilm and planktonic
physiological states. Furthermore, we defined a common core proteome under biofilm conditions
despite significant fluctuations in the abundance of some proteins across the clinical isolates. This
variance was independent of the genetic background of the individual clinical isolates, and independent
of the planktonic proteome profile. Our study furthermore confirms previous observations that the
protein-to-mRNA ratios between different P. aeruginosa strains are well correlated [30]. This suggests
that the mechanisms regulating protein abundances downstream of transcription are conserved in the
species P. aeruginosa.

2. Materials and Methods

2.1. Bacterial Strains and Growth Conditions
      27 Pseudomonas aeruginosa strains from different European origins and infection sites were cultured
like described before [31]. In brief, precultures were grown with shaking (180 rpm) at 37 ◦ C in 4 mL
lysogeny broth (LB) medium. For planktonic condition main cultures of 10 mL LB were started from
one preculture at optical density (OD)600 = 0.02 and stopped at OD600 = 2. For biofilm condition
samples from the same precultures as planktonic samples were inoculated to 100 µL LB in 30 wells
of a sterile half-area, 96-well µClear microtiter plate (Greiner Bio-One, Kremsmünster, Austria). The
microtiter plate was sealed with an air-permeable BREATHseal cover foil (Greiner Bio-One). After
48 h growth at 37 ◦ C in humidified atmosphere biofilm-growth was documented by fluorescence
microscopy (data not shown) and wells of the same sample were pooled. Samples were washed three
times with ice-cold phosphate buffered saline (PBS) followed each time by centrifugation and removal
of the supernatant. All samples were taken in biological duplicates.

2.2. Sample Preparation and Proteome Analysis
     Washed pellets were lysed in 800 µL lysis-buffer and sonicated as described previously [32]. After
sonication cell debris was removed by centrifugation and proteins in the supernatant were precipitated
bytrichloracetic acid(TCA)/Acetone as proposed elsewhere ([33], Protocol 5). In brief, proteins were
reduced by dithiothreitol (DTT) and precipitated by TCA. The pellet was redissolvedin ice-cold acetone,
spun down and acetone precipitation was repeated. The resulting pellet was dried and redissolved in
25 mM ammonium bicarbonate/0.1 M RapiGest (Waters, Milford, MA, USA)-solution. Afterwards,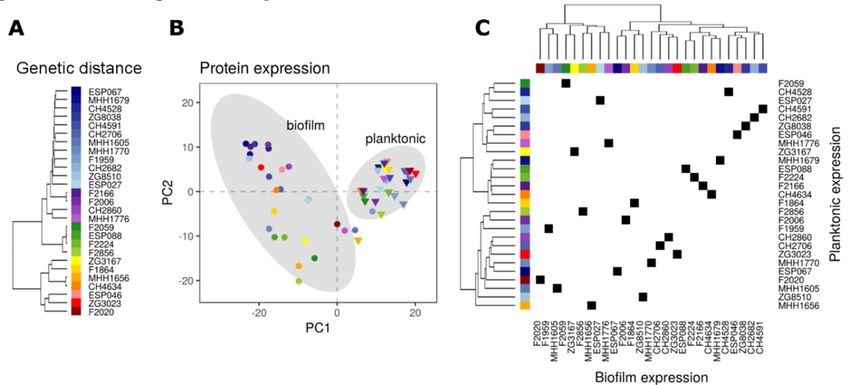
Cells 2019, 8, 1129                                                                                3 of 18

protein concentration was measured by DC-ProteinAssay (Bio-Rad, Hercules, CA, USA) and 50 µg
protein was used for in-solution digest. After reduction by DTT followed by alkylation (IAA), proteins
were digested by trypsin. Digestion reaction was stopped by adding TFA. After centrifugation and
rejection of the pellet, peptides in the supernatant were dried by vacuum centrifugation.
      For generation of a peptide library, equal amount aliquots from each sample were pooled to a
total amount of 80 µg, and separated into eight fractions using a reversed phase spin column [34]
(Pierce High pH Reversed-Phase Peptide Fractionation Kit, Thermo Fisher Scientific, Waltham, MA,
USA.). Protein digests were analyzed on a nanoflow chromatography system (Eksigent nanoLC425)
hyphenated to a hybrid triple quadrupole-TOF mass spectrometer (TripleTOF 5600+) equipped with a
Nanospray III ion source (Ionspray Voltage 2400 V, Interface Heater Temperature 150 ◦ C, Sheath Gas
Setting 12) and controlled by Analyst TF 1.7.1 software build 1,163 (all AB Sciex). In brief, peptides
were dissolved in loading buffer (2% acetonitrile, 0.1% formic acid in water) to a concentration of
0.3 µg/µL. For each analysis, 1.5 µg of digested protein were enriched on a precolumn (0.18 mm ID ×
20 mm, Symmetry C18, 5 µm, Waters) and separated on an analytical RP-C18 column (0.075 mm ID ×
250 mm, HSS T3, 1.8 µm, Waters) using a 90 min linear gradient of 5–35% acetonitrile/0.1% formic acid
(v:v) at 300 nl min−1 .
      Qualitative liquid chromatography – tandem mass spectrometry (LC-MS/MS) analysis was
performed using a Top30 data-dependent acquisition method with an MS survey scan of m/z 350–1250
accumulated for 350 ms at a resolution of 30000 full width at half maximum (FWHM). MS/MS scans of
m/z 180–1600 were accumulated for 100 ms at a resolution of 17500 FWHM and a precursor isolation
width of 0.7 FWHM, resulting in a total cycle time of 2.9 s. Precursors above a threshold MS intensity
of 125 cps with charge states 2+, 3+, and 4+ were selected for MS/MS, the dynamic exclusion time was
set to 30 s. MS/MS activation was achieved by collision induced dissociation (CID), using nitrogen as a
collision gas and the manufacturer’s default rolling collision energy settings. Four technical replicates
per reversed phase fraction were analyzed to construct a spectral library.
      For quantitative SWATH analysis, MS/MS data were acquired using 65 variable size windows [35]
across the 400–1050 m/z range. Fragments were produced using rolling collision energy settings for
charge state 2+, and fragments acquired over an m/z range of 350–1400 for 40 ms per segment. Including
a 100ms survey scan this resulted in an overall cycle time of 2.75 s. Two replicate injections were
acquired for each biological sample.

2.3. Data Processing
     Protein identification was achieved using ProteinPilot Software version 5.0 build 4769 (AB Sciex)
at “thorough” settings. Spectra from the combined qualitative analyses were searched against the
Pseudomonas genome database [36] protein annotations of Pseudomonas aeruginosa strain UCBPP-PA14
(5892 entries, May 2019) augmented with a set of 52 known common laboratory contaminants to
identify 2275 proteins at a False Discovery Rate (FDR) of 1%.
     Spectral library generation and SWATH peak extraction were achieved in PeakView Software
version 2.1 build 11041 (AB Sciex) using the SWATH quantitation microApp version 2.0 build 2003.
The list of identified proteins was truncated to 1% FDR, and the corresponding Peptide-to-Sequence
Matches (PSMs) were imported. Peptide sequences shared between different confidently identified
proteins were omitted. Following initial ion chromatogram extraction, retention times were calibrated
using endogenous high confidence peptides and linear regression. Finally, peak areas for up to the
top10 peptides per protein (by identification confidence) were integrated using the top6 transitions per
peptide (by signal intensity) at an FDR of 1% [37] using a mass window of 75 ppm and a retention
time window of 14 min around the expected values.These peptides were filtered for those that are
present in the proteome sequences of all analyzed strains, their areas normalized by total area sums
and finally summed to protein area values of 1806 proteins. Proteome sequences were generated
from consensus genome sequences produced with the mpileup option of the SAMtoolspackage [38]
after DNA sequencing of the samples as described in [39]. Protein coding sequences were extracted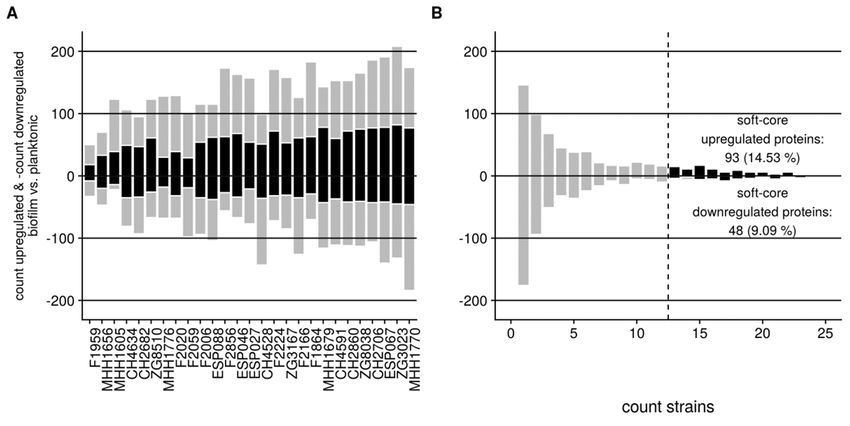
Cells 2019, 8, 1129                                                                                   4 of 18

based on the reference annotation, and ambiguous nucleotides (“N”) were replaced with reference
nucleotides to be able to obtain proteome sequences. This, as well as the translation of these DNA
sequences, was done using Biopython’sBio.SeqIO module [40]. In an additional filtering step, those
proteins were excluded from the analyses that differed significantly (student’s t-test, p-value < 0.5, log2
fold-change ≤−0.5 or ≥0.5) between two batches measured 5 month apart. Processed proteome data is
available in Supplementary Table S1.
     The mass spectrometry proteomics data have been deposited to the ProteomeXchange Consortium
via the PRIDE [41] partner repository with the dataset identifier PXD015073.
     mRNAs were measured as described elsewhere [39,42] (planktonic samples) or as part of another
project [Thöming et al., to be published] (biofilm samples) but with the same protocol. Sequences were
then mapped to the P. aeruginosa PA14 genome using stampy [43] with default settings. Resulting read
counts per gene (RPG) were normalized by DESeq [44] in R [45] as described elsewhere [46]. Processed
transcriptome data is available in Supplementary Table S2.
     All enrichment analyses were conducted with the R-package bc3net [47] and a p-value < 0.05 as
cutoff for significant enriched functions.
     Transcriptome data is available at NCBI’s Gene Expression Omnibus: GSE134231 (biofilm
transcriptomes), GSE123544 (planktonic transcriptomes).
     Proteins were considered to be differentially regulated, if the log2 mean ratio of all replicates was
≤ −1 or ≥ 1 (two-fold change) and the students’ t-test p-value was ≤ 0.05. Differential expression of all
quantified proteins is listed in Supplementary Table S3.

3. Results

3.1. SWATH-MS Characterizes Protein Expression Profiles in Multiple P. aeruginosaIsolates
     For SWATH analysis, a spectral library was generated from a pool of 36 samples. Eighteen of the
analyzed clinical P. aeruginosa isolates were grown under biofilm and planktonic growth conditions.
Following protein extraction and tryptic digestion, aliquots were pooled and the resulting peptides
separated into eightfractions by means of reversed phase separation at basic pH. Fractions were
analyzed in triplicate by data dependent acquisition mass spectrometry, and the combined spectra
were searched against the P. aeruginosa reference strain UCBPP-PA14 proteome (containing 5893 protein
sequences). This lead to the identification of 2275 proteins at a 1% False Discovery Rate, which was
slightly more than what was found in a comparable study [48]. The resulting spectral library was
used to detect peptides in 108 different samples (27 strains, two conditions, two biological replicates)
analyzed in duplicate by SWATH-MS. This enabled quantification of 6232 peptides corresponding to
1996 proteins. To ensure reliable quantification across all isolates, the resulting peptide list was filtered
to those present in all strains analyzed. Protein sequences of the clinical isolates were generated by
mapping sequenced genomes against the P. aeruginosa PA14 genome and translating the resulting
protein coding sequences. 5165 peptides (82.9%), representing 1806 proteins, were present in all strains
analyzed. Further thorough filtering for batch effects resulted in a high-quality quantitation matrix of
1021 proteins consistently quantified across all isolates under both conditions. Sample preparation,
acquisition strategy, instruments, and parameters were similar to Losensky et al. [49].

3.2. Proteome Expression Patterns Differ Between Physiological States
     From our collection of 414 well characterized clinical P. aeruginosa isolates [42,50] we selected 27,
which represented the broad genetic distribution of the clinical strains (Figure 1A). These 27 isolates
were cultured under planktonic conditions (until OD600 of 2) as well as under biofilm conditions for 48 h.
Their protein expression profiles were recorded in two biological and two technical (MS measurement)
replicates. We were able to consistently quantify 1021 proteins across all strains and conditions.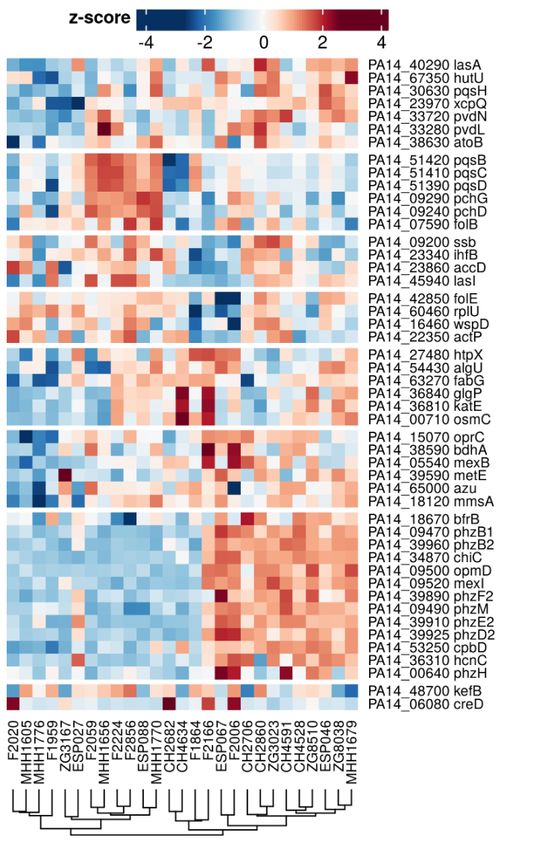
Furthermore, there was no correlation between phylogenetic relatedness and the production of
specific proteomic profiles, indicating that strains from any genetic background can produce distinct
environment-driven proteome profiles. In conclusion, the 27 clinical isolates produced a higher
proteome diversity when cultivated under biofilm conditions and this divergent protein profile was
Cells 2019, 8, 1129
independent on the genetic background of the isolates and was not linked to the protein profile5 that
of 18
was produced under planktonic growth conditions.
Figure
Figure 1.1. Protein
Protein expression
expression profiles
profiles ofof biofilm
biofilm and
and planktonically
planktonically grown
grown clinical
clinical P.
P. aeruginosa isolates
of diverse genetic background. (A) (A) Hierarchical
Hierarchical clustering by genetic distance based on the 1021 1021 genes
genes
for which the encoded proteins were quantified in this study.
proteins were quantified in this study. PAO1-likePAO1-like strains predominate and are
colored in blue-, violet-,
violet-, and
and green
green colors,
colors, respectively.
respectively. PA14-like
PA14-like strains are colored in yellow/orange
yellow/orange
or red. (B)
(B) Principal
Principal component
component analysis
analysis (PCA)
(PCA) of of the
the isolates
isolates based
based onon the
the acquired
acquired proteomic
proteomic data.
data.
Biofilm (circles) and planktonic (triangles) proteomes of the clinical isolates (same (same color
color code
code as
as in
in A)
A)
are clearly
clearlyseparated.
separated.The The grey
grey areas
areas represent
represent the 95% theconfidence
95% confidence
ellipse ofellipse of the
the biofilm andbiofilm and
planktonic
planktonic
proteomes,proteomes,
respectively.respectively. (C) Correlation
(C) Correlation matrix comparingmatrix comparing
the biofilmthe andbiofilm and the planktonic
the planktonic proteomic
proteomic
profiles of profiles of the
the clinical clinicalEach
isolates. isolates. Each
square squarethe
reflects reflects the of
position position of an individual
an individual isolate onisolate
the twoon
the
axes.twoTheaxes. The horizontal
horizontal dimension dimension
representsrepresents the hierarchical
the hierarchical clustering clustering of protein expression
of protein expression data based
data based on normalized
on normalized expression of expression of the 1021
the 1021 proteins proteins
in the data setinofthe data set
clinical of clinical
isolates grownisolates grown
under biofilm
conditions,
under while
biofilm the vertical
conditions, dimension
while corresponds
the vertical dimension to hierarchical
corresponds clustering of planktonic
to hierarchical protein
clustering of
expression data.
planktonic Theexpression
protein phylogenetic strain
data. Thebackground
phylogenetic is indicated by colored subtrees
strain background (colorbycode
is indicated as in
colored
A) within(color
subtrees the dendrogram.
code as in A) within the dendrogram.
Biofilm
We nextand planktonic
identified allproteomes couldwere
proteins that be clearly separatedexpressed
differentially by principal component
under biofilmanalysis
versus
(PCA) (Figure 1B), indicating that there were profound differences in protein abundances
planktonic growth conditions in each of the 27 clinical isolates (Figure2A). Overall, 941 (92% of those under these
conditions, which
quantified) proteinswere
were shared by the isolates.
differentially Although
expressed at significant levelsP.inaeruginosaisolates
the 27 clinical originated
at least one of the clinical
from diverse
isolates genetic backgrounds,
(Supplementary theynumber
Table S3). The presented very similar proteomic
of differentially expressed profiles
proteinsunder
betweenplanktonic
the two
conditions.ranged
conditions In contrast,
fromthe 83 biofilm proteome
to 358 per isolate profiles wereThe
(Figure2A). much more
great divergent
majority betweenwere
of proteins the strains.
found
Webe
to also found that regulated
differentially two isolates that clustered
in only more
1 to 6 of the closely isolates
27 clinical under planktonic
(Figure 2B).growth conditions did
not necessarily cluster
141 of the 941 to thewere
proteins samedifferentially
extent, if grown in biofilms
regulated and vice versa48(Figure
(93 up-regulated, 1C). Furthermore,
down-regulated) under
there was no correlation between phylogenetic relatedness and the production
biofilm growth conditions in at least 50% of the isolates and were defined as ‘soft-core of specific proteomic
biofilm
profiles, indicating
proteins’ that strains
(Supplementary from S3).
Table any genetic background
The relative can produce
percentage distinct
of these environment-driven
proteins among the
proteome profiles. In conclusion, the 27 clinical isolates produced a higher proteome
differentially expressed proteins in biofilm versus planktonic growth had a median in the individual diversity when
cultivated under biofilm conditions and this divergent protein profile was independent on the genetic
background of the isolates and was not linked to the protein profile that was produced under planktonic
growth conditions.
We next identified all proteins that were differentially expressed under biofilm versus planktonic
growth conditions in each of the 27 clinical isolates (Figure 2A). Overall, 941 (92% of those quantified)
proteins were differentially expressed at significant levels in at least one of the clinical isolates
(Supplementary Table S3). The number of differentially expressed proteins between the two conditions
ranged from 83 to 358 per isolate (Figure 2A). The great majority of proteins were found to be
differentially regulated in only 1 to 6 of the 27 clinical isolates (Figure 2B).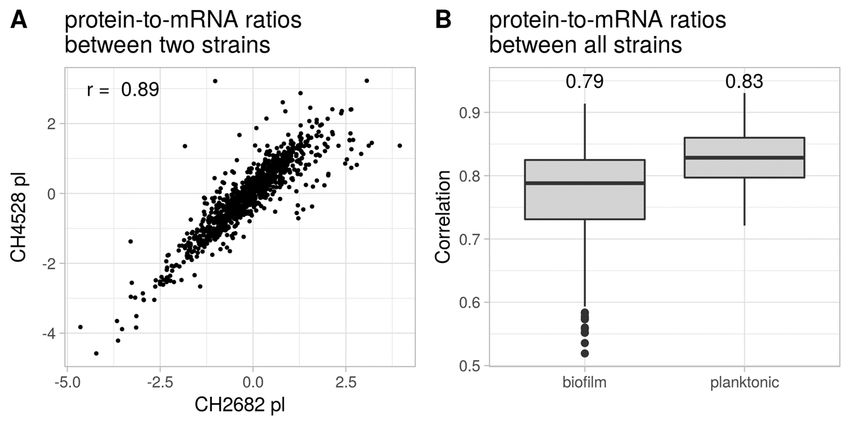
Although environmental conditions were different from our study, we found an overlap with
48 h-biofilm-specific proteins in PAO1 published by Park et al. [15]. Out of the nine proteins that were
also quantified in our study, eight were significantly up-regulated in biofilm compared to planktonic
conditions. The five proteins that are also in our soft-core biofilm proteins because they had a more
than two-fold difference in protein expression are:PdhB (PA14_19910), PA14_13140, the probable
Cells 2019, 8, 1129                                                                                6 of 18
nonribosomal peptide synthetase PA14_11140, PA14_71240 and two-component response regulator
PA14_30830.

     Figure
     Figure 2.   Differential protein
              2. Differential  protein expression
                                         expression between
                                                      between biofilm
                                                                 biofilm andand planktonic
                                                                                 planktonic growth
                                                                                                growth conditions
                                                                                                           conditions across
                                                                                                                         across 27
                                                                                                                                 27
     clinical
     clinical isolates.
               isolates. (A)
                          (A) Number
                              Numberof   ofproteins,
                                            proteins,which
                                                       whichare areup-
                                                                     up-and
                                                                          anddown-regulated
                                                                                down-regulated     in in
                                                                                                       biofilm  as as
                                                                                                          biofilm   compared
                                                                                                                       compared  to
     planktonic    growth   conditions,   are shown   for  each  strain.  The  number    of   proteins   that
     to planktonic growth conditions, are shown for each strain. The number of proteins that belong to the     belong   to  the set
     of
     setsoft-core   biofilm
          of soft-core       proteins
                         biofilm       are colored
                                  proteins           black. black.
                                              are colored     Soft-core  biofilmbiofilm
                                                                      Soft-core   proteinsproteins
                                                                                               are defined
                                                                                                         are as  those proteins,
                                                                                                              defined     as those
     which   exhibit   an  average expression    level difference    in all clinical biofilm    grown
     proteins, which exhibit an average expression level difference in all clinical biofilm grown        isolates  as compared
                                                                                                                       isolates as
     to planktonic
     compared         cultures andcultures
                  to planktonic      are foundanddifferentially  expressed inexpressed
                                                  are found differentially       at least 50% in of
                                                                                                 at the
                                                                                                     leastisolates.
                                                                                                            50% of (B)
                                                                                                                     theNumber
                                                                                                                          isolates.
     of                                    found   differentially   expressed    in 1,2,3 . . .
     (B) Number of proteins that are commonly found differentially expressed in 1,2,3…27 isolates.was
        proteins   that  are commonly                                                           27  isolates.  No   protein     No
     found
     proteintowasbe regulated
                     found to inbeallregulated
                                       of the analyzed
                                                 in all of(27)
                                                            thestrains.
                                                                 analyzedThe(27)
                                                                               number   of proteins
                                                                                   strains.   The number that belong    to thethat
                                                                                                               of proteins      set
     of soft-core   biofilm  proteins  are  highlighted    in black.
     belong to the set of soft-core biofilm proteins are highlighted in black.

      141 of the 941 proteins were differentially regulated (93 up-regulated, 48 down-regulated) under
      Further analyses of the soft-core biofilm proteins revealed that despite substantial variability
biofilm growth conditions in at least 50% of the isolates and were defined as ‘soft-core biofilm proteins’
between the strains, we found a general increase in proteins involved in iron sequestration and iron
(Supplementary Table S3). The relative percentage of these proteins among the differentially expressed
metabolic processes (PchDG, FptA), in Pseudomonas quinolone signal (PQS) signaling (PqsBCDH),
proteins in biofilm versus planktonic growth had a median in the individual isolates of 41.7% within
phenazine biosynthesis (PhzB1, PhzB2, PhzE2, PhzF2, PhzM), outer membrane proteins (OprCFG,
the up-regulated, and 36.6% within the down-regulated proteins, respectively (Figure 2A, Figure A1).
MexI), and fatty acid biosynthesis (FabG). On the other hand we found a general down-regulation of
      Although environmental conditions were different from our study, we found an overlap with 48
proteins involved in translation processes in the biofilm-grown isolates (RplACQSX, RpmAG,
h-biofilm-specific proteins in PAO1 published by Park et al. [15]. Out of the nine proteins that were
RpsNRT, TruB3). Figure 3 depicts the enrichment of GO-, KEGG-, or PseudoCAP-annotations within
also quantified in our study, eight were significantly up-regulated in biofilm compared to planktonic
the soft-core biofilm profile. Here, especially the PseudoCAP category “Fatty acid and phospholipid
conditions. The five proteins that are also in our soft-core biofilm proteins because they had a more
metabolism” was enriched in most strains under biofilm conditions. Other functional groups like the
than two-fold difference in protein expression are:PdhB (PA14_19910), PA14_13140, the probable
PseudoCAP category “Adaption, Protection” were enriched in the soft-core biofilm proteins but
nonribosomal peptide synthetase PA14_11140, PA14_71240 and two-component response regulator
reached significance levels in only a few strains under biofilm growth conditions.
PA14_30830.
      Further analyses of the soft-core biofilm proteins revealed that despite substantial variability
between the strains, we found a general increase in proteins involved in iron sequestration and iron
metabolic processes (PchDG, FptA), in Pseudomonas quinolone signal (PQS) signaling (PqsBCDH),
phenazine biosynthesis (PhzB1, PhzB2, PhzE2, PhzF2, PhzM), outer membrane proteins (OprCFG,
MexI), and fatty acid biosynthesis (FabG). On the other hand we found a general down-regulation
of proteins involved in translation processes in the biofilm-grown isolates (RplACQSX, RpmAG,
RpsNRT, TruB3). Figure 3 depicts the enrichment of GO-, KEGG-, or PseudoCAP-annotations within
the soft-core biofilm profile. Here, especially the PseudoCAP category “Fatty acid and phospholipid
metabolism” was enriched in most strains under biofilm conditions. Other functional groups like
the PseudoCAP category “Adaption, Protection” were enriched in the soft-core biofilm proteins but
reached significance levels in only a few strains under biofilm growth conditions.
Cells 2019, 8, 1129 7 of 18
Cells 2019, 8, x 7 of 17
Figure
Figure 3. Enrichment of
3. Enrichment of functional categories in
functional categories in the
the soft-core
soft-core biofilm
biofilm protein
protein profile.All
profile.All functional
functional
categories
categories that
that were
were enriched (p-value <
enriched (p-value 0.05) in
< 0.05) in the
the group
group of of proteins
proteins with
with aa differential
differential expression
expression
under
under biofilm
biofilm as
as compared
compared toto planktonic
planktonic growth
growth conditions
conditions inin at
at least
least 50%
50% of
of the
the clinical
clinical isolates
isolates are
are
listed. Function that were enriched in proteins that were up-regulated under biofilm
listed. Function that were enriched in proteins that were up-regulated under biofilm condition in the condition in the
individual
individual isolates
isolates(x-axes)
(x-axes)are
arecolored
coloredin in
red, functions
red, thatthat
functions were down-regulated
were down-regulatedare inare
blue. Bar plots
in blue. Bar
indicate how many proteins were up and down-regulated in the individual strains.
plots indicate how many proteins were up and down-regulated in the individual strains. Functions Functions were
derived from KEGG-,
were derived PseudoCAP-
from KEGG-, or gene or
PseudoCAP- ontology (GO)-annotations.
gene ontology GO-MF =GO-MF
(GO)-annotations. molecular function,
= molecular
GO-BP = biological process, GO-CC = cellular component.
function, GO-BP = biological process, GO-CC = cellular component.
3.3. Proteome Expression Patterns Differ Between Groups of Clinical Isolates
3.3. Proteome Expression Patterns Differ Between Groups of Clinical Isolates
In order to evaluate the variability of protein expression across the isolates when P. aeruginosa
In order to evaluate the variability of protein expression across the isolates when P. aeruginosa
strains were cultured under the same environmental condition, we analyzed the 10% most variably
strains were cultured under the same environmental condition, we analyzed the 10% most variably
expressed proteins within biofilm and planktonic growth conditions. 40% of the highly variable
expressed proteins within biofilm and planktonic growth conditions. 40% of the highly variable
proteins overlapped under biofilm and planktonic conditions (Figure A2), indicating that those proteins
proteins overlapped under biofilm and planktonic conditions (FigureA2), indicating that those
were variably expressed between strains independent of the environmental conditions. Figure 4 shows
proteins were variably expressed between strains independent of the environmental conditions.
a heatmap of the 48 most variably expressed and annotated proteins under biofilm conditions. Despite
Figure4 shows a heatmap of the 48 most variably expressed and annotated proteins under biofilm
their variant expression across the 27 isolates, it seemed that there were sub-groups of isolates, which
conditions. Despite their variant expression across the 27 isolates, it seemed that there were sub-
expressed groups of proteins at comparable levels. For instance, six isolates with various phylogenetic
groups of isolates, which expressed groups of proteins at comparable levels. For instance, six isolates
background expressed high levels of PqsBSD and PchDG compared to the other isolates, whereas
with various phylogenetic background expressed high levels of PqsBSD and PchDG compared to the
eleven isolates expressed high levels of seven Phz proteins, as well as OpmD and MexI.
other isolates, whereas eleven isolates expressed high levels of seven Phz proteins, as well as OpmD
and MexI.
3.4. Comparison of the Proteome and Transcriptome Biofilm Profiles
In the context of a further study [42] [and Thöming et al., in preparation] transcriptional profiles
have been recorded for clinical isolates in biofilm and planktonic states. 303 genes were differentially
regulated under biofilm versus planktonic growth conditions, if the 27 clinical isolates used in this
study were considered as replicates. We found that the corresponding genes of almost a third of the
differentially regulated proteins under biofilm conditions exhibited differential gene expression
(Figure5A, Figure 5B, and SupplementaryTable S3). This indicates that clinical isolates adopted
distinct biofilm protein expression profiles that are shared among different clinical isolates, but that
can only partly be deduced from the transcriptional profile under the same environmental conditions.Cells 2019, 8, 1129 8 of 18
Cells 2019, 8, x 8 of 17
Figure 4. Distributionofofexpression
Figure 4.Distribution expression patterns
patterns forfor variable
variable proteins
proteins under
under biofilm
biofilm condition.Out
condition.Out of
of the
the 10% most variable expressed proteins under biofilm conditions, 48 are annotated and listed
10% most variable expressed proteins under biofilm conditions, 48 are annotated and listed here. The here.
The fullof
full list list of variably
variably expressed
expressed genes—also
genes—also for planktonic
for planktonic conditions—is
conditions—is presented
presented in Appendix
in Supplementary
Figure A2B,C.
Figure A2B,C.
3.4. Comparison of the Proteome and Transcriptome Biofilm Profiles
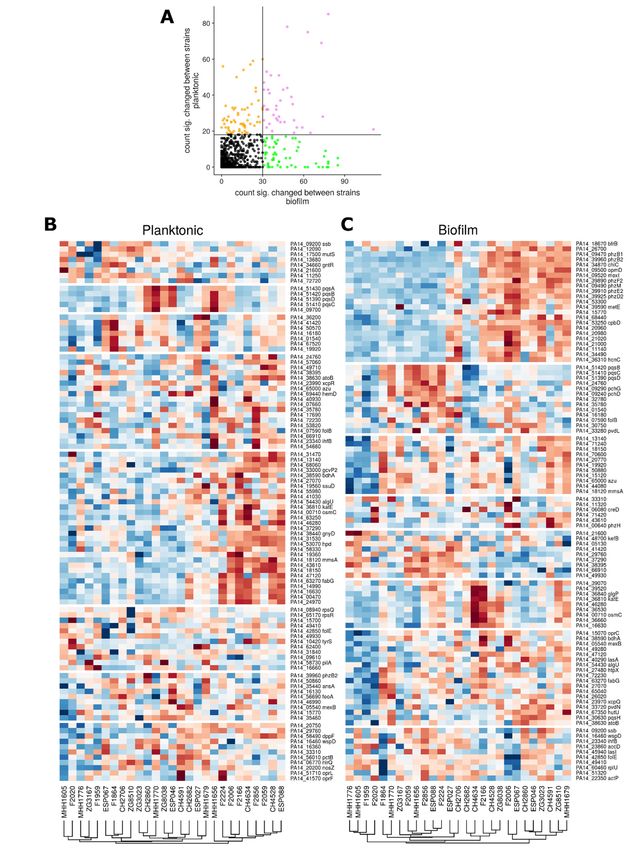
Figure 5B and 5C depict the genes/proteins and the corresponding functional groups, which
wereIn the context
enriched of aproteome
in the further study [42] [and Thöming
and transcriptome et al.,
biofilm in preparation]
profiles across the transcriptional profiles
27 isolates (FigureA3).
have been recorded for clinical isolates in biofilm and
Especially iron-related and transport-functions were found. planktonic states. 303 genes were differentially
regulated under biofilm versus planktonic growth conditions, if the 27 clinical isolates used in this
study were considered as replicates. We found that the corresponding genes of almost a third of
the differentially regulated proteins under biofilm conditions exhibited differential gene expression
(Figure 5A,B, and Supplementary Table S3). This indicates that clinical isolates adopted distinct biofilm
protein expression profiles that are shared among different clinical isolates, but that can only partly be
deduced from the transcriptional profile under the same environmental conditions.Cells 2019, 8, 1129 9 of 18
Cells 2019, 8, x 9 of 17
Figure
Figure5.Comparison
5. Comparison of differentially
of differentiallyexpressed
expressed proteins/transcripts
proteins/transcripts in biofilm
in biofilm versus
versusplanktonic
planktonic
growth
growth conditions. (A)
conditions.(A) Venn Venn diagram
diagram showing
showing thethe overlap
overlap of differentially
of differentially regulated
regulated proteins
proteins and and
transcripts
transcripts under
under biofilm
biofilm versusplanktonic
versus planktonicgrowth
growthconditions
conditions across
across the clinical
clinicalisolates.
isolates.Analysis
Analysisofofthe
thedifferentially
differentiallyexpressed
expressed transcripts waswas
transcripts restricted to the
restricted to 1021 mRNAs
the 1021 mRNAsfor which corresponding
for which proteins
corresponding
were quantified
proteins in this study.
were quantified in this(B) List of(B)
study. all List
annotated
of all differentially regulated proteins
annotated differentially throughout
regulated proteins all
strains. Gene
throughout all names
strains.are printed
Gene in bold
names areif printed
the corresponding
in bold iftranscript was significantly
the corresponding regulated
transcript was as
well. Mostregulated
significantly of the overlapping proteins/mRNAs
as well. Most of the overlappingwere upregulated under were
proteins/mRNAs biofilm condition (49
upregulated out of
under
60). Out
biofilm of these,
condition (4927out
were annotated
of 60). Out of and listed
these, here.annotated
27 were From the remaining
and listed 11 proteins/mRNA
here. that were
From the remaining
11 higher expressed under
proteins/mRNA planktonic
that were higher conditions,
expressed under six were annotatedconditions,
planktonic and listed. six
Onwere
the other hand, several
annotated and
listed. On the other hand, several annotated proteins were regulated in the proteome but not in thecan
annotated proteins were regulated in the proteome but not in the transcriptome. The complete list
be found in Supplementary
transcriptome. The completeTable S3. (C)
list can be All functional
found categories thatTable
in Supplementary were enriched
S3. (C) (p-value < 0.05) in
All functional
the group
categories of proteins/transcripts
that were enriched (p-value withcompares well to the previously reported protein detection rates [21,52,54]. Despite the less-than-
complete coverage of the entire proteome, the recording of extensive proteome profiles across
genetically diverse clinical P. aeruginosa isolates promises to add a valuable layer of information and
to expand genomic and transcriptomic data. Inter-disciplinary data integration strategies coupled
with bioinformatics and biostatistics are promising to support a better understanding of biological
Cells 2019, 8, 1129 10 of 18
systems and might open up new avenues for novel treatment strategies to combat bacterial infections.
Figure
Figure 6. Protein-to-mRNA
6.Protein-to-mRNA ratios ratios
acrossacross
clinicalclinical P. aeruginosa
P. aeruginosa isolates.
isolates.(A) (A) Exemplary
Exemplary plot of
plot of protein-
protein-to-mRNA
to-mRNA correlationcorrelation
between twobetween twounder
strains strainsplanktonic
under planktonic condition.
condition. r = Pearson
r = Pearson correlation
correlation (B)
(B) Median
Median and interquartile
and interquartile range ofrange of the pair-wise
the pair-wise correlation
correlation coefficients
coefficients of all protein-to-mRNA
of all protein-to-mRNA ratios
ratios
of the 27 of the 27under
strains strains under and
biofilm biofilm and planktonic
planktonic conditions.
conditions. Values onValues onthe
top of topboxplots
of the boxplots represent
represent the
the corresponding
corresponding median.median.
4. Discussion
A previous study on the transcriptional profiles of biofilm-grown bacteria showed that there
was only a relativelygenomic
Comparative small number of common
approaches biofilm-specific
have facilitated endpoint
the discovery transcripts
of many in P. aeruginosa
previously unidentified
biofilms
conservedgrown andunder different regulatory
species-specific environmental conditions
pathways [55]. It was
that determine suggested
phenotypic that biofilm
bacterial traits. In
formation
contrastistoa comparative
response to the environment,
genomic rather most
approaches, than aofdevelopmental
the proteomepathway [56]. In
studies have beenthisrestricted
study,
instead of growinganalysis
to comparative one P. between
aeruginosatwo strain under
or few various
isolates biofilm-promoting
or mutant conditions,
strains. However, therewe havegrewbeen
various strains
significant from different
technological genetic backgrounds
and methodological advances underin theone environmental
recording biofilm
of proteomes condition.
recently [49,51].
Interestingly, while the
Proteomic studies variability
that of the protein
give information abundances
on protein acrossprofiles
expression the different
acrossclinical P. aeruginosa
a multitude of strains
isolates
withinwere
one low under
species haveplanktonic growth [21,52,53].
become feasible conditions, the variability was substantially higher under
biofilmUsing
growth conditions. we
SWATH-MS, Thus, despitedifferential
identified the fact thatexpression
the isolates of were grown
overall 1021 under
proteinsidentical
across 27biofilm
clinical
promoting conditions,
P. aeruginosa the differential
isolates. This correspondsexpression
to 17.3% of theof the
5893biofilm
predicted protein
PA14 profile
proteins,wasandstill
thusvariable
compares
across
well the clinical
to the isolates.reported
previously This may indicate
protein that the
detection genetic
rates variation
[21,52,54]. acrossthe
Despite theless-than-complete
clinical isolates
impacts
coverageto aofgreater extent
the entire on the biofilm
proteome, profile,ofwhile
the recording the impact
extensive proteomeon the planktonic
profiles profile is lower.
across genetically diverse
Clearly,
clinicalfurther work isolates
P. aeruginosa on the correlation
promises toofadd genomic
a valuablesequence
layer of variations
informationwithandtranscriptional
to expand genomic and
proteomic profiles is data.
and transcriptomic required in order to link
Inter-disciplinary data different
integration evolved mutations
strategies coupled in clinical
with isolates to
bioinformatics and
phenotypic bacterial behavior.
biostatistics are promising to support a better understanding of biological systems and might open up
newNevertheless,
avenues for noveldespite substantial
treatment variability,
strategies to combatour bacterial
analysis infections.
of the comprehensive proteomic
datasetAofprevious
27 clinical P. aeruginosa
study isolates revealed
on the transcriptional common
profiles P. aeruginosabacteria
of biofilm-grown proteome changes
showed thatthat
there
could
was beonlyobserved
a relativelyacross
smallmultiple
numberclinical
of commonisolates during growth
biofilm-specific within transcripts
endpoint biofilms. For in P.instance,
aeruginosa
among thegrown
biofilms 141 proteins of the soft
under different core biofilmconditions
environmental profile, we found
[55]. It wasa suggested
constant increase
that biofilmin proteins
formation
involved in iron
is a response to sequestration
the environment, andrather
iron metabolic processes, in
than a developmental PQS signaling,
pathway outer
[56]. In this membrane
study, instead of
growing one P. aeruginosa strain under various biofilm-promoting conditions, we grew various strains
from different genetic backgrounds under one environmental biofilm condition. Interestingly, while the
variability of the protein abundances across the different clinical P. aeruginosa isolates were low under
planktonic growth conditions, the variability was substantially higher under biofilm growth conditions.
Thus, despite the fact that the isolates were grown under identical biofilm promoting conditions,
the differential expression of the biofilm protein profile was still variable across the clinical isolates.
This may indicate that the genetic variation across the clinical isolates impacts to a greater extent on
the biofilm profile, while the impact on the planktonic profile is lower. Clearly, further work on the
correlation of genomic sequence variations with transcriptional and proteomic profiles is required in
order to link different evolved mutations in clinical isolates to phenotypic bacterial behavior.
Nevertheless, despite substantial variability, our analysis of the comprehensive proteomic dataset
of 27 clinical P. aeruginosa isolates revealed common P. aeruginosa proteome changes that could beCells 2019, 8, 1129 11 of 18
observed across multiple clinical isolates during growth within biofilms. For instance, among the
141 proteins of the soft core biofilm profile, we found a constant increase in proteins involved in iron
sequestration and iron metabolic processes, in PQS signaling, outer membrane proteins and fatty
acid biosynthesis. On the other hand, we found a general down-regulation of proteins involved in
translation processes. A recent study, which compared in vivo P. aeruginosa proteome profiles across
11 cystic fibrosis (CF) patients with ex vivogrown P. aeruginosa populations from the same patient,
identified a core set of differentially regulated proteins on the same order of magnitude (67 in vivo
up-regulated and 117 down-regulated P. aeruginosa proteins) [21]. Although the conditions within
the CF lung cannot be compared to the in vitro biofilm growth conditions of this study, the in vivo
study also found an up-regulation of iron acquisition systems, and of outer membrane proteins and
a downregulation of proteins involved in translation [21]. Regulation of these proteins might be a
common theme due to biofilm-associated growth of P. aeruginosa in the lungs of chronically infected
CF patients.
In conclusion, while generalizing from one strain to a whole species might be problematic,
the analysis of multiple isolates from one species has the potential to uncover important common
adaptation traits that could become important targets, e.g., in the fight against biofilm infections.
However, our study also demonstrates that there is a lot of variation across different clinical isolates
and there does not seem to be a universal biofilm target. This indicates that an anti-biofilm strategy
will have to consider more than one target in order to be successful against a broad range of different
P. aeruginosa isolates. Furthermore, new information on proteomic changes can help finding undetected
links between the genotype and the phenotype, especially if also genomic and transcriptomic data are
integrated [57]. For instance, in accordance with a previous study [30], we demonstrated that there is
a conserved protein-to-mRNA ratio across our clinical isolates even under different environmental
conditions. This indicates that there may be a constitutive post-transcriptional regulation of defined
sub-groups of genes in the opportunistic pathogen P. aeruginosa, whose importance for the adaptability
of bacteria warrants to be further explored.
Supplementary Materials: The following are available online at http://www.mdpi.com/2073-4409/8/10/1129/s1,
Table S1: Table_S1_proteome_data.xlsx, Table S2: Table_S2_transcriptome_data.xlsx, Table S3: Table_S3_differe
ntial_expression.xlsx.
Author Contributions: Conceptualization, J.E., A.P., C.L., and S.H., methodology, J.E., J.G.T. and C.L.; software,
C.L.; formal analysis, J.E.; resources, C.L.; data curation, J.E. and S.P.; writing—original draft preparation, J.E.
and S.H.; writing—review and editing, A.P. and C.L.; visualization, J.E.; supervision, A.P. and S.H.; funding
acquisition, S.H.
Funding: This research was funded by the European Research Council (http://erc.europa.eu/), ERC COMBAT
grant 724290
Acknowledgments: We thank Lisa Neuenroth (University Medical Center Göttingen) and KarstenHeidrich
(Hannover Medical School) for their expert technical assistance.
Conflicts of Interest: The authors declare no conflict of interest.Cells 2019, 8, 1129 12 of 18
Appendix A
Table A1. Genes with the highest and lowest protein-to-mRNA ratio.The median of the 10 highest and
lowest protein-to-mRNA ratio (log2) throughout all strains under the given condition.
Protein/mRNA
Condition PA14_ID Gene.Name Product.Name
(median)
3.06 pl PA14_21010 FAD-dependent monooxygenase
glycerol-3-phosphate
2.67 pl PA14_17930 glpD
dehydrogenase
2.64 pl PA14_34840 non-ribosomal peptide synthetase
2.63 pl PA14_21020 non-ribosomal peptide synthetase
2.60 bf PA14_35790 homospermidine synthase
2.41 pl PA14_33280 pvdL peptide synthase
2.38 pl PA14_09280 pchF pyochelinsynthetase
potential phenazine-modifying
2.36 pl PA14_00640 phzH
Cells 2019, 8, x enzyme 12 of 17
2.29 pl PA14_27370 ATP-dependent RNA helicase
Type II restriction enzyme,
2.292.26 pl bf PA14_15580
PA14_27370 ATP-dependent RNA helicase
methylase subunit
2.26 bf PA14_15580 Type II restriction enzyme, methylase
16S rRNA-processing subunit
protein
−2.96 bf PA14_15980 rimM
RimM
-2.96 bf PA14_15980 rimM 16S rRNA-processing protein RimM
16S rRNA-processing protein
−2.99
-2.99 pl pl PA14_15980rimM
PA14_15980 rimM
16S rRNA-processing
RimM protein RimM
−3.08
-3.08 bf bf PA14_18670 bfrB
PA14_18670 bacterioferritinbacterioferritin
bfrB
−3.12 pl PA14_64520 bacterioferritin
-3.12
−3.15 pl pl PA14_64520
PA14_24770 bacterioferritinhypothetical protein
-3.15
−3.26 pl pl PA14_24770
PA14_68260 hypothetical protein
c4-dicarboxylate-binding protein
RNA polymerase sigma factor
-3.26
−3.53 pl pl PA14_68260
PA14_54430 c4-dicarboxylate-binding
algU protein
AlgU
-3.53
−3.64 pl pl PA14_54430
PA14_18670algU RNA
bfrB polymerase sigma factor AlgU
bacterioferritin
-3.64 pl PA14_18670 integration host factor subunit
−3.65 pl PA14_23340 bfrB bacterioferritin
ihfB
beta
-3.65
−4.22 pl pl PA14_23340
PA14_65000 ihfB integration
azu host factor subunit beta
azurin
-4.22 pl PA14_65000 azu azurin
Figure A1. Overlap with core biofilm proteome for each strain.Percentage of significantly regulated
proteins between a biofilm and planktonic condition that are also part of the core biofilm proteome.
Figure A1.Overlap with core biofilm proteome for each strain.Percentage of significantly regulated
Data is divided into up-regulated (up) and down-regulated (down) proteins.
proteins between a biofilm and planktonic condition that are also part of the core biofilm proteome.
Data is divided into up-regulated (up) and down-regulated (down) proteins.Cells 2019, 8, 1129 13 of 18
Cells 2019, 8, x 13 of 17
A2. Variableprotein
FigureA2.Variable
Figure protein expression
expressionbetween
betweenstrains. (A) Comparison
strains.(A) Comparison of variably expressed
of variably proteins
expressed
under biofilm and planktonic condition. The count of significant differential expression
proteins under biofilm and planktonic condition. The count of significant differential expression between two
between two strains is plotted for both conditions. The 10% most variable expressed proteins are B.
strains is plotted for both conditions. The 10% most variable expressed proteins are shown in A and
(B) Heatmap
shown in A and of B.
10%(B)most variable
Heatmap of proteins
10% mostunder planktonic
variable condition.
proteins (C) Heatmap
under planktonic of 10% most
condition.(C)
variableofproteins
Heatmap 10% mostunder biofilm
variable condition.
proteins under biofilm condition.Cells 2019, 8, 1129 14 of 18
Cells 2019, 8, x 14 of 17
Figure A3. Functional enrichment biofilm/planktonic in protein and mRNA.All functional categories
Figure
that were A3.Functional
enriched (p-value enrichment
< 0.05) in thebiofilm/planktonic
group of proteins orin transcripts
protein andwith mRNA.All functional
a differential categories
expression
underthat wereasenriched
biofilm compared(p-value < 0.05) ingrowth
to planktonic the group of proteins
conditions or transcripts
are listed. with athat
The function differential
is enrichedexpression
in
under
proteins thatbiofilm as compared
are up-regulated to planktonic
under growth in
biofilm condition conditions are listed.
the individual The(x-axes)
isolates function is that is enriched
colored in
in proteins
red and that are up-regulated
down-regulated under
in blue. Barplots biofilmhow
indicate condition
many in the individual
proteins isolates
are up- and (x-axes) is colored
down-regulated
in the individual strains. Core_Trans and core_Prot represent all isolates seen as biologicaldown-regulated
in red and down-regulated in blue. Barplots indicate how many proteins are up- and replicates.
in theare
Functions individual strains.
derived from Core_Trans
KEGG- and core_Prot
(1), PseudoCAP- (2) or represent all isolates(3)
gene ontology(GO)- seen as biological
annotations. replicates.
GO-MF
= molecular
Functions are derived
function, = biological
GO-BPfrom KEGG- (1), PseudoCAP-
process, GO-CC=(2) or gene
cellular ontology(GO)- (3) annotations. GO-
component.
MF = molecular function, GO-BP = biological process, GO-CC= cellular component.
References
1. Hall-Stoodley, L.; Costerton, J.W.; Stoodley, P. Bacterial biofilms: From the Natural environment to
infectious diseases. Nat. Rev. Microbiol.2004, 2, 95–108.Cells 2019, 8, 1129 15 of 18
References
1. Hall-Stoodley, L.; Costerton, J.W.; Stoodley, P. Bacterial biofilms: From the Natural environment to infectious
diseases. Nat. Rev. Microbiol. 2004, 2, 95–108. [CrossRef] [PubMed]
2. Watnick, P.; Kolter, R. Biofilm, city of microbes. J. Bacteriol. 2000, 182, 2675–2679. [CrossRef] [PubMed]
3. Flemming, H.-C.; Wingender, J. The biofilm matrix. Nat. Rev. Microbiol. 2010, 8, 623–633. [CrossRef]
[PubMed]
4. Teschler, J.K.; Zamorano-Sánchez, D.; Utada, A.S.; Warner, C.J.A.; Wong, G.C.L.; Linington, R.G.; Yildiz, F.H.
Living in the matrix: Assembly and control of Vibrio cholerae biofilms. Nat. Rev. Microbiol. 2015, 13, 255.
[CrossRef] [PubMed]
5. Stewart, P.S.; Franklin, M.J.; Williamson, K.S.; Folsom, J.P.; Boegli, L.; James, G.A. Contribution of Stress
Responses to Antibiotic Tolerance in Pseudomonas aeruginosa Biofilms. Antimicrob. Agents Chemother. 2015, 59,
3838–3847. [CrossRef] [PubMed]
6. Townsley, L.; Sison Mangus, M.P.; Mehic, S.; Yildiz, F.H. Response of Vibrio cholerae to Low-Temperature
Shifts: CspV Regulation of Type VI Secretion, Biofilm Formation, and Association with Zooplankton. Appl.
Environ. Microbiol. 2016, 82, 4441–4452. [CrossRef] [PubMed]
7. Hughes, G.; Webber, M.A. Novel approaches to the treatment of bacterial biofilm infections. Br. J. Pharmacol.
2017, 174, 2237–2246. [CrossRef] [PubMed]
8. Costerton, J.W.; Stewart, P.S.; Greenberg, E.P. Bacterial biofilms: A common cause of persistent infections; American
Association for the Advancement of Science: Washington, DC, USA, 1999; Volume 284, pp. 1318–1322.
9. Reisner, A.; Høiby, N.; Tolker-Nielsen, T.; Molin, S. Microbial Pathogenesis and Biofilm Development. In
Concepts in Bacterial Virulence; KARGER: Basel, Switzerland, 2004; Volume 12, pp. 114–131.
10. Costerton, J.W. Cystic fibrosis pathogenesis and the role of biofilms in persistent infection. Trends Microbiol.
2001, 9, 50–52. [CrossRef]
11. Khatoon, Z.; McTiernan, C.D.; Suuronen, E.J.; Mah, T.-F.; Alarcon, E.I. Bacterial biofilm formation on
implantable devices and approaches to its treatment and prevention. Heliyon 2018, 4, e01067. [CrossRef]
12. Smith, W.D.; Bardin, E.; Cameron, L.; Edmondson, C.L.; Farrant, K.V.; Martin, I.; Murphy, R.A.; Soren, O.;
Turnbull, A.R.; Wierre-Gore, N.; et al. Current and future therapies for Pseudomonas aeruginosa infection in
patients with cystic fibrosis. FEMS Microbiol. Lett. 2017, 364. [CrossRef]
13. McCarthy, R.R.; Mazon-Moya, M.J.; Moscoso, J.A.; Hao, Y.; Lam, J.S.; Bordi, C.; Mostowy, S.; Filloux, A.
Cyclic-di-GMP regulates lipopolysaccharide modification and contributes to Pseudomonas aeruginosa immune
evasion. Nat. Microbiol. 2017, 2, 17027. [CrossRef] [PubMed]
14. Valentini, M.; Gonzalez, D.; Mavridou, D.A.; Filloux, A. Lifestyle transitions and adaptive pathogenesis of
Pseudomonas aeruginosa. Curr. Opin. Microbiol. 2018, 41, 15–20. [CrossRef] [PubMed]
15. Park, A.J.; Murphy, K.; Krieger, J.R.; Brewer, D.; Taylor, P.; Habash, M.; Khursigara, C.M. A temporal
examination of the planktonic and biofilm proteome of whole cell Pseudomonas aeruginosa PAO1 using
quantitative mass spectrometry. Mol. Cell. Proteomics 2014, 13, 1095–1105. [CrossRef] [PubMed]
16. Herbst, F.A.; Søndergaard, M.T.; Kjeldal, H.; Stensballe, A.; Nielsen, P.H.; Dueholm, M.S. Major proteomic
changes associated with amyloid-induced biofilm formation in Pseudomonas aeruginosa PAO1. J. Proteome Res.
2015, 14, 72–81. [CrossRef] [PubMed]
17. Guilbaud, M.; Bruzaud, J.; Bouffartigues, E.; Orange, N.; Guillot, A.; Aubert-Frambourg, A.; Monnet, V.;
Herry, J.-M.; Chevalier, S.; Bellon-Fontaine, M.-N. Proteomic Response of Pseudomonas aeruginosa PAO1
Adhering to Solid Surfaces. Front. Microbiol. 2017, 8, 1465. [CrossRef] [PubMed]
18. Fuqua, C.; Filloux, A.; Ghigo, J.-M.; Visick, K.L. Biofilms 2018: A diversity of microbes and mechanisms. J.
Bacteriol. 2019. [CrossRef] [PubMed]
19. Cromie, G.A.; Tan, Z.; Hays, M.; Sirr, A.; Jeffery, E.W.; Dudley, A.M. Transcriptional Profiling of Biofilm
Regulators Identified by an Overexpression Screen in Saccharomyces cerevisiae. G3 (Bethesda). 2017, 7,
2845–2854. [CrossRef]You can also read