Compositional Differences and Similarities between Typical Chinese Baijiu and Western Liquor as Revealed by Mass Spectrometry-Based Metabolomics ...
←
→
Page content transcription
If your browser does not render page correctly, please read the page content below
H

         OH
              OH
                   metabolites
Article
Compositional Differences and Similarities between
Typical Chinese Baijiu and Western Liquor as
Revealed by Mass Spectrometry-Based Metabolomics
Cheng Fang 1 , Hai Du 1 , Wei Jia 2, *              and Yan Xu 1, *
 1        State Key Laboratory of Food Science and Technology, School of Biotechnology, Jiangnan University,
          Wuxi 214122, China; playfang1989@hotmail.com (C.F.); duhai88@126.com (H.D.)
 2        University of Hawaii Cancer Center, Honolulu, HI 96813, USA
 *        Correspondence: wjia@cc.hawaii.edu (W.J.); yxu@jiangnan.edu.cn (Y.X.); Tel.: +808-564-5823 (W.J.);
          +86-510-85197760 (Y.X.)

 Received: 25 October 2018; Accepted: 12 December 2018; Published: 21 December 2018

 Abstract: Distilled liquors are important products, both culturally and economically. Chemically,
 as a complex mixture, distilled liquor comprises various chemical compounds in addition to ethanol.
 However, the chemical components of distilled liquors are still insufficiently understood and
 compositional differences and similarities of distilled liquors from different cultures have never
 been compared. For the first time, both volatile organic compounds (VOCs) and non-VOCs in
 distilled liquors were profiled using mass spectrometry-based metabolomic approaches. A total of
 879 VOCs and 268 non-VOCs were detected in 24 distilled liquors including six typical Chinese baijiu
 and 18 typical Western liquors. Principal component analysis and a correlation network revealed
 important insights into the compositional differences and similarities of the distilled liquors that
 were assessed. Ethyl esters, a few benzene derivatives, and alcohols were shared by most distilled
 liquors assessed, suggesting their important contribution to the common flavor and mouthfeel of
 distilled liquors. Sugars and esters formed by fatty alcohol differ significantly between the assessed
 Chinese baijiu and Western liquors, and are potential marker compounds that could be used for
 their discrimination. Factors contributing to the differences in chemical composition are proposed.
 Our results improve our understanding of the chemical components of distilled liquors, which may
 contribute to more rigorous quality control of alcoholic beverages.

 Keywords: distilled liquor; metabolomics; volatile compounds; HS-SPME-GC-TOFMS; non-volatile
 compounds; GC-TOFMS

1. Introduction
     Alcoholic beverages have been a part of human civilization for millennia and they are an
indispensable aspect of human culture [1]. During the development of civilization, various distilled
liquors were created around the world, including whisky, brandy, rum, vodka, and baijiu (also known
as Chinese liquor). Today, distilled liquors are high value products, both commercially and
culturally [2], and contribute significantly to total alcohol consumption.
     Chemically, distilled liquor is a complex mixture of water, ethanol and several thousands
of chemical compounds [3], which contribute to the unique flavor and mouthfeel of each type
of liquor. Routine chemical analysis of distilled liquors was conducted using headspace solid
phase microextraction (HS-SPME), coupled with gas chromatography–mass spectrometry (GC–MS).
This method was proven to be very useful in analyzing the volatile organic compounds (VOCs)
that contribute to the flavor of distilled liquors, such as brandy [4], rum [5], whisky [6], vodka [7],

Metabolites 2019, 9, 2; doi:10.3390/metabo9010002                                www.mdpi.com/journal/metabolites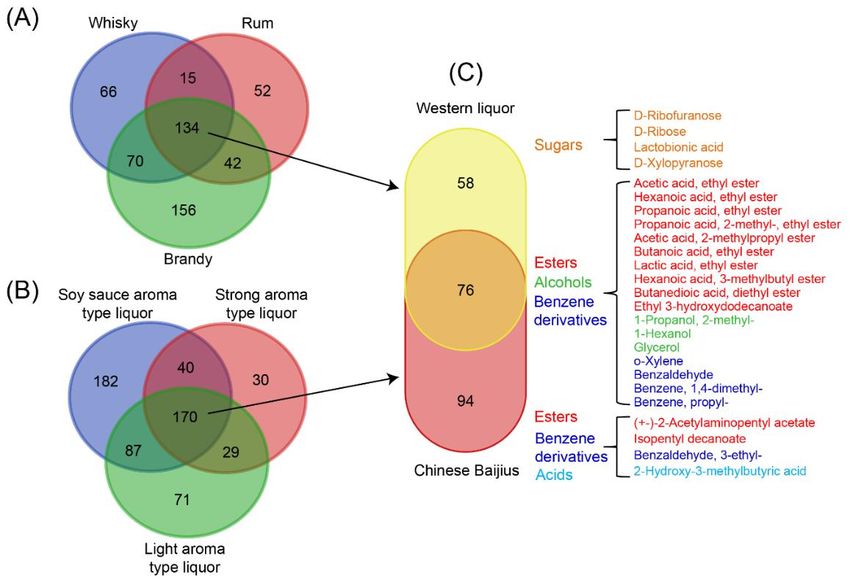
Metabolites 2019, 9, 2                                                                             2 of 18

and baijiu [8]. However, the chemical components of distilled liquors are still poorly understood,
because non-VOCs, which often influence the overall flavor volatility and perception, also exist
in distilled liquors [9]. For instance, we recently detected lichenysin (a macro-molecular cyclic
lipopeptide) in baijiu [9,10], and caramel is often manually added into aged whisky and brandy [2,11].
The chemical compounds in distilled liquors from different cultures may vary given the use of different
raw materials, production processes, and the maturation conditions. For example, most Western
liquors are fermented by yeasts, which significantly differs from baijiu, whose fermentation is driven
by various microorganisms (bacteria, yeasts, and filamentous fungi) [3]. In addition, baijiu is produced
through solid-state fermentation and distillation, whereas Western liquors are produced by submerged
fermentation and distillation. Hence, it is reasonable to deduce that the composition of Chinese baijiu
and Western liquor is different. However, to the best of our knowledge, these compositional differences
and similarities have never been compared.
      Metabolomics, as a holistic and powerful approach, may be suitable for analyzing the complete
chemical composition of distilled liquors. Metabolomics focuses on the comprehensive measurement
of large-scale small molecular metabolites in complex biological and abiotic samples and is the third
most commonly employed omics technology, after genomics and proteomics [12,13]. Powered by the
unparalleled sensitivity and specificity, high resolution and wide dynamic range of MS [14], automated
sample processing, and advanced metabolomic protocols, high-throughput GC–MS is a reliable tool
for chemical profiling, and has been extensively applied in the analyses of components from foods and
beverages [15,16]. Thus, metabolomics is ideally positioned for the metabolite profiling of distilled
liquors. We could also establish more rigorous quality control of distilled liquors through metabolomics.
For example, Chinese baijiu is produced through mixed culture fermentation, solid-state fermentation,
and simultaneous saccharification and fermentation. The nature of Chinese baijiu production makes
it susceptible to environmental factors. Our previous studies revealed that the fermentation process
of Chinese light-aroma-type liquor was at risk of contamination with Streptomyces. Streptomyces is a
producer of geosmin, which is known for having a distinct earthy flavor and affecting the quality of
Chinese liquor [17–20].
      This study aimed to comprehensively analyze both VOCs and non-VOCs in selected distilled
liquors, providing chemical characterization for future investigation into the impact of these alcoholic
beverages on human health. We compared the chemical composition of liquors from different cultures,
such as several Chinese baijius and Western liquors, which could potentially help us to understand the
factors that cause the compositional differences in liquors from different cultures. Due to the different
compounds that may influence the flavor and taste, or even the safety of liquors (especially for Chinese
baijiu, which is produced under natural susceptible conditions), our analysis may also help to improve
the mouthfeel and quality of Chinese baijiu. Our study may contribute to the establishment of more
rigorous controls on the quality and flavor of distilled liquor and may help us to understand the
relationship between the metabolites derived from complex microflora and food safety and nutrition.

2. Results

2.1. VOCs Detected by HS-SPME-GC-TOFMS
     A total of 879 VOCs (661 identified VOCs) were detected in 24 distilled liquors (Table S1).
Among the distilled liquors analyzed, C1 had the largest number of VOCs, with 466 compounds
detected (344 identified VOCs). This was more than four-fold greater than V4, which had the lowest
number of VOCs with 114. The amounts of VOCs detected in the whiskies, brandies, and rums
were comparable, with more than 300 VOCs (Figure 1A). Among the VOCs detected, 159 were esters,
92 were alcohols, 105 were aldoketones, and 166 were benzene derivatives. A small number (23) of
organic acids were also detected (Figure 1A).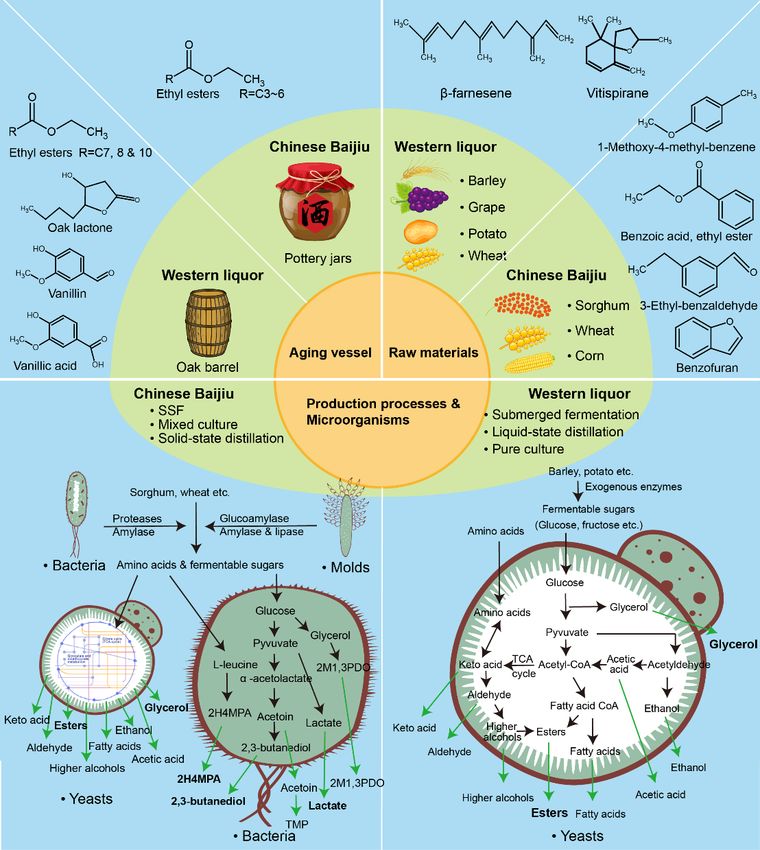
Metabolites 2019, 9, 2                                                                                                  3 of 18
Metabolites 2018, 8, x                                                                                                   3 of 18

       Figure1.1.Volatile
      Figure      Volatileorganic
                           organiccompounds
                                    compounds(VOCs)
                                                  (VOCs)in indistilled
                                                              distilledliquors
                                                                         liquors detected
                                                                                 detected byby HS-SPME-GC-TOFMS.
                                                                                                HS-SPME-GC-TOFMS.
      (A)
       (A) Number of compounds in major classes of VOCs in 24 representative liquors.
          Number    of compounds     in major classes of VOCs   in  24  representative  distilled  distilled(B)  Contents
                                                                                                              liquors. (B)
      of major  classes of VOCs.   (C)  Relative concentration   of major   classes of non-VOCs.
       Contents of major classes of VOCs. (C) Relative concentration of major classes of non-VOCs.   Abbreviations:    C1
      and C2, ChineseC1
       Abbreviations:    soyand
                              sauce
                                  C2,aroma  typesoy
                                       Chinese    liquor 1 and
                                                     sauce      2, respectively;
                                                            aroma    type liquor C3
                                                                                  1 andand2,C4,  Chinese strong
                                                                                              respectively;        aroma
                                                                                                              C3 and   C4,
      type liquor  3 and   4, respectively; C5  and  C6, Chinese     light aroma   type  liquor  5  and  6,
       Chinese strong aroma type liquor 3 and 4, respectively; C5 and C6, Chinese light aroma type liquor 5 respectively;
      W1–W5,    Whisky 1–5;W1–W5,
       and 6, respectively;    B1–B5, Brandy
                                        Whisky1–5;
                                                 1–5;R1–R4,
                                                      B1–B5,Rum
                                                              Brandy1–4;1–5;
                                                                          andR1–R4,
                                                                              V1–V4,Rum Vodka
                                                                                            1–4;1–4.
                                                                                                  and V1–V4, Vodka 1–
       4.
      Esters, as one of the most important classes of flavor compounds in distilled liquors, are commonly
generated   by as
       Esters,   esterification
                     one of thereactions     between organic
                                   most important       classes acids    and alcohols
                                                                   of flavor   compounds duringin the  fermentation
                                                                                                    distilled  liquors,andare
aging   processes    [21,22].  Esters  had   the  highest   total  concentration     among
 commonly generated by esterification reactions between organic acids and alcohols during thethe    VOCs    in all distilled
liquors  assessed
 fermentation     andexcept
                       agingfor  some vodka
                               processes         samples
                                           [21,22].  Esters(V2,
                                                             had V3,
                                                                  the and   V4),total
                                                                       highest    in which   benzene derivatives
                                                                                       concentration     among the VOCswere
more   abundant    (Figure   1B). In most   Western   liquors—such      as  whisky,   brandy,  and
 in all distilled liquors assessed except for some vodka samples (V2, V3, and V4), in which benzene  rum—octanoic       acid
ethyl  ester had
 derivatives   werethemore
                        highest   ester concentration
                              abundant    (Figure 1B). In(ranging     from 23liquors—such
                                                             most Western       to 405 mg/L,as    none   in R1),
                                                                                                    whisky,       followed
                                                                                                               brandy,   and
by  decanoic   acid   ethyl  ester (ranging    from  21 to  70  mg/L,   none   in  any  whisky,
 rum—octanoic acid ethyl ester had the highest ester concentration (ranging from 23 to 405 mg/L,   R2, or  R3). These   two
compounds
 none in R1),constituted
                 followed by  8–48%   of theacid
                                decanoic      total VOCs
                                                  ethyl      (10–48%
                                                         ester         in whiskies,
                                                                (ranging   from 21 to19–29%
                                                                                        70 mg/L,in brandies,
                                                                                                     none in anyandwhisky,
                                                                                                                     8–47%
in rums).  The    dominated     esters were    quite different   in Chinese   baijius.  Lactic
 R2, or R3). These two compounds constituted 8–48% of the total VOCs (10–48% in whiskies, 19–29%acid  ethyl  ester  was  the
most   abundant     ester  in Chinese   soy   sauce  aroma    type  liquor  (929   mg/L   in C1    and
 in brandies, and 8–47% in rums). The dominated esters were quite different in Chinese baijius. Lactic  903  mg/L    in C2),
followed
 acid ethylby   acetic
             ester  was acid
                          theethyl
                               most ester  (771 mg/L
                                     abundant     ester ininChinese
                                                              C1 and soy
                                                                      851 sauce
                                                                            mg/Laroma
                                                                                    in C2).type
                                                                                            Hexanoic
                                                                                                  liquor acid   ethyl ester
                                                                                                          (929 mg/L    in C1
had  the highest    concentration    in Chinese    strong   aroma   type  liquor   (772
 and 903 mg/L in C2), followed by acetic acid ethyl ester (771 mg/L in C1 and 851 mg/L  mg/L     in C3  and   643  mg/L   in
                                                                                                                     in C2).
Hexanoic acid ethyl ester had the highest concentration in Chinese strong aroma type liquor (772
mg/L in C3 and 643 mg/L in C4), followed by pentanoic acid ethyl ester (317 mg/L in C3 and 224 mg/L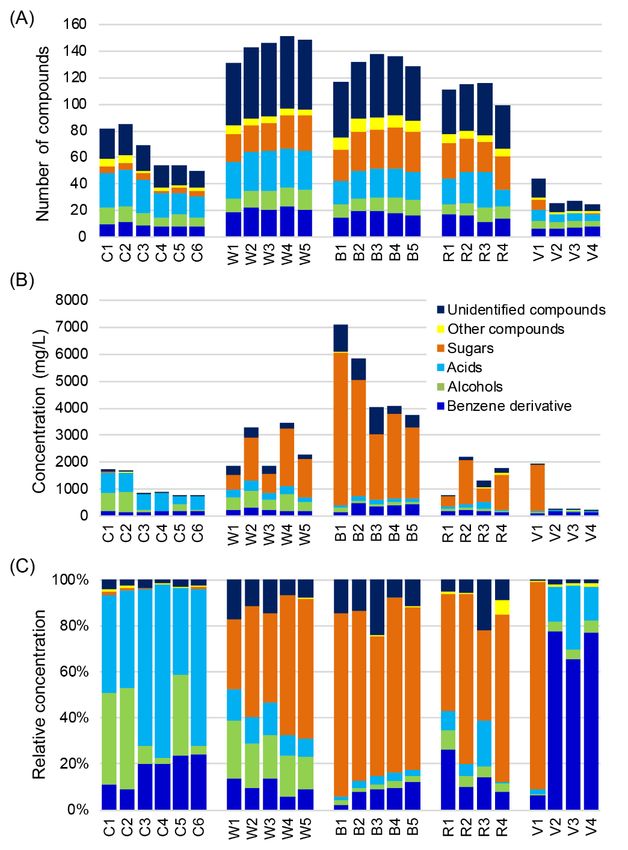
Metabolites 2019, 9, 2                                                                           4 of 18

C4), followed by pentanoic acid ethyl ester (317 mg/L in C3 and 224 mg/L in C4). In Chinese light
aroma type liquor, acetic acid ethyl ester was the dominant ester (250 mg/L in C5 and 167 mg/L in
C6) followed by decanoic acid ethyl ester (125 mg/L in C5 and 165 mg/L in C6). The two of the most
abundant esters constituted 23–29% of the total VOCs in Chinese baijius (Tables S1 and S2).
     Alcohols and benzene derivatives alternated as the second most abundant VOCs in the distilled
liquors assessed. Alcohols are produced by yeasts as by-products of reactions involving amino acids
and carbohydrates [23]. The concentrations of alcohols differ significantly among distilled liquors
ranging from 3 to more than 500 mg/L (account for 3–30%) (Figure 1C). Chinese soy sauce aroma type
liquor had the highest concentration of alcohols (506 mg/L in C1 and 514 mg/L in C2), followed by
Chinese strong aroma type liquor (417 mg/L in C3 and 390 mg/L in C4) (Figure 1B). However, R4 had
the highest relative concentratons of alcohols accounting for 30% of the total VOCs, which was much
higher than in Chinese baijius (7–11%), although their contents in R4 (217 mg/L) were lower than in
Chinese baijius. Consistent with a previous study [23], 1-butanol, 3-methyl- was the major alcohol
in most of the distilled liquors except for Chinese baijius, in which 1-hexanol was more abundant
(Tables S1 and S2).
     Although the quantity of benzene derivatives were comparable with esters, their concentrations
(40–372 mg/L) were much lower than esters (22–4044 mg/L) in the distilled liquors assessed
(Figure 1A,B). Vodkas had the highest relative concentration of benzene derivatives (38–67%), which
was much higher than those of other samples (5–26%) (Figure 1B). Benzene, 1,3-bis(1,1-dimethylethyl)-
dominated the benzene derivatives accounting for 13–35% of total VOCs in vodkas. In contrast,
benzaldehyde was the most abundant benzene derivative in other samples (Tables S1 and S2).
     Aldoketones are other important flavor compounds in alcoholic beverages. Although aldoketones
represented the third largest group of VOCs, their relative concentrations were generally low, ranging
from 1% to 8% (Figure 1A,C).
     Organic acids were the least detected VOCs. This group of compounds had different distributions
among the distilled liquors assessed. Middle-chain fatty acids, such as octanoic acid, nonanoic acid,
and branched-chain 2,2-dimethylbutyric acid and heptanoic acid, 2-ethyl-, were the main organic
acids in most Werstern liquors except for the vodkas, in which organic acids were barely detected.
In Chinese baijius, octanoic acid and short chain fatty acid, such as acetic acid, butanoic acid, and
hexanoic acid, were the predominated organic acids (Tables S1 and S2 ).

2.2. Non-VOCs Detected by GC-TOFMS
     A total of 268 non-VOCs (160 identified non-VOCs) including organic acids, alcohols, sugars
and benzene derivatives were detected by GC-TOFMS (Table S3). Most of these non-VOCs were
detected in distilled liquors for the first time. Organic acids (46 compounds) were the most frequently
detected non-VOCs, accounting for 17% of the total non-VOCs, followed by sugars (43 compounds),
benzene derivative (30 compounds), and alcohols (27 compounds) (Figure 2A). These four classes
of compounds constituted about 55% of the total non-VOCs detected. Esters, the dominating VOCs
detected by HS-SPME-GC-TOFMS, were barely detected.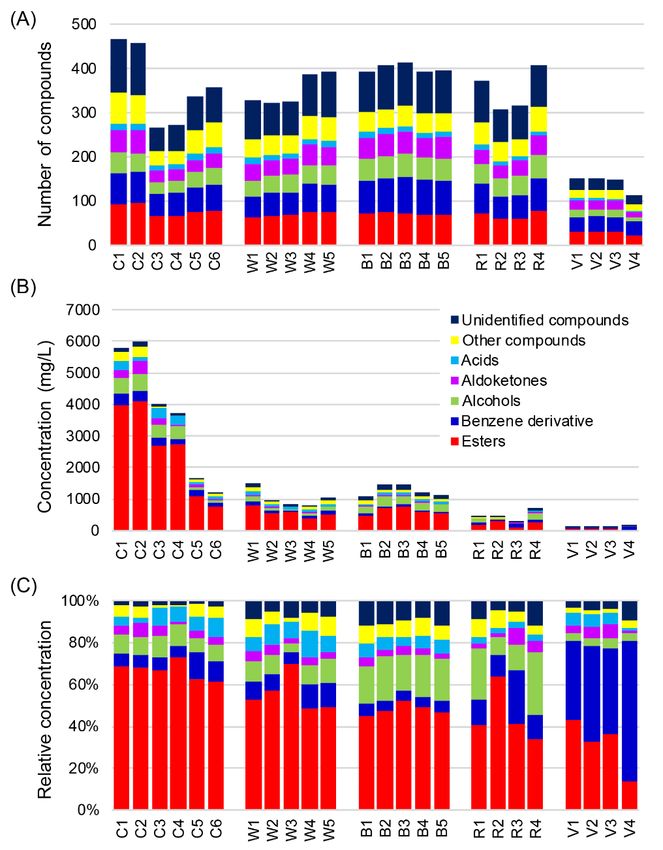
Metabolites 2019, 9, 2 5 of 18
Metabolites 2018, 8, x 5 of 18
Figure 2. Non-volatile
Figure organic
2. Non-volatile organic compounds
compounds(non-VOCs)
(non-VOCs) inin distilled liquorsdetected
distilled liquors detectedbybyGC-TOFMS.
GC-TOFMS.
(A) (A)
Number of compounds in major classes of non-VOCs in 24 representative distilled
Number of compounds in major classes of non-VOCs in 24 representative distilled liquors. liquors.
(B)
(B) Contents
Contents of
ofmajor
majorclasses
classesofofnon-VOCs.
non-VOCs. (C) Relative concentrations of major classes of non-VOCs.
(C) Relative concentrations of major classes of non-VOCs.
TheThe
contents
contentsof of
non-volatile
non-volatileacids
acidsininChinese
Chinesebaijius
baijius(283–727
(283–727 mg/L) weregeneraly
mg/L) were generalyhigher
higherthan
than
in Western
in Westernliquors (16–378
liquors (16–378 mg/L)
mg/L)(Figure
(Figure2B).2B).Lactic
Lacticacid
acid was
was the major non-volatile
the major non-volatileacid acidininChinese
Chinese
baijius (125–484
baijius (125–484mg/L)
mg/L)accounting
accountingfor 7–53% of theoftotal
for 7–53% the non-VOCs. However,
total non-VOCs. lactic acid
However, was
lactic detected
acid was
in only smallinamounts
detected only small in amounts
Western inliquors
Western (1–44 mg/L).
liquors (1–44 mg/L).
Sugars
Sugarsonly comprised
only comprised about
about less
lessthan
than2%
2%ofofthe
thetotal
total non-volatile profilein
non-volatile profile inChinese
Chinesebaijius,
baijius,but
but
werewere
the the
majormajor non-VOCs
non-VOCs in Western
in Western liquors,
liquors, comprising
comprising from
from 30%
30% to to
90%90%of of total
total non-VOCs
non-VOCs except
except for
someforvodkas
some vodkas
(V2 and (V2
V3) and V3) in which
in which no sugar no was
sugar was detected
detected (Figure(Figure 2C). Six-carbon
2C). Six-carbon (C6)-derived
(C6)-derived sugars,
suchsugars, such and
as fructose as fructose
mannose, anddominated
mannose, the dominated
non-VOCs theinnon-VOCs in Western
Western liquors. liquors.
Fructose Fructose
accounted for
accounted for more than 9% of the total non-VOCs in Western liquors, with
more than 9% of the total non-VOCs in Western liquors, with the highest abundance (56%) found in B1 the highest abundance
(56%)
(Table S3 found
and Tablein B1S4).
(Table S3 and Table S4).
The non-volatile
The non-volatile alcohols alcoholsdetected
detectedwere weremainly
mainlypolyols.
polyols. Glycerol
Glycerol waswas thethe main
mainnon-volatile
non-volatile
alcohol with content ranging from 9 to 553.2 mg/L in the Western liquors assessed. In contrast, the
alcohol with content ranging from 9 to 553.2 mg/L in the Western liquors assessed. In contrast, the
distribution of alcohols was more balanced in Chinese baijius. For example, in addition to glycerol,
distribution of alcohols was more balanced in Chinese baijius. For example, in addition to glycerol,
2-methyl-1,3-propanediol and 2,3-butandiol were the main non-volatile alcohols, with 2,3-butandiol
2-methyl-1,3-propanediol and 2,3-butandiol were the main non-volatile alcohols, with 2,3-butandiolMetabolites 2019, 9, 2 6 of 18
accounting for more than 50% of the total non-volatile alcohols in Chinese soy sauce aroma type liquor
(Table S3 and Table S4).
Although the contents of benzene derivatives were stable at 123–468 mg/L in the distilled liquors
assessed, their relative concentration varied considerably, constituting 2–78% of total non-VOCs
(Figure 2B,C). Benzene, ethyl, and benzene,1,4-dimethyl- were the most common benzene derivatives
(Tables S3 and S4).
2.3. Characterization of Differences and Similarities of Chinese Baijius and Western Liquors by PCA and
Correlation Network
In addition to the direct comparisons of VOCs and non-VOCs in Chinese baijius and Western
liquors, we used more holistic analytical methods such as principal component analysis (PCA) and
correlation network analysis to evaluate systemic differences amongst the samples.
PCA, an unsupervised model that considers all variables, clusters or separates samples by
reducing the dimensionality of variables. The first 10 principal components (PCs) of the VOCs-based
PCA model described more than 80% of the data, with the first two PCs representing more than 42% of
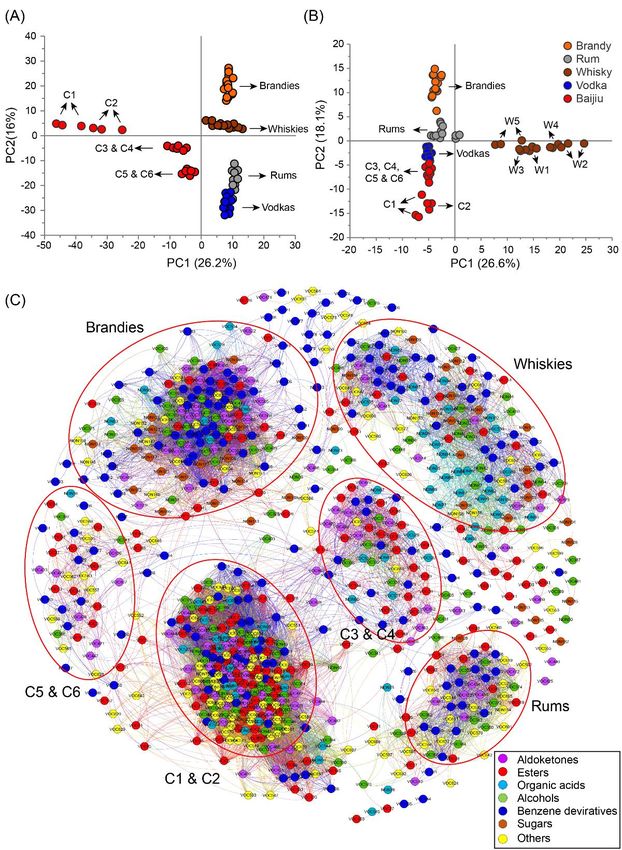
the variance in the data. The Chinese baijius were on the left of PC1 and all the Western liquors were
located on the right of PC1. The first eight PCs of the non-VOCs-based PCA model described more
than 80% of the data, with the first two representing more than 44% of the variance in the data. The
Chinese baijius and vodkas were located on the lower left of PC1 and the rest of the Western liquors
were distributed on the right of PC1 or above PC2. In both scores plots, Chinese baijius could be
seperated from the Western liquors, suggesting their compositional differences (Figure 3A,B). Similar
result was also obtained through heatmap analysis by conbining VOCs and non-VOCs (Figure S1).
Unsupervised PCA is superior for observing the similarities and differences between samples.
However, PCA inevitably causes data loss during dimensionality reduction. Although the PCA loading
plot has the potential to find variables that contribute to the the separation of samples, it also ignores
important informations when there is a large number of variables (Figure S2). In addition, PCA analysis
cannot reflect the correlations of variables that explain certain biological significance. Network analysis
can demonstrate the relationship between variables. Network analysis identifies the co-occurrence
of variables based on their correlation. When setting the threshold of the Pearson correlation
coefficient at 0.7 (ρ > |0.7|), a total of 777 variables and 24,081 pairs of correlations were obtained.
The Fruchterman–Reingold algorithm can clearly distinguish the structural information of the network
without affecting the modular properties (such as density and average clustering coefficient) of the
network. Compared with the network derived from other algorithms, such as Force Atlas, OpenOrd,
Yifan Hu etc., the Fruchterman–Reingold-algorithm-based networks have better network topology
and the nodes do not overlap. Hence, the Fruchterman–Reingold algorithm was used in our network.
In the Pearson correlation-based network, we noticed that variables were clustered into six groups
(Figure 3C). By extracting the clustered compounds, we found these compounds were exclusively
detected in a certain type of liquor or their concentrations were higher than that of other types of
liquors. Volatile benzene derivatives (e.g., ethanone, 1-(4-methylphenyl)-, benzoic acid, 2-hydroxy-
ethyl ester, benzoic acid, pentyl ester, benzyl nitrile, naphthalene, 1,7-dimethyl-, 2-isobutoxyethyl
benzoate, and dibenzofuran) and aldoketones (e.g., α-campholenal, 5-methyl-2-phenyl-2-hexenal,
and 2,5-pyrrolidinedione), which were exclusively detected in brandies, were strongly linked and
clustered on the top left of the network. The top right of the network mainly contained characteristic
non-volatile benzene derivatives (e.g., homovanillyl alcohol and scopoletin) and acids (e.g., citric
acid, α-Ketoglutaric acid, and glycolic acid) found in whiskies. Benzene derivatives (e.g., indan,
1-methyl-, benzofuran, 2-methyl-, benzoic acid, 2-methylpropyl ester, and phenol,2,4-dimethyl-),
which were exclusively detected or had relative high concentration in rums, were clustered on the
down right of the network. Volatile esters and benzene derivatives (e.g., butanoic acid, 3-methyl-, butyl
ester, propanoic acid, 2-hydroxy-, 2-methylpropyl ester, octanoic acid, 3-methylbutyl ester, benzene,
ethynyl-, 1-butanone, 1-phenyl-, and phenol, 2-ethyl-6-methyl-) were mainly clustered on the left ofMetabolites 2019, 9, 2 7 of 18 the network, which were exclusively found in Chinese light aroma type liquors (C5 and C6). Esters (e.g., hexanoic acid ethyl ester, ethyl 5-methylhexanoate, nonanoic acid ethyl ester, butyl octanoate, etc.) that were exclusively detected or had relatively high concentrations in Chinese strong aroma type liquors (C3 and C4) clustered in the middle right of the network. The characteristic compounds (e.g., propanoic acid, butyl ester, pentyl 2-methylbutanoate, butyl decanoate, benzofuran, benzeneacetic acid, butyl ester, 2-furanmethanol, 2H-pyran-2-one, tetrahydro-6-methyl-,4-acetyl-3-methylpyrazole, and 2,6-diethoxytetrahydropyran), found in Chinese soy sause aroma type liquors (C1 and C2), clustered in the bottom left of the network.
Metabolites 2019, 9, 2                                                                                                    8 of 18
  Metabolites 2018, 8, x                                                                                               7 of 18

        Figure
      Figure 3. 3. Principalcomponent
                Principal    componentanalysis
                                           analysis (PCA) andandcorrelation
                                                                  correlationnetwork
                                                                               networkanalysis  ofof
                                                                                         analysis  2424
                                                                                                      distilled liquors,
                                                                                                        distilled  liquors,
        including6 6Chinese
      including       Chinese baijius
                               baijius and
                                       and 1818Western
                                                 Westernliquors.   (A)(A)
                                                            liquors.   PlotPlot
                                                                             of PCA  scores
                                                                                 of PCA     of VOCs
                                                                                          scores      detected
                                                                                                  of VOCs        by HS- by
                                                                                                              detected
        SPME-GC-TOFMS (R2X
      HS-SPME-GC-TOFMS              = 0.962,
                                 (R2X        Q2 =Q2
                                        = 0.962,    0.863).  (B) Plot
                                                      = 0.863).   (B) of PCA
                                                                      Plot  of scores of non-VOCs
                                                                                PCA scores           detected
                                                                                             of non-VOCs        by GC- by
                                                                                                              detected
        TOFMS     (R2X  = 0.902,  Q2  =  0.745). (C) Network     analysis  clustering  777 significantly
      GC-TOFMS (R2X = 0.902, Q2 = 0.745). (C) Network analysis clustering 777 significantly (FDR         (FDR    < 0.05)
                                                                                                                    < 0.05)
        correlated  compounds     into six
      correlated compounds into six groups.groups.

      InUnsupervised
         order to morePCA    is superior
                        intuitively       for observing
                                    illustrate             the similarities
                                                the conpositional           and and
                                                                    difference   differences between
                                                                                      similarity       samples.
                                                                                                 between   Chinese
   However,   PCA   inevitably  causes  data   loss  during   dimensionality    reduction.  Although
baijius and Western liquors, we constructed Venn diagrams with all the identified compounds (Figure    the  PCA 4).
Vodkas were not included because they only contained small amounts of compounds andalso
   loading plot has the potential to find variables   that contribute to  the the separation  of samples, it these
   ignores important  informations    when   there  is a large number    of variables  (Figure
compounds did not cluster in the co-occurrence networks. After extracting the common compounds S1). In addition,
   PCA analysis cannot reflect the correlations of variables that explain certain biological significance.
from each kind of distilled liquor (Figure S3), we observed that whiskies, brandies, and rums had 134
   Network analysis can demonstrate the relationship between variables. Network analysis identifies
compounds in common (Figure 4A), and Chinese baijius had 170 compounds in common (Figure 4B).
When comparing the common compounds between Western liquors and Chinese baijius, only 76
Metabolites 2019, 9, 2 9 of 18
overlapped (Figure 4C, Table S5). The compounds shared by both Western liquors and Chinese baijius
were mainly ethyl esters (e.g., acetic acid ethyl ester, propanoic acid ethyl ester, butanoic acid ethyl
ester, hexanoic acid ethyl ester, lactic acid ethyl ester, etc.), a few benzene derivatives (e.g., o-xylene
and benzaldehyde), and alcohols (e.g., 1-propanol, 2-methyl-, 1-hexanol and glycerol etc.), suggesting
the important roles of these compounds in the flavor and mouthfeel of distilled liquor. The unique
compounds in Chinese baijius were mainly esters formed by fatty alcohols such as hexanoic acid, hexyl
ester, isopentyl heptanoate, and isopentyl decanoate. Sugars, such as lactobionic acid, D-xylopyranose,
D -ribose, and D -(-)-ribofuranose, were exclusively detected Western liquors (Figure 4C). This indicates
that these2018,
Metabolites esters
8, x and sugars can be used for differentiating Chinese baijius and the Western liquors.
9 of 18
4. Venn
Figure 4. Venndiagram
diagram showing
showing thethe
similarities and and
similarities differences of chemical
differences composition
of chemical betweenbetween
composition Chinese
baijius
Chineseand Western
baijius and liquors.
WesternNumber
liquors.of unique of
Number and common
unique andcompounds in (A) Western
common compounds liquors
in (A) and
Western
(B) Chinses
liquors andbaijius, and (C)baijius,
(B) Chinses the number of unique
and (C) and common
the number compounds
of unique between
and common Western liquors
compounds and
between
Chinese baijius. The listed compounds were distinct/shared compounds in Chinese
Western liquors and Chinese baijius. The listed compounds were distinct/shared compounds in baijius and Western
liquors
Chinesewith concentrations
baijius and Western moreliquors
than 1 mg/L
with in most samples.more
concentrations Information
than 1about
mg/Lconcentrations of the
in most samples.
compounds
Informationin this figure
about can be found
concentrations in Supplementary
of the compounds inTables.
this figure can be found in Supplementary
Tables.
3. Discussion
3. Discussion
In this study, we analyzed the compositions of 24 representative distilled liquors from around
the world. In addition to detecting the VOCs via conventional HS-SPME-GC-TOFMS, we applied a
In this study, we analyzed the compositions of 24 representative distilled liquors from around
classical metabonomics approach to detect non-VOCs through derivatization, as non-VOCs are difficult
the world. In addition to detecting the VOCs via conventional HS-SPME-GC-TOFMS, we applied a
to directly analyze using GC–MS. Derivatization can increase the volatility and thermal stability of the
classical metabonomics approach to detect non-VOCs through derivatization, as non-VOCs are
analytes [24], and produce better MS properties and more favorable diagnostic fragmentation patterns
difficult to directly analyze using GC–MS. Derivatization can increase the volatility and thermal
for structure identification [25]. This methodology has been applied to study the chemical compositions
stability of the analytes [24], and produce better MS properties and more favorable diagnostic
of various food products—including fruits [26], sake [27], honey [28], and roselle [29]—and was proven
fragmentation patterns for structure identification [25]. This methodology has been applied to study
to be efficient for the detection of non-VOCs. Our results suggest that derivatization-based GC-TOFMS
the chemical compositions of various food products—including fruits [26], sake [27], honey [28], and
is highly complementary to the detection range of HS-SPME-GC-TOFMS and both methods are
roselle [29]—and was proven to be efficient for the detection of non-VOCs. Our results suggest that
indispensable for studying the complete composition of distilled liquors.
derivatization-based GC-TOFMS is highly complementary to the detection range of HS-SPME-GC-
Our results highlight that both VOCs and non-VOCs are notably different between Chinese
TOFMS and both methods are indispensable for studying the complete composition of distilled
baijius and Western liquors. These differences may be influenced by many factors including raw
liquors.
materials, production processes, microorganisms, and aging vessels (Figure 5). Raw materials can play
Our results highlight that both VOCs and non-VOCs are notably different between Chinese
baijius and Western liquors. These differences may be influenced by many factors including raw
materials, production processes, microorganisms, and aging vessels (Figure 5). Raw materials can
play direct or indirect roles. Some ingredients of raw material can be directly incorporated into
distilled liquors. For example, β-famesene and vitispirane, which were exclusively detected in the
brandies, are important aroma components of grape and these compounds are commonly detectedMetabolites 2019, 9, 2 10 of 18
direct or indirect roles. Some ingredients of raw material can be directly incorporated into distilled
liquors. For example, β-famesene and vitispirane, which were exclusively detected in the brandies,
are important aroma components of grape and these compounds are commonly detected in wine [30].
Some raw materials play indirect roles by being degraded by microorganisms. Chinese baijius are
produced from sorghum or a mixture of wheat, corn, and sorghum. These protein-rich raw materials
can produce some sulfur compounds by degrading sulfur-containing amino acids [31]. Our previous
study using metatranscriptomic analysis revealed that, during the alcoholic fermentation of Chinese
baijiu, Lactobacillus was active in the methyl cycle, which recycles methionine, which is the precursor
of the two sulfur compounds [32]. Some raw materials can also provide benzene derivatives from
the degradation of lignin, which is abundant in the hulls of these grains [31]. Benzene derivatives
may exist in soluble and bound forms in plants. Bound phenolics are formed by the combination of
soluble phenolics and cell wall macromolecules (e.g., polysaccharides and proteins) as a component
of plant cell walls [33]. It has been reported that fermentation increases the total phenolics content
(TPC). Because soluble phenolics can be released from bound phenolics during the fermentation
process [34]. This may be related to the microbe-mediated decomposition of cell wall components
and subsequent release of bound phenolics, since many microbes possess various enzymes—such as
cellulase, feruloyl esterase, glucosidase, xylanase, pectinase, and proteinases—which can degrade the
cell wall matrix [35].
Production processes and brewing microorganisms are the major factors contributing to the
compositional differences between Chinese baijius and Western liquors. The high concentration of
non-volatile acids in Chinese baijius is inseparable from the unique production process of Chinese
baijius [3]. The fermentation process of Chinese baijiu uses unique simultaneous saccharification
and fermentation (SSF). A large proportion of lactic acid bacteria (LAB) and Clostridium sp. are
involved. These strains efficiently produce lactic acid, butanoic acid, hexanoic acid, and corresponding
ethyl esters [36]. Some LAB also use L-leucine to produce 2-hydroxy-4-methyl-pentanoic acid [37],
which was exclusively detected in Chinese baijius in considerable amounts. Bacillus sp. including
B. subtilis, B. licheniformis, and B. amyloliquefaciens are involved in Daqu production and the following
stacking fermentation. Bacillus sp. are not only known as the producer of various hydrolases,
but also as efficient producers of 2,3-butanediol [38,39]. B. subtilis has been reported to produce
tetramethyl-pyrazine [40], which was exclusively detected in Chinese baijius. In contrast, Saccharomyces
cerevisiae—known to produce ethyl octanoate, ethyl decanoate, glycerol, and minor higher alcohols,
fatty acids, and aldoketones [23,41]—was the main microorganism in the production of Western liquors.
Aging vessels is another important factor. Many important flavor compounds come from the
aging vessels, such as oak lactone (also known as 2(3H)-furanone, 5-butyldihydro-4-methyl-, cis-),
vanillin, and vanillic acid. These compounds originally resided in oak barrels in which most Western
liquors were aged [42], whereas the Chinese baijius were aged in pottery jars. Hence, these compounds
can be only detected in Western liquors (Table S1 and S2). In addition, artificial factor contribute
to the compositional difference between Chinese baijius and Western liquors. Sugars, the main
non-volatile compound in Western liquors, are commonly added artificially to aged Western liquors
such as brandy [11], rum [43], and whisky [44], giving them an amber coloration that is attractive to
consumers. The artificially added sugar in distilled liquors is collectively called caramel. The chemical
composition of caramel is complex due to the large number of substances produced as a result of
pyrolysis of carbohydrates, such as sucrose, glucose, or starch. Caramel has been reported to be rich
in advanced glycation end products (AGEs). AGEs are blamed for increasing insulin resistance and
inflammation [45].and proteins) as a component of plant cell walls [33]. It has been reported that fermentation increases
the total phenolics content (TPC). Because soluble phenolics can be released from bound phenolics
during the fermentation process [34]. This may be related to the microbe-mediated decomposition of
cell wall components and subsequent release of bound phenolics, since many microbes possess
various 2019,
Metabolites enzymes—such
9, 2 as cellulase, feruloyl esterase, glucosidase, xylanase, pectinase,11 of and
18
proteinases—which can degrade the cell wall matrix [35].
Figure 5.
Figure 5. Factors that
Factors contribute
that to the
contribute to compositional difference
the compositional between
difference ChineseChinese
between baijius and Western
baijius and
liquors, and representative compounds associated with each factor. In the orange
Western liquors, and representative compounds associated with each factor. In the orange core core circle are the
major contributing factors: raw materials, production processes, microorganisms, and
circle are the major contributing factors: raw materials, production processes, microorganisms, and aging vessel.
In the vessel.
aging middle green
In thering are the
middle corresponding
green ring are theelements of the factors.
corresponding elements Theofblue
the periphery
factors. The ringblue
are
key compounds
periphery ring areinfluenced by theinfluenced
key compounds core factors. Thecore
by the model of the
factors. Theproduction
model of theprocesses
productionand
microorganisms
processes briefly describes
and microorganisms the biochemical
briefly describes theproduction
biochemicalpathways
production of apathways
few major ofcompounds.
a few major
C7, 8 and10 represents R contains C7, C8, and C10 linear chain length, respectively;
compounds. C7, 8 and10 represents R contains C7, C8, and C10 linear chain length, respectively; C2–C6 represent
C2–C6
R containing
represent C2–C6 C2–C6
R containing linear linear
chain chain
length, respectively.
length, SSF:
respectively. simultaneous
SSF: simultaneoussaccharification
saccharification and
2H4MPA: 2-hydroxy-4-methyl-pentanoic
fermentation; 2H4MPA: 2-hydroxy-4-methyl-pentanoic acid; 2M1, 3PDO: 2-methyl-1,3-propanediol;
TMP: tetramethyl-pyrazine.
TMP: tetramethyl-pyrazine. Information about concentration of the compounds in this figure can can be
be
Supplementary Materials.
found in Supplementary Materials.
However,
Productionmany bioactive
processes andcompounds including aldoketone,
brewing microorganisms are thepyrazine, alcohols,
major factors fatty acids,
contributing to and
the
ethyl esters were
compositional observedbetween
differences in distilled liquor
Chinese [46] and Western
baijius most of them were
liquors. Thedetected in this study.
high concentration of
Additionally, many of the detected benzene derivatives—such as benzofuran, benzoic acid ethyl ester,
benzene acetic acid ethyl ester, benzene propanoic acid ethyl ester, and phenylethyl alcohol—are
known to be bioactive. An in vitro study reported that a honey that was abundant with these
benzene derivatives exhibited effective antibacterial activity, especially for Gram-negative bacteria [28].
The progress of alcoholic liver disease has shown that alcohol administration can cause overgrowth
of intestinal Gram-negative bacteria and increase the burden in the intestine, leading to leaky gut.Metabolites 2019, 9, 2 12 of 18
Lipopolysaccharide (LPS), a critical component of the outer membrane of Gram-negative bacteria,
then translocates from the gut lumen to the liver and leads to alcoholic hepatitis [47]. Benzene
derivatives in distilled liquors may be able to play a role in mitigating the enteric dysbiosis caused by
ethanol. Moreover, many heterocyclic compounds, such as furans, pyrroles, thiophenes, and thiazoles,
that have been detected in Chinese liquors by using more advanced comprehensive two-dimensional
GC with time-of-flight mass spectrometry (GC × GC-TOFMS) [46,48] are bioactive as well. Heterocyclic
compounds widely exist in coffee and have certain levels of antioxidative activity [49]. In vivo, ethanol
is mainly metabolized by alcohol dehydrogenase into acetaldehyde, which is responsible for the
generation of reactive oxygen species (ROS). ROS can cause oxidative stress and further lead to liver
injury [50]. Although this activity is not as strong as that of the synthetic antioxidant butylated
hydroxytoluene (BHT), the combined activity of large numbers of these heterocyclic compounds might
be comparable to those of known antioxidants [49]. Therefore, the heterocyclic compounds in distilled
liquor may mitigate oxidative damage caused by ethanol. Further research could design animal models
to understand whether the presumed bioactive compounds in distilled liquor really play specific roles
by exploration of gut microbiota and host metabolism.
4. Conclusions
We analyzed the complete chemical compositions of 24 representative distilled liquors from
around the world using GC–MS-based metabolomics approaches. The compositional differences and
similarities between Chinese baijius and Western liquors were revealed by multivariate statistics and
correlation network analysis. Many esters, benzene derivatives, and alcohols were shared by most of
the tested distilled liquors, suggesting their important contribution to the common flavor of distilled
liquors. Certain sugars and esters formed by fatty alcoholare potential indicators that can be used
for differentiating Chinese baijius and Western liquors. Factors including raw materials, production
processes, microorganisms, and aging vessels could all contribute to the differences between Chinese
baijius and Western liquors. To the best of our knowledge, this is the first study that comprehensively
analyzed both VOCs and non-VOCs in distilled liquors and systematically compared the compositional
differences and similarities between typical Chinese baijius and Western liquors. This study provides
a new perspective for analyzing the chemical composition of distilled liquors and improves our
molecular understanding of this plant-based fermented product.
5. Materials and Methods
5.1. Reagents
n-hexane was purchased from Merck (Darmstadt, Germany). Anhydrous sodium sulphate
was analytical grade and obtained from the China National Pharmaceutical Group Corporation
(Shanghai, China). N,O-bis-(trimethylsilyl)-trifluoroacetamide with 1% trimethylchlorosilane (BSTFA
+ 1% TMCS) used for derivatization was purchased from Thermo Scientific (Bellefonte, PA, USA).
Pyridine, methoxyamine hydrochloride, n-alkanes of C4–C30, and fatty acid methyl esters (FAME
markers) of C8, C9, C10, C12, C14, C16, C18, C20, C22, C24, C26, C28, and C30 linear chain lengths
were purchased from Sigma-Aldrich (St. Louis, MO, USA). L-menthol and L-2-chlorophenylalanine
(Sigma-Aldrich, Shanghai, China) were used as internal standards.
5.2. Distilled Liquors
A total of 24 distilled liquors were used in this study including 6 Chinese baijius and 18 Western
liquors (Table 1). Distilled liquors were purchased from the local market or spplied by distilleries.Metabolites 2019, 9, 2 13 of 18
Table 1. Distilled liquors used in this study
Type of Distillate Abbreviation Place of Origin Raw Material
Soy sauce aroma type liquor C1 Guizhou, China Sorghum, wheat
Soy sauce aroma type liquor C2 Guizhou, China Sorghum, wheat
Strong aroma type liquor C3 Sichuan, China Sorghum, wheat, corn
Chinese baijius
Strong aroma type liquor C4 Anhui, China Sorghum, wheat, corn
Light aroma type liquor C5 Shanxi, China Sorghum, barley, pea
Light aroma type liquor C6 Beijing, China Sorghum, barley, pea
Whisky W1 Kentucky, America Barley malt, corn, caramel
Whisky W2 Speyside, Scotland Barley malt, caramel
Whisky W3 Ireland Barley malt, corn, caramel
Whisky W4 Scotland Barley malt, corn, caramel
Whisky W5 Scotland Barley malt, caramel
Brandy B1 France Grape, caramel
Brandy B2 France Grape, caramel
Brandy B3 France Grape, caramel
Brandy B4 France Grape, caramel
Western liquors
Brandy B5 France Grape, caramel
Rum R1 Puerto Rico Sugar cane, caramel
Rum R2 U.S. Sugar cane, caramel
Rum R3 France Sugar cane, caramel
Rum R4 Cuba Sugar cane, caramel
Vodka V1 Britain Wheat, barley malt
Vodka V2 Sweden Wheat
Vodka V3 France Wheat
Vodka V4 Poland Wheat, potato
5.3. Sample Preparation
5.3.1. VOC Extraction
The sample preparation and HS-SPME technique were performed according to the methods
described previously with minor changes [51]. Each liquor sample was diluted with deionized water
to a final concentration of 10% (v/v) ethanol. A total of 10 mL diluted solution saturated with
sodium chloride was placed into a 20 mL screw-capped vial, and spiked with 10 µL internal standard
L-menthol to a final concentration of 15.625 mg/L. Then, the vial was tightly capped with a silicon
septum. This sample was equilibrated at 50 ◦ C in a thermostatic water bath for 15 min prior to
analysis. After equilibration, a 2 cm fiber coated with 50/30 µm divinylbenzene (DVB)/carboxen
(CAR)/polydimethylsiloxane (PDMS; Supelco, Bellefonte, PA, USA) was exposed to the headspace of
the vial for 30 min at the same temperature. The fiber was then inserted into the injection port of GC
(250 ◦ C) for 5 min to desorb the analytes. Each sample was analyzed in triplicate.
5.3.2. Extraction, Oximation, and Derivatization of Non-VOCs
Three milliliters of each distilled liquor were spiked with 10 µL internal standard
L-2-chlorophenylalanine to a final concentration of 16.3 mg/L and vortexed for 10 s, and then extracted
with equal volumes of n-hexane thrice. After extraction, 1 mL of the aqueous phase was collected into
GC–MS vials and then freeze-dried in a vacuum centrifuge. The dried residue was then resuspended
in 50 µL of methoxyamine in pyridine (15 mg/mL) and incubated in a vortex mixer (Fisher Scientific,
Springfield, NJ, USA) for 90 min at 30 ◦ C. The resulting solution was derivatized with 50 µL BSTFA
spiked with FAME at 70 ◦ C for 60 min. Each sample was analyzed in triplicate. Replication of each
distillate in this study included different bottles from the same vendor.
5.4. Metabolomics Analyses
Both VOC and non-VOC detection was performed on an Agilent 7890B (Santa Clara, CA, USA) gas
chromatograph equipped with a Pegasus HT time-of-flight (TOF) mass spectrometer (Leco Corporation,
St. Joseph, MI, USA).Metabolites 2019, 9, 2 14 of 18
For the detection of VOCs, samples were analyzed on a DB-FFAP column (60 m × 0.25 mm
i.d., 0.25 µm film thickness, Agilent JandW Scientific, Folsom, CA, USA). The detector and injector
temperature was 250 ◦ C. The oven temperature was held at 45 ◦ C for 3 min, and then raised to 150 ◦ C
at a rate of 4 ◦ C per min, and held for 2 min, then raised to 200 ◦ C at a rate of 6 ◦ C per min, then raised
to 230 ◦ C in 10 min, and held for a final 15 min. The column carrier gas was helium at a constant flow
rate of 1 mL/min. Splitless injection mode was used. The temperature of the ion source was 230 ◦ C,
and the electron impact mass spectra were recorded at 70 eV ionization energy. The GC–MS analysis
was carried out in the scanning mode (SCAN) in the 35–400 aµ mass range, and the acquisition rate
was 100 spectrum/s in the TOFMS setting.
For the detection of non-VOCs, each 1-µL aliquot of the derivatized solution was injected in split
mode (split ratio 1:10). Separation was achieved on a DB-5 ms capillary column (30 m × 250 µm
i.d., 0.25 µm film thickness, Agilent JandW Scientific, Folsom, CA, USA). Helium was used as the
carrier gas at a constant flow rate of 1.0 mL/min. The temperatures of injection, transfer interface,
and ion source were set to 250, 250, and 230 ◦ C, respectively. The GC temperature programming was
set to 2 min of isothermal heating at 50 ◦ C, followed by 6 ◦ C/min oven temperature ramps to 230 ◦ C,
and a final 15 min maintenance at 230 ◦ C. MS measurements were recorded with electron impact
ionization (70 eV) in full-scan mode (m/z 30–600), and the acquisition rate was 20 spectrum/second in
the TOFMS setting.
To ensure the stability of the system over the different sequences and provide confidence in our
data, we completed the following. Before testing, a tuning solution was used to ensure the stability
of the fragment ion. During testing, we ensured the stability of chromatography and column by
monitoring the retention index of n-alkane or fatty acid methyl ester. We also extracted the intensity of
methyl tridecanoate and evaluated its intensity range (usually ranged from 80% to 120% of average
intensity). In addition, a mixture solution with all the sample extracts was used as quality control
(QC) samples. QC samples were injected (after a blank) every nine samples in the batch. The samples
were measured alternately, such as “C1–R1–W1 . . . ”, to minimize or eliminate systematic analytical
deviations. All samples were analyzed in triplicate and the results were averaged. To ensure the
stability and the repeatability of the equipment, we performed PCA using all the sample data along
with the QCs (Figure S4).
5.5. GC–MS Data Pretreatment, Compound Identification, and Quantification
The operation procedures for GC–MS data pretreatment were developed by our laboratory [52].
The acquired MS files from GC-TOFMS analysis were exported in NetCDF format by ChromaTOF
software (v3.30, Leco Co., CA, USA). CDF files were extracted using custom scripts (revised MATLAB
toolbox hierarchical multivariate curve resolution (HMCR), developed by Par Jonsson, et al. [53]) in
MATLAB 7.0 (The MathWorks, Inc., MA, USA) for data pretreatment procedures such as baseline
correction, de-noising, smoothing, alignment, time-window splitting, and multivariate curve resolution
(based on the multivariate curve resolution algorithm). The optimized parameters were as follows:
signal-to-noise (S/N) = 30, baseline offset = 0.5, and peak width = 2. The resulting three-dimensional
dataset included sample information, peak retention time, and peak intensities. Retention index (RI)
calibration and mass spectral deconvolution were performed with ChromaTOF™ software (v3.30,
Leco Co., CA, USA). Commercial mass spectral databases such as Wiley 9, mainlib, and replib were
fully integrated with the ChromaTOF™ deconvolution software and were chosen for mass spectral
comparison. The selected VOCs and non-VOCs were positively identified by comparing their mass
spectral data and RI values with those of authentic standard compounds. The RIs of VOCs were
calculated using n-alkanes C4–C30 as external references. The RIs of non-VOCs were calculated using
the FAME of C8, C9, C10, C12, C14, C16, C18, C20, C22, C24, C26, C28, and C30 linear chain lengths [54].
Mass spectral matching was manually supervised and matches were accepted with thresholds of
match >800 (with maximum match equal to 1000) and reconfirmed by RI values (± 25) when available.
All identified compounds met level 2 or above of the metabolite identification set by the ChemicalMetabolites 2019, 9, 2 15 of 18
Analysis Working Group (CAWG) Metabolomics Standards Initiative (MSI) [55]. Compounds were
quantified using the method proposed and validated by Gao et al. [56].
5.6. Statistical Analysis
The data matrices were introduced into SIMCA-P+ 13.0 (Umetrics, Umeå, Sweden) software
for PCA. Prior to PCA, all variables obtained were mean-centered and scaled to the pareto variance.
PCA is an unsupervised technique that reduces the dimensionality of the original data matrix while
retaining the maximum amount of variability. Therefore, PCA can explain the differences between
distilled liquors by means of factors obtained from the datasets and, simultaneously, determine which
variables contribute most to such differences. Correlative network was visualized with Gephi (Version
0.9.1; available at: https://gephi.org) [57] using the classic Fruchterman–Reingold algorithm. Before
plotting in a correlative network, pairwise Pearson’s correlations between variables were computed
using SPSS Version 22 (SPSS Inc., Chicago, IL, USA) and the significant correlations (FDR < 0.05) were
retained. The FDR value was calculated by R (Version 3.2.2) with the fdrtool package.
Supplementary Materials: The following are available online at http://www.mdpi.com/2218-1989/9/1/2/s1,
Table S1: Volatile compounds and their relative concentration (%) in 24 distilled liquors detected by
HS-SPME-GC-TOFMS, Table S2: Representative VOCs and their concentration (mg/L) in distilled liquors
mentioned in the main text, Table S3: Non-volatile compounds and their relative concentration (%) in 24 distilled
liquors detected by GC-TOFMS, Table S4: Representative Non-VOCs and their concentration (mg/L) in distilled
liquors mentioned in the main text, Table S5: Compounds involved in Figure 4, Figure S1: Heatmap showing the
clustering of the samples, Figure S2: PCA loadings of the (A) VOCs and (B) non-VOCs, Figure S3: Venn diagrams
extract the common compounds from each kind of distilled liquor, Figure S4: The PCA plot of QCs and samples
demonstrate the stability and the repeatability of the equipment.
Author Contributions: Conceptualization, W.J. and Y.X.; Data curation, C.F.; Funding acquisition, Y.X.;
Investigation, H.D.; Project administration, W.J.; Supervision, H.D., W.J., and Y.X.; Visualization, C.F.;
Writing—original draft, C.F.; Writing—review and editing, W.J. and Y.X.
Funding: This work was supported by the National Natural Science Foundation of China (NSFC) (grants 31530055,
31501469, and 21506074), the Natural Science Foundation of Jiangsu Province of China (grant BK20150143), the
National Key RandD R&D Program (no. 2016YFD0400503) and the Postgraduate Research and Practice Innovation
Program of Jiangsu Province (grant KYCX17_1418).
Acknowledgments: We would like to thank Xiaojiao Zheng and Aihua Zhao from Shanghai Jiao Tong University
Affiliated Sixth People’s Hospital for their technical assistance. They helped perform the formal analysis and
provided software support. Special thanks also to the Institute for Chinese Soy Sauce Aroma Type Liquor, Beijing
Advanced Innovation Center for Food Nutrition and Human Health and Chinese Liquor Industrial Technology
Innovation Strategic Alliance for their financial support.
Conflicts of Interest: The authors declare no conflict of interest.
References
1. Lapsley, J. History of the hard stuff. Nature 2009, 461, 1213–1214. [CrossRef]
2. Kew, W.; Goodall, I.; Clarke, D.; Uhrin, D. Chemical Diversity and Complexity of Scotch Whisky as Revealed
by High-Resolution Mass Spectrometry. J. Am. Soc. Mass Spectrom. 2017, 28, 200–213. [CrossRef] [PubMed]
3. Jin, G.Y.; Zhu, Y.; Xu, Y. Mystery behind Chinese liquor fermentation. Trends Food Sci. Technol. 2017, 63, 18–28.
[CrossRef]
4. Madrera, R.R.; Gomis, D.B.; Alonso, J.J. Influence of distillation system, oak wood type, and aging time on
volatile compounds of cider brandy. J. Agric. Food Chem. 2003, 51, 5709–5714. [CrossRef] [PubMed]
5. Pino, J.A. Characterization of rum using solid-phase microextraction with gas chromatography-mass
spectrometry. Food Chem. 2007, 104, 421–428. [CrossRef]
6. Camara, J.S.; Marques, J.C.; Perestrelo, R.M.; Rodrigues, F.; Oliveira, L.; Andrade, P.; Caldeira, M.
Comparative study of the whisky aroma profile based on headspace solid phase microextraction using
different fibre coatings. J. Chromatogr. A 2007, 1150, 198–207. [CrossRef] [PubMed]
7. Jelen, H.H.; Ziolkowska, A.; Kaczmarek, A. Identification of the botanical origin of raw spirits produced from
rye, potato, and corn based on volatile compounds analysis using a SPME-MS method. J. Agric. Food Chem.
2010, 58, 12585–12591. [CrossRef] [PubMed]Metabolites 2019, 9, 2 16 of 18
8. Fan, W.; Qian, M.C. Headspace solid phase microextraction and gas chromatography-olfactometry dilution
analysis of young and aged Chinese “Yanghe Daqu” liquors. J. Agric. Food Chem. 2005, 53, 7931–7938.
[CrossRef]
9. Zhang, R.; Wu, Q.; Xu, Y.; Qian, M.C. Isolation, identification, and quantification of lichenysin, a novel
nonvolatile compound in Chinese distilled spirits. J. Food Sci. 2014, 79, C1907–C1915. [CrossRef]
10. Zhang, R.; Wu, Q.; Xu, Y. Lichenysin, a cyclooctapeptide occurring in Chinese liquor jiannanchun reduced
the headspace concentration of phenolic off-flavors via hydrogen-bond interactions. J. Agric. Food Chem.
2014, 62, 8302–8307. [CrossRef]
11. Tsakiris, A.; Kallithraka, S.; Kourkoutas, Y. Grape brandy production, composition and sensory evaluation.
J. Sci. Food Agric. 2014, 94, 404–414. [CrossRef] [PubMed]
12. Fiehn, O. Metabolomics-the link between genotypes and phenotypes. In Functional Genomics; Town, C., Ed.;
Springer: Dordrecht, The Netherlands, 2002; pp. 155–171.
13. Bhalla, R.; Narasimhan, K.; Swarup, S. Metabolomics and its role in understanding cellular responses in
plants. Plant Cell Rep. 2005, 24, 562–571. [CrossRef]
14. Hu, C.X.; Xu, G.W. Mass-spectrometry-based metabolomics analysis for foodomics. TrAC-Trends Anal. Chem.
2013, 52, 36–46. [CrossRef]
15. Wishart, D.S. Metabolomics: Applications to food science and nutrition research. Trends Food Sci. Technol.
2008, 19, 482–493. [CrossRef]
16. Herrero, M.; Simo, C.; Garcia-Canas, V.; Ibanez, E.; Cifuentes, A. Foodomics: MS-based strategies in modern
food science and nutrition. Mass Spectrom. Rev. 2012, 31, 49–69. [CrossRef] [PubMed]
17. Du, H.; Fan, W.L.; Xu, Y. Characterization of Geosmin as Source of Earthy Odor in Different Aroma Type
Chinese Liquors. J. Agric. Food Chem. 2011, 59, 8331–8337. [CrossRef]
18. Du, H.; Xu, Y. Determination of the Microbial Origin of Geosmin in Chinese Liquor. J. Agric. Food Chem.
2012, 60, 2288–2292. [CrossRef] [PubMed]
19. Du, H.; Lu, H.; Xu, Y.; Du, X.W. Community of Environmental Streptomyces Related to Geosmin
Development in Chinese Liquors. J. Agric. Food Chem. 2013, 61, 1343–1348. [CrossRef]
20. Du, H.; Lu, H.; Xu, Y. Influence of Geosmin-Producing Streptomyces on the Growth and Volatile Metabolites
of Yeasts during Chinese Liquor Fermentation. J. Agric. Food Chem. 2015, 63, 290–296. [CrossRef] [PubMed]
21. Xu, M.L.; Yu, Y.; Ramaswamy, H.S.; Zhu, S.M. Characterization of Chinese liquor aroma components
during aging process and liquor age discrimination using gas chromatography combined with multivariable
statistics. Sci. Rep. 2017, 7, 39671. [CrossRef]
22. Zhu, S.M.; Xu, M.L.; Ramaswamy, H.S.; Yang, M.Y.; Yu, Y. Effect of high pressure treatment on the aging
characteristics of Chinese liquor as evaluated by electronic nose and chemical analysis. Sci. Rep. 2016,
6, 30273. [CrossRef] [PubMed]
23. Walker, G.M.; Hill, A.E. Saccharomyces cerevisiae in the production of whisk (e) y. Beverages 2016, 2, 38.
[CrossRef]
24. Vinas, P.; Martinez-Castillo, N.; Campillo, N.; Hernandez-Cordoba, M. Directly suspended droplet
microextraction with in injection-port derivatization coupled to gas chromatography-mass spectrometry
for the analysis of polyphenols in herbal infusions, fruits and functional foods. J. Chromatogr. A 2011,
1218, 639–646. [CrossRef] [PubMed]
25. Farajzadeh, M.A.; Nouri, N.; Khorram, P. Derivatization and microextraction methods for determination of
organic compounds by gas chromatography. TrAC-Trends Anal. Chem. 2014, 55, 14–23. [CrossRef]
26. Khakimov, B.; Mongi, R.J.; Sorensen, K.M.; Ndabikunze, B.K.; Chove, B.E.; Engelsen, S.B. A comprehensive
and comparative GC-MS metabolomics study of non-volatiles in Tanzanian grown mango, pineapple,
jackfruit, baobab and tamarind fruits. Food Chem. 2016, 213, 691–699. [CrossRef]
27. Mimura, N.; Isogai, A.; Iwashita, K.; Bamba, T.; Fukusaki, E. Gas chromatography/mass spectrometry based
component profiling and quality prediction for Japanese sake. J. Biosci. Bioeng. 2014, 118, 406–414. [CrossRef]
[PubMed]
28. Acevedo, F.; Torres, P.; Oomah, B.D.; de Alencar, S.M.; Massarioli, A.P.; Martin-Venegas, R.; Albarral-Avila, V.;
Burgos-Diaz, C.; Ferrer, R.; Rubilar, M. Volatile and non-volatile/semi-volatile compounds and in vitro
bioactive properties of Chilean Ulmo (Eucryphia cordifolia Cav.) honey. Food Res. Int. 2017, 94, 20–28.
[CrossRef]You can also read


