Combination Treatment of OSI-906 with Aurora B Inhibitor Reduces Cell Viability via Cyclin B1 Degradation-Induced Mitotic Slippage - MDPI
←
→
Page content transcription
If your browser does not render page correctly, please read the page content below
International Journal of
               Molecular Sciences

Article
Combination Treatment of OSI-906 with Aurora B Inhibitor
Reduces Cell Viability via Cyclin B1 Degradation-Induced
Mitotic Slippage
Yuki Ikeda, Ryuji Yasutake, Ryuzaburo Yuki                      , Youhei Saito       and Yuji Nakayama *

                                          Department of Biochemistry & Molecular Biology, Kyoto Pharmaceutical University, Kyoto 607-8414, Japan;
                                          kd21001@ms.kyoto-phu.ac.jp (Y.I.); kd21008@ms.kyoto-phu.ac.jp (R.Y.); yuki2019@mb.kyoto-phu.ac.jp (R.Y.);
                                          ysaito@mb.kyoto-phu.ac.jp (Y.S.)
                                          * Correspondence: nakayama@mb.kyoto-phu.ac.jp; Tel.: +81-75-595-4653; Fax: +81-75-595-4758

                                          Abstract: Insulin-like growth factor 1 receptor (IGF1R), a receptor-type tyrosine kinase, transduces
                                          signals related to cell proliferation, survival, and differentiation. We recently reported that OSI-
                                          906, an IGF1R inhibitor, in combination with the Aurora B inhibitor ZM447439 suppresses cell
                                          proliferation. However, the mechanism underlying this suppressive effect is yet to be elucidated.
                                          In this study, we examined the effects of combination treatment with OSI-906 and ZM447439 on
                                          cell division, so as to understand how cell proliferation was suppressed. Morphological analysis
                                          showed that the combination treatment generated enlarged cells with aberrant nuclei, whereas
                                neither OSI-906 nor ZM447439 treatment alone caused this morphological change. Flow cytometry

                                          analysis indicated that over-replicated cells were generated by the combination treatment, but not by
Citation: Ikeda, Y.; Yasutake, R.;
                                          the lone treatment with either inhibitors. Time-lapse imaging showed mitotic slippage following a
Yuki, R.; Saito, Y.; Nakayama, Y.
                                          severe delay in chromosome alignment and cytokinesis failure with furrow regression. Furthermore,
Combination Treatment of OSI-906
                                          in S-trityl-L-cysteine–treated cells, cyclin B1 was precociously degraded. These results suggest
with Aurora B Inhibitor Reduces Cell
Viability via Cyclin B1
                                          that the combination treatment caused severe defect in the chromosome alignment and spindle
Degradation-Induced Mitotic               assembly checkpoint, which resulted in the generation of over-replicated cells. The generation of
Slippage. Int. J. Mol. Sci. 2021, 22,     over-replicated cells with massive aneuploidy may be the cause of reduction of cell viability and cell
5706. https://doi.org/                    death. This study provides new possibilities of cancer chemotherapy.
10.3390/ijms22115706
                                          Keywords: linsitinib; OSI-906; ZM447439; IGF1R; Aurora B; M phase; RO-3306
Academic Editor: Athanasios
G. Papavassiliou

Received: 30 March 2021                   1. Introduction
Accepted: 25 May 2021
                                               Insulin-like growth factor 1 (IGF1) receptor (IGF1R), a receptor-type tyrosine ki-
Published: 27 May 2021
                                          nase [1], is generated by cleavage of its precursors. IGF1R is composed of two α and
                                          two β subunits. When bound with IGF1, the kinase activity of IGF1R is activated to
Publisher’s Note: MDPI stays neutral
                                          trigger the signaling pathways for cell proliferation, differentiation, and survival. The
with regard to jurisdictional claims in
published maps and institutional affil-
                                          auto-phosphorylated tyrosine residues serve as a docking site for insulin receptor substrate
iations.
                                          1 and Shc and trigger downstream signaling, including Raf/mitogen-activated protein
                                          kinase (MEK)/extracellular signal-regulated kinase pathways and phosphatidylinositol
                                          3-kinase (PI3K)/AKT. It has been reported that IGF1R expression levels correlate with
                                          progression of cancer and metastatic phenotypes [2–8]. This is supported by the fact that in-
                                          creases in plasma IGF1 levels are associated with cancer risk [9–12]. Recently, we reported
Copyright: © 2021 by the authors.
                                          an abnormal cell division upon inhibition of receptor-type tyrosine kinases, including
Licensee MDPI, Basel, Switzerland.
                                          EphA2 [13], ALK [14], VEGF receptor [15], and IGF1R [16].
This article is an open access article
                                               Cell division is among the most complicated cellular processes, in which replicated
distributed under the terms and
conditions of the Creative Commons
                                          chromosomes are divided into two daughter cells. Ser/Thr kinases, such as cyclin depen-
Attribution (CC BY) license (https://
                                          dent kinase 1 (CDK1), Aurora kinases, and Polo-like kinase, orchestrate various events to
creativecommons.org/licenses/by/          promote this process [17]. At the onset of cell division, DNA is condensed into compact
4.0/).                                    chromosomes. The nuclear envelope breakdown permits microtubules to approach chromo-

Int. J. Mol. Sci. 2021, 22, 5706. https://doi.org/10.3390/ijms22115706                                         https://www.mdpi.com/journal/ijms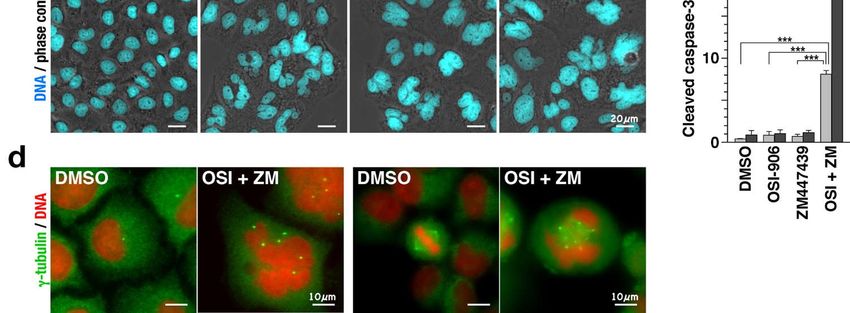
Int. J. Mol. Sci. 2021, 22, 5706                                                                                           2 of 16

                                   some’s kinetochore. Powered by motor proteins and polymerization and depolymerization
                                   of microtubules, chromosomes converge at the cell equator and align at the metaphase
                                   plate. Incorrect attachment of microtubules stimulates the spindle assembly checkpoint
                                   (SAC) to prevent the onset of anaphase. Upon satisfaction of SAC, cohesin maintaining
                                   sister chromatid cohesion degrades and sister chromatids segregate to opposite poles.
                                   The spindle midzone forms between the segregating chromosomes and the proteins that
                                   regulate cytokinesis localize there. Chromosomes are decondensed at the poles and the
                                   nuclear envelope reassembles. Finally, the cytoplasm splits into two daughter cells.
                                        Anti-mitotic agents have been commonly used for chemotherapy against a wide range
                                   of cancers. Disruption of microtubule dynamics is an effective way to interrupt progression
                                   of cell division. Taxanes and vinca alkaloids are traditional anti-mitotic agents. Taxanes
                                   are known to stabilize microtubules. Conversely, vinca alkaloids depolymerize them at
                                   higher concentrations and inhibit microtubule dynamics at lower concentrations. They
                                   have been successfully used in clinical. However, side effects and drug resistance limit the
                                   usefulness of these anti-mitotic drugs, which has led to the development of new generation
                                   of microtubule poisons as well as agents targeting mitotic kinases and microtubule motor
                                   proteins. Thus, combination therapy of anti-mitotic drugs with compounds targeting
                                   cancer-specific alterations must be useful to reduce the side effects. Recently, we reported
                                   that targeting IGF1R combined with Aurora B inhibition suppresses cell proliferation
                                   more than single treatment [16]. However, the molecular mechanisms underlying the
                                   suppressive effect of this combination on cell proliferation is yet to be elucidated.
                                        In this study, we investigated the mechanisms underlying the suppression of the cell
                                   proliferation. Cell cycle synchronization experiments and time-lapse imaging revealed that
                                   combination treatment of OSI-906 and ZM447439 caused severe defect in the chromosome
                                   alignment and SAC function. The resulting generation of over-replicated cells with massive
                                   aneuploidy may be responsible for the effects of the combination of OSI-906 and ZM447439
                                   on cell proliferation.

                                   2. Results
                                   2.1. Combination of OSI-906 and ZM447439 Causes Cell Death via Generation of Enlarged Cells
                                   with Aberrant-Shaped Nuclei
                                         A retrospective analysis of patients with cervical cancer showed that IGF1/IGF1R
                                   signaling is involved in tumor formation and clinical outcome [8]. We previously reported
                                   that although 3 µM OSI-906 suppressed 48% of cell proliferation, combination with 1 µM
                                   ZM447439, which caused almost no suppressive effect, suppressed 74% of cell proliferation
                                   of cervical cancer HeLa S3 cells [16]. However, the precise mechanism behind this effect is
                                   yet to be elucidated. Therefore, we first examined cell morphology during the combination
                                   treatment. Immunofluorescence staining after 3-day treatment revealed that the combination
                                   treatment of cells with OSI-906 and ZM447439 generated enlarged cells with aberrant-shaped
                                   nuclei (Figure 1a). The nuclei were much larger than the cells treated with either OSI-906
                                   or ZM447439 (Figure 1a). Furthermore, the cleaved caspase-3–positive cells were observed
                                   in the cells treated by inhibitors and the number of cleaved caspase-3–positive cells were
                                   significantly increased upon the combination treatment (Figure 1a,b). Considering that
                                   the number of cells after 72 h of combination treatment was less than that of seeded cells
                                   (Figure 7B in [16]), these results suggest an involvement of cell death in suppression of cell
                                   proliferation. It is worthy to note that the cleaved caspase-3–positive cells generated by
                                   the combination treatment appear to be larger than those obtained by either OSI-906 or
                                   ZM447439 treatment (Figure 1a). The nuclear size increased with time and their morphology
                                   was complex and highly variable (Figure 1c). The number of γ-tubulin foci showed marked
                                   differences between control and the combination-treated cells. In the combination-treated
                                   cells, enlarged cells with large and aberrant-shaped nuclei exhibited an increased number
                                   of centrosomes (Figure 1d, left). In addition, multipolar spindle was found in M phase
                                   upon the combination treatment, whereas bipolar spindle was observed in solvent control
                                   cells (Figure 1d, right). Taken together, these results suggest that combination treatment
Int. J. Mol. Sci. 2021, 22, x FOR PEER REVIEW                                                                                                        3 of 17

Int. J. Mol. Sci. 2021, 22, 5706                                                                                                                      3 of 16
                                     shaped nuclei exhibited an increased number of centrosomes (Figure 1d, left). In addition,
                                     multipolar spindle was found in M phase upon the combination treatment, whereas bipo-
                                     lar spindle was observed in solvent control cells (Figure 1d, right). Taken together, these
                                     results suggest
                                      may induce   cellthat combination
                                                        death            treatment
                                                              via generation        may cells
                                                                             of enlarged  induce cell
                                                                                              with    death via generation
                                                                                                    aberrant-shaped         of en-
                                                                                                                    nuclei and  via
                                     larged  cells
                                      increase     withnumber
                                               in the   aberrant-shaped   nuclei and via increase in the number of centrosomes.
                                                               of centrosomes.

     Figure 1. Combination of OSI-906 and ZM447439 generates enlarged cells with aberrant-shaped nuclei. HeLa S3 cells were
      Figure 1. Combination of OSI-906 and ZM447439 generates enlarged cells with aberrant-shaped nuclei. HeLa S3 cells
     treated with 3 µM OSI-906, 1 µM ZM447439, or their combination for 3 days. The cells were fixed with methanol for 5 min
      were treated with 3 µM OSI-906, 1 µM ZM447439, or their combination for 3 days. The cells were fixed with methanol for
     at −30 °C (a,c,d) or 4% formaldehyde for 20 min at room temperature (b). (a) The fixed cells (Day3) were stained for cleaved
     caspase-3     30 ◦ Cand
      5 min at −(red)     (a,c,d)
                              DNA  or (cyan).
                                      4% formaldehyde      for 20
                                               Representative      min atofroom
                                                                images        cells temperature
                                                                                     treated with (b).    (a) The
                                                                                                     OSI-906,     fixed cellsor(Day3)
                                                                                                                ZM447439,                 were stained
                                                                                                                                  their combination
      for cleaved    caspase-3   (red)  and   DNA   (cyan).   Representative     images     of cells  treated  with  OSI-906,
     (OSI + ZM) are shown. Dimethyl sulfoxide (DMSO) was used as solvent control. Yellow arrows indicate cleaved caspase-       ZM447439,      or their
      combination     (OSI   + ZM)   are  shown.   Dimethyl    sulfoxide   (DMSO)       was  used    as  solvent control.   Yellow
     3–positive cells. Scale bar, 20 µm. (b) On day 1 and day 2, the cells were fixed and stained for cleaved caspase-3 and DNA.      arrows  indicate
     The  number
      cleaved        of cleaved caspase-3–positive
               caspase-3–positive       cells. Scale bar,cells were(b)
                                                          20 µm.     counted
                                                                        On dayand 1 andplotted  as the
                                                                                           day 2,   the cells
                                                                                                          meanwere
                                                                                                                ± SDfixed
                                                                                                                      calculated    from three
                                                                                                                            and stained          inde-
                                                                                                                                           for cleaved
     pendent   experiments     (n  > 201). p-values  were   calculated   using   Tukey’s    multiple    comparison    test (Day1)
      caspase-3 and DNA. The number of cleaved caspase-3–positive cells were counted and plotted as the mean ± SD calculated        and   the Games–
     Howell   multiple
      from three          comparison
                   independent           test (Day2).
                                   experiments         * p < p-values
                                                 (n > 201).  0.05; *** pwere
                                                                         < 0.001.   (c) Theusing
                                                                              calculated     fixedTukey’s
                                                                                                     cells were  stained
                                                                                                             multiple      for DNA test
                                                                                                                        comparison     (cyan). Repre-
                                                                                                                                            (Day1) and
     sentative  images    of cells treated  with  the combination     (OSI  +  ZM)    for 1–3  days  are  shown.   Scale  bar, 20
      the Games–Howell multiple comparison test (Day2). * p < 0.05; *** p < 0.001. (c) The fixed cells were stained for DNA (cyan).µm.   (d) The fixed
     cells (Day3) were stained for γ-tubulin (green) and DNA (red). Representative images of γ-tubulin in interphase (left) and
      Representative images of cells treated with the combination (OSI + ZM) for 1–3 days are shown. Scale bar, 20 µm. (d) The
     M phase cells (right) treated with the combination (OSI + ZM) are shown. Scale bar, 10 µm.
      fixed cells (Day3) were stained for γ-tubulin (green) and DNA (red). Representative images of γ-tubulin in interphase (left)
      and M phase cells (right) treated with the combination (OSI + ZM) are shown. Scale bar, 10 µm.
                                     2.2. Combination of OSI-906 and ZM447439 Generates over-Replicated Cells
                                           An increased number of centrosomes is a hallmark of DNA over-replication. There-
                                      2.2. Combination of OSI-906 and ZM447439 Generates over-Replicated Cells
                                     fore, to examine whether enlarged cells contained an excess amount of DNA, cells were
                                           Anwith
                                     treated   increased
                                                   eithernumber
                                                          OSI-906oforcentrosomes
                                                                      ZM447439, is oratheir
                                                                                       hallmark of DNA over-replication.
                                                                                            combination                  Therefore,
                                                                                                        for 48 h and analyzed   for
                                      to examine  whether  enlarged   cells contained an excess amount  of DNA,  cells
                                     DNA content and cyclin B1 levels by flow cytometry. Control cells (DMSO) showed a were treated
                                      with either OSI-906 or ZM447439, or their combination for 48 h and analyzed for DNA
                                     typical pattern of DNA content. Upon combination treatment, cells exhibited over-repli-
                                      content and cyclin B1 levels by flow cytometry. Control cells (DMSO) showed a typical
                                      pattern of DNA content. Upon combination treatment, cells exhibited over-replicated
                                      DNA more than 4N (Figure 2, left), suggesting that enlarged cells contain over-replicated
                                      DNA more than 4N. Aurora B plays a role in the SAC. Therefore, inhibition of Aurora B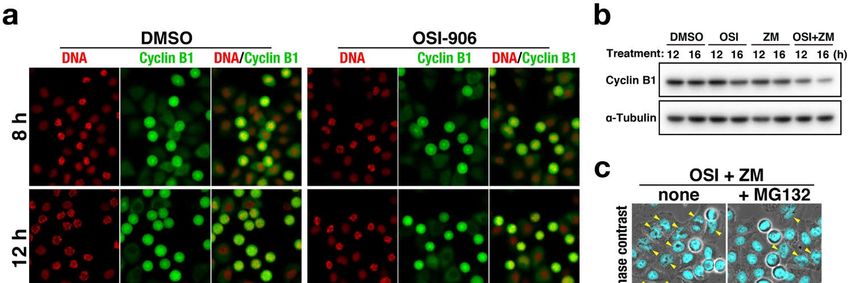
Aurora B was expected to induce mitotic slippage, thus generating cells with over-repli-
cated DNA. However, ZM447439 treatment, at the concentration used in this study, did
not generate cells having more than 4N DNA content.
Bivariate plot of cyclin B1 levels versus DNA content revealed an increase in the
Int. J. Mol. Sci. 2021, 22, 5706 number of 4N, 8N, and 16N cells with lower cyclin B1 levels (Figure 2, right). Since cyclin
4 of 16
B1 accumulates through G2 and degrades at the onset of anaphase, these cells with lower
cyclin B1 levels would be anaphase/telophase-arrested cells or cells generated by mitotic
exit without cytokinesis. Based on the result shown in Figure 1, in which the number of
was expected
enlarged cellstowith
induce mitotic slippage,
aberrant-shaped thus
nuclei generating
was cells
increased, with
these over-replicated
results DNA.
suggest that 4N,
However, ZM447439 treatment, at the concentration used in this study, did not generate
8N, and 16N cells with low cyclin B1 levels may be generated by mitotic exit without cy-
cells having
tokinesis or more than 4N DNA
with cytokinesis content.
failure.
Figure2.
Figure 2. Combination
Combination of of OSI-906
OSI-906 and
and ZM447439
ZM447439 causes
causes over-replication.
over-replication. HeLa
HeLa S3S3 cells
cells were
were treated
treated with
with 33 µM
µM OSI-906,
OSI-906,
0.5 or 1 µM ZM447439, or their combination for 48 h. The cells were detached from dishes, fixed with 70% ethanol forfor
0.5 or 1 µM ZM447439, or their combination for 48 h. The cells were detached from dishes, fixed with 70% ethanol 1 h1ath
at –30
◦ °C, and stained for cyclin B1 and DNA. DNA histograms are shown on the left. Peak haploid genome equivalents
–30 C, and stained for cyclin B1 and DNA. DNA histograms are shown on the left. Peak haploid genome equivalents are
are indicated. Percentages of cells with more than 4N DNA content and less than that of DNA content are shown. Each
indicated. Percentages of cells with more than 4N DNA content and less than that of DNA content are shown. Each plot
plot represents 18,000 cells. The bivariate dot plots of 18,000 cells are shown on the right; DNA content is shown on the x-
represents
axis (linear18,000
scale),cells.
whileThe bivariate
cyclin dot plots
B1 protein levelofis18,000
showncells arey-axis
on the shown(logon scale).
the right; DNAdesignated
Regions content is shown
by lineon the x-axis
include cells
(linear
having 4N, 8N, or 16N DNA content, while lower and upper regions include cyclin B1-negative and -positive cellhaving
scale), while cyclin B1 protein level is shown on the y-axis (log scale). Regions designated by line include cells popu-
4N, 8N, respectively.
lations, or 16N DNAPercentage
content, while lower
of cell and upper
numbers withinregions include
the region cyclin
to the wholeB1-negative
cell number and -positive
is shown cellthe
near populations,
region.
respectively. Percentage of cell numbers within the region to the whole cell number is shown near the region.
2.3. Defect in Chromosome Alignment upon Combination Treatment
Bivariate plot of cyclin B1 levels versus DNA content revealed an increase in the
We previously reported that OSI-906 delays M phase progression [16]. ZM447439 is
number of 4N, 8N, and 16N cells with lower cyclin B1 levels (Figure 2, right). Since cyclin
an inhibitor of Aurora B, a protein that is critical for M phase progression. To scrutinize
B1 accumulates through G2 and degrades at the onset of anaphase, these cells with lower
how this combination treatment generated over-replicated cells, we first examined the ef-
cyclin B1 levels would be anaphase/telophase-arrested cells or cells generated by mitotic
fect of OSI-906, ZM447439, or their combination at the same concentration used in Figures
exit without cytokinesis. Based on the result shown in Figure 1, in which the number of
1 and 2 on
enlarged M with
cells phaseaberrant-shaped
progression (Figure
nuclei3).was
Cells were treated
increased, thesewith thesuggest
results CDK1 inhibitor
that 4N,
RO-3306
8N, for 20cells
and 16N h towith
be stopped at theB1G2/M
low cyclin levelsborder
may and released from
be generated G2/M arrest
by mitotic [15,18].
exit without
In this protocol, approximately 30–40%
cytokinesis or with cytokinesis failure. of the cells synchronously enter the M phase, and
2.3. Defect in Chromosome Alignment upon Combination Treatment
We previously reported that OSI-906 delays M phase progression [16]. ZM447439 is an
inhibitor of Aurora B, a protein that is critical for M phase progression. To scrutinize how
this combination treatment generated over-replicated cells, we first examined the effect of
OSI-906, ZM447439, or their combination at the same concentration used in Figures 1 and 2
on M phase progression (Figure 3). Cells were treated with the CDK1 inhibitor RO-3306
for 20 h to be stopped at the G2/M border and released from G2/M arrest [15,18]. In this
protocol, approximately 30–40% of the cells synchronously enter the M phase, and the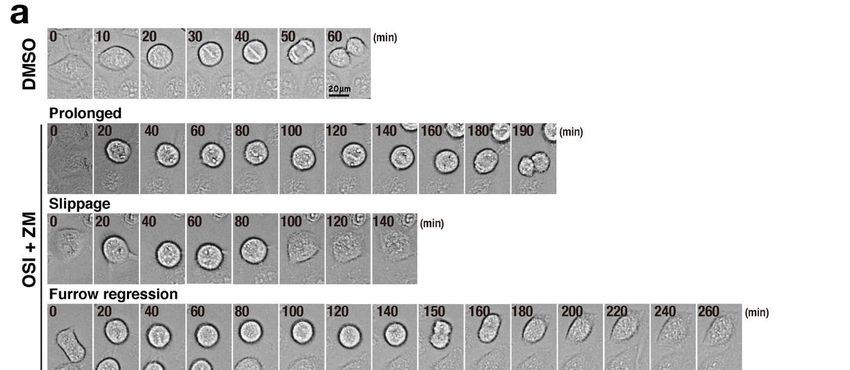
Int. J. Mol. Sci. 2021, 22, 5706 5 of 16
Int. J. Mol. Sci. 2021, 22, x FOR PEER REVIEW 5 of 17
other
the cellscells
other do donotnot
enter
enterthethe
MM phase
phase forfor
atatleast
least2 2hhafter
afterbeing
beingreleased
releasedfrom
from the
the drug
Therefore, the
treatment. Therefore, the M M phase
phase progression rates can be be compared.
compared. In the present
study, approximately
study, approximately 30% 30% of of the
the cells
cells entered
entered thethe M
M phase,
phase, with
with nono differences
differences among
among the
the
inhibitors. Classification of M phase cells into four groups showed
inhibitors. Classification of M phase cells into four groups showed that 43% of controlthat 43% of control cells
progressed
cells progressedto cytokinesis and 31%
to cytokinesis of cells
and 31% did not
of cells didalign chromosomes.
not align chromosomes. In sharp contrast,
In sharp con-
the combination
trast, the combinationof OSI-906 and ZM447439
of OSI-906 and ZM447439severelyseverely
affectedaffected
chromosome alignment,
chromosome as
align-
97% ofasthe
ment, 97%cells
of were stillwere
the cells in prophase/prometaphase.
still in prophase/prometaphase. ZM447439 at 1 µM at
ZM447439 slightly, but not
1 µM slightly,
significantly,
but increased
not significantly, prophase/prometaphase
increased prophase/prometaphase cells. In cells.
contrast, OSI-906 OSI-906
In contrast, alone at alone
3 µM
did not delay the M phase progression at this concentration. Therefore,
at 3 µM did not delay the M phase progression at this concentration. Therefore, the effect the effect of the
combination treatment was not attributed to their additive effect. We
of the combination treatment was not attributed to their additive effect. We did not expect did not expect that
1that
µM1 ZM447439
µM ZM447439 delayed M phase
delayed M phaseprogression,
progression,sincesince
ZM447439
ZM447439 at this concentration
at this did
concentration
not affect cell morphology (Figure 1), DNA content (Figure 2), and
did not affect cell morphology (Figure 1), DNA content (Figure 2), and cell proliferation cell proliferation [16].
It is assumed
[16]. that although
It is assumed that although1 µM1ZM447439
µM ZM447439 delays the Mthe
delays phase progression,
M phase cell may
progression, cell
successfully divide into two daughter cells. These results suggest that severe defect in
may successfully divide into two daughter cells. These results suggest that severe defect
chromosome alignment may be among the causes of over-replication of cells upon the
in chromosome alignment may be among the causes of over-replication of cells upon the
combination treatment, although it is not sufficient to cause over-replication.
combination treatment, although it is not sufficient to cause over-replication.
Figure 3.
Figure 3. Combination
CombinationofofOSI-906
OSI-906
andand ZM447439
ZM447439 causes
causes severesevere
defectdefect in chromosome
in chromosome alignment.
alignment. HeLa S3HeLa
cellsS3 cells
were were
treated
treated with 6 µM RO-3306 for 20 h, released by washing out this drug, and then cultured without RO-3306. After 60-min
with 6 µM RO-3306 for 20 h, released by washing out this drug, and then cultured without RO-3306. After 60-min culture,
culture, the cells were fixed and stained for α-tubulin and DNA. Based on morphologies of spindle and chromosomes,
the cells were fixed and stained for α-tubulin and DNA. Based on morphologies of spindle and chromosomes, mitotic cells
mitotic cells were classified into four groups: prophase/prometaphase (P/PM, red), metaphase (M, yellow), anaphase/tel-
were
ophaseclassified into four
(A/T, green), andgroups: prophase/prometaphase
cytokinesis (Cyto, blue). Cells were (P/PM, red),
treated metaphase
with (M, yellow),
3 µM OSI-906, anaphase/telophase
1 µM ZM447439, (A/T,
or their combi-
green), and cytokinesis (Cyto, blue). Cells were treated with 3 µM OSI-906, 1 µM ZM447439, or their combination
nation (OSI + ZM) for 1 h at the end of the RO-3306 treatment and were continuously treated during the 60-minute release. (OSI +
ZM) for 1 sulfoxide
Dimethyl h at the end
wasofused
the RO-3306
as solventtreatment and were
control (DMSO). continuouslyimages
Representative treatedare
during
shown.theArrows
60-minute release.
indicate cellsDimethyl
after the
onset of anaphase.
sulfoxide was usedThe averagecontrol
as solvent value of each group
(DMSO). and the mitotic
Representative index,
images areashown.
ratio ofArrows
mitotic cells among
indicate cellstotal
aftercell
thenumbers,
onset of
were calculated from three independent experiments (n > 222 in each experiment) and expressed as mean
anaphase. The average value of each group and the mitotic index, a ratio of mitotic cells among total cell numbers, were ± SD. p-values
were calculated
calculated usingindependent
from three Tukey’s multiple comparison
experiments (n > test.
222 in***each
p < 0.001. NS, notand
experiment) significant.
expressed as mean ± SD. p-values were
calculated using Tukey’s multiple comparison test. *** p < 0.001. NS, not significant.
2.4. Mitotic Slippage and Cytokinesis Failure
The combination treatment caused severe defect in chromosome alignment (Figure
3). However, this cannot completely explain how DNA was over-replicated. Therefore,
cells were synchronized using RO-3306 and M phase progression was continuously ob-
Int. J. Mol. Sci. 2021, 22, 5706                                                                                            6 of 16

                                   2.4. Mitotic Slippage and Cytokinesis Failure
                                        The combination treatment caused severe defect in chromosome alignment (Figure 3).
                                   However, this cannot completely explain how DNA was over-replicated. Therefore, cells
                                   were synchronized using RO-3306 and M phase progression was continuously observed by
                                   time-lapse imaging for 6 h (Figure 4a,b). While almost all control cells exit mitosis within
                                   70 min, it took more than 70 min for one-fourth of OSI-906–treated cells and one-half of
                                   ZM447439-treated cells. Mean values of duration of M phase was significantly increased
                                   from 53 min (DMSO) to 167 min (OSI+ZM) (Figure 4c). As expected, the combination treat-
                                   ment of OSI-906 and ZM447439 caused severe delay in chromosome alignment (Figure 4b,
                                   OSI+ZM, red, Figure 4d) and prevented the onset of anaphase, even after alignment of
                                   chromosomes (yellow). Intriguingly, approximately one-half of cells underwent mitotic
                                   slippage (blue, 47.5%), where cells exited mitosis without chromosome segregation. Fur-
                                   thermore, a small fraction of cells failed cytokinesis (purple, 12.5%), where the cleavage
                                   furrow ingressed, but failed after chromosome segregation. These results suggest that,
                                   in addition to defects in chromosome alignment, mitotic slippage and cytokinesis failure
                                   result in the generation of over-replicated cells.

                                   2.5. Precocious Degradation of Cyclin B1
                                         We next investigated why the combination treatment caused mitotic slippage. The
                                   transition from metaphase to anaphase is regulated by the SAC. Satisfaction of SAC enables
                                   the onset of anaphase via ubiquitin/proteasome pathway–mediated degradation of a
                                   subset of proteins [19]. Cyclin B1 is one of these proteins. Therefore, cells were treated with
                                   OSI-906, ZM447439, or their combination in the presence of S-trityl-L-cysteine (STLC) to
                                   activate SAC and cyclin B1 expression level was examined (Figure 5). STLC is a reversible
                                   inhibitor of kinesin Eg5, which is responsible for formation of the bipolar spindle [20].
                                   Inhibition of Eg5 results in formation of the monopolar spindle; the resulting incorrect
                                   microtubule attachment to the kinetochores activates SAC. The STLC treatment caused
                                   accumulation of M phase cells until 16 h. However, upon the combination treatment,
                                   cells with lower cyclin B1 expression levels were identified at 12 h and several interphase
                                   cells with aberrant-shaped nuclei were found at 16 h (Figure 5a). Western blot analysis
                                   confirmed the decrease in cyclin B1 levels upon combination treatment (Figure 5b and
                                   Figure S1). In contrast, treatment with ZM447439 at 1 µM did not affect cyclin B1 levels.
                                   Although OSI-906 treatment alone did not decrease cyclin B1 levels at 12 h, a decrease
                                   in cyclin B1 levels was observed at 16 h (Figure 5a). In addition, simultaneous treatment
                                   with MG132 prevented the generation of cells with aberrant-shaped nuclei (Figure 5c)
                                   and the decrease in cyclin B1 expression level (Figure 5d and Figure S1). Conversely,
                                   inhibition of CDK1 by RO-3306 caused mitotic slippage and accelerated the generation of
                                   these cells (Figure 5e). As expected, the combination treatment in the presence of paclitaxel
                                   instead of STLC also generated cells with aberrant-shaped nuclei (Figure S2). These results
                                   suggest that precocious degradation of cyclin B1 is a cause of mitotic slippage, generation
                                   of over-replicated cells, and the following cell death.
Int. J. Mol. Int.
              Sci.J.2021,
                    Mol. Sci.
                          22,2021,
                              570622, x FOR PEER REVIEW                                                                                         7 of 17    7 of 16

                 Figure 4. Combination of OSI-906 and ZM447439 causes mitotic slippage and cytokinesis failure. HeLa S3 cells were
                 Combination
      Figure 4.treated   with 6 µM ofRO-3306
                                      OSI-906forand20 hZM447439     causes
                                                        and with either  3 µMmitotic  slippage
                                                                                OSI-906,         and cytokinesis
                                                                                         1 µM ZM447439,              failure. HeLa
                                                                                                            or their combination      S3+cells
                                                                                                                                   (OSI    ZM) were
                                                                                                                                                for treated
               1 h  at end of the RO-3306  treatment.   The cells were released  by washing   out the drug  and then
      with 6 µM RO-3306 for 20 h and with either 3 µM OSI-906, 1 µM ZM447439, or their combination (OSI + ZM) for 1 h cultured continuously   with
      at end ofinhibitors  without RO-3306. Immediately after the release from RO-3306 treatment, time-lapse imaging was started. Im-
                 the RO-3306      treatment. The cells were released by washing out the drug and then cultured continuously with
               ages of bright field and Hoechst 33342 fluorescence (DNA) were captured every 5 min. (a) Representative images of cells
      inhibitorswith
                  without    RO-3306.
                      prolonged M phase,Immediately       after and
                                            mitotic slippage,    the furrow
                                                                     releaseregression
                                                                              from RO-3306      treatment,
                                                                                         are shown.   (b) The time-lapse
                                                                                                              mitotic cells imaging   was started.
                                                                                                                             were classified based Images
      of brighton
                field
                   theirand  Hoechst 33342
                         morphologies            fluorescence
                                        of cell shape             (DNA) were
                                                       and chromosomes            captured
                                                                           into three groups:every    5 min. (a) Representative
                                                                                               prophase/prometaphase                  images(M),
                                                                                                                          (P/PM), metaphase     of cells with
      prolonged M phase, mitotic slippage, and furrow regression are shown. (b) The mitotic cells were classified based on their
      morphologies of cell shape and chromosomes into three groups: prophase/prometaphase (P/PM), metaphase (M), and
      anaphase/telophase/cytokinesis (A/T/Cyto). Based on the time-lapse images, the duration of each mitotic sub-phase
      (P/PM, M. A/T/Cyto) in individual cells are plotted in the graph (n = 40). Cells that exited mitosis without chromosome
      segregation and cytokinesis are shown as “Slippage.” Cells whose cleavage furrows ingressed and then regressed were
      shown as “cytokinesis failure.” (c,d) Mean values of the durations of M phase (c) and P/PM (d) were plotted as mean ± SD.
      p-values were calculated using the Games–Howell multiple comparison test. *** p < 0.001.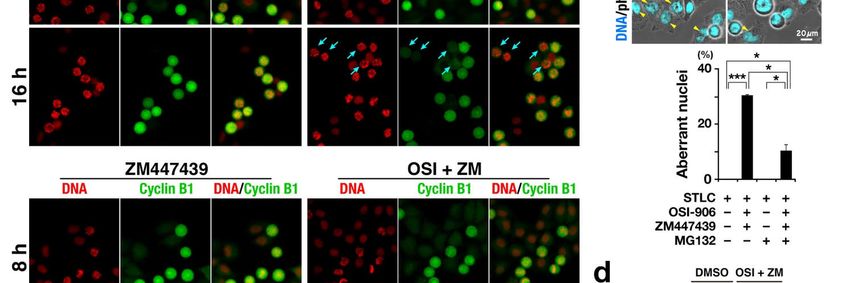
Int. J. Mol. Sci. 2021, 22, 5706 8 of 16
Int. J. Mol. Sci. 2021, 22, x FOR PEER REVIEW 9 of 17
Figure
Figure 5. Combination
5. Combination ofofOSI-906
OSI-906and andZM447439
ZM447439 causescauses mitotic
mitotic slippage
slippagevia viaprecocious
precociousdegradation
degradation of of
cyclin B1.B1.
cyclin HeLaHeLa
S3 cells were treated with 7.5 µM S-trityl-L-cysteine in the presence of OSI-906, ZM447439, or their combination (OSI +
S3 cells were treated with 7.5 µM S-trityl-L-cysteine in the presence of OSI-906, ZM447439, or their combination (OSI +
ZM). Dimethyl sulfoxide was used as solvent control (DMSO). (a) At 8, 12, and 16 h after the start of treatment, cells were
ZM). Dimethyl
fixed sulfoxide
and stained was B1
for cyclin used as solvent
(green) and DNA control (DMSO).
(red). (a) At 8,images
Representative 12, andare16 shown.
h after the
Bluestart of treatment,
arrows indicate Mcells were
phase
fixed and stained for cyclin B1 (green) and DNA (red). Representative images are shown. Blue arrows
cells with lower expression levels of cyclin B1. Yellow arrowheads indicate cells with aberrant nuclear morphologies. Scale indicate M phase
cells with
bar, 20 lower
µm. (b) expression levels
At 10 h after theoftreatment,
cyclin B1.M Yellow
phasearrowheads indicate by
cells were collected cells with aberrant
mitotic shake-offnuclear morphologies.
and further incubated Scale
in
microtubes at 37 °C for 2 h and 6 h. Whole cell lysates were analyzed using Western blot with
bar, 20 µm. (b) At 10 h after the treatment, M phase cells were collected by mitotic shake-off and further incubated in the indicated antibodies.
The full blots
microtubes at 37 are
◦ C shown in Figure
for 2 h and S1. (c) cell
6 h. Whole At 12 h after
lysates the treatment,
were 40 µM
analyzed using MG-132blot
Western waswith
added
theto the culture.
indicated The cellsThe
antibodies.
were further incubated for 4 h and stained for DNA (cyan). Yellow arrowheads indicate cells with aberrant nuclear mor-
full blots are shown in Figure S1. (c) At 12 h after the treatment, 40 µM MG-132 was added to the culture. The cells were
phologies. Scale bar, 20 µm. The number of cells with aberrant-shaped nuclei was counted and plotted as the mean ± SD
further incubated
calculated fromfor 4 h independent
three and stained for DNA (cyan).
experiments (n >Yellow arrowheads
112). p-values wereindicate cellsusing
calculated with the
aberrant nuclear morphologies.
Games–Howell multiple
Scale bar, 20 µm. The number of cells with aberrant-shaped nuclei was counted and plotted
comparison test. * p < 0.05; *** p < 0.001. (d) At 10 h after the treatment, M phase cells were collected by mitoticas the mean ± SDshake-off
calculated
from
andthree independent
further incubated in experiments
microtubes at (n37 °C forp-values
> 112). 6 h. Duringwerethecalculated using the Games–Howell
last 4 h of incubation in microtubes, themultiple
cells werecomparison
treated
with
test. * p 40 µM MG-132.
< 0.05; Whole(d)
*** p < 0.001. cell
Atlysates werethe
10 h after analyzed usingM
treatment, Western blot with
phase cells werethe indicated
collected byantibodies. The full and
mitotic shake-off blotsfurther
are
shown in Figure S1. (e) At 10
◦ h after the treatment, 6 µM RO-3306 was added to the culture. The
incubated in microtubes at 37 C for 6 h. During the last 4 h of incubation in microtubes, the cells were treated with 40 µMcells were further incu-
bated for 2 h and stained for DNA (cyan). Yellow arrowheads indicate cells with aberrant nuclear morphologies. Scale bar,
MG-132. Whole cell lysates were analyzed using Western blot with the indicated antibodies. The full blots are shown in
20 µm.
Figure S1. (e) At 10 h after the treatment, 6 µM RO-3306 was added to the culture. The cells were further incubated for 2 h
and stained for DNA (cyan). Yellow arrowheads indicate cells with aberrant nuclear morphologies. Scale bar, 20 µm.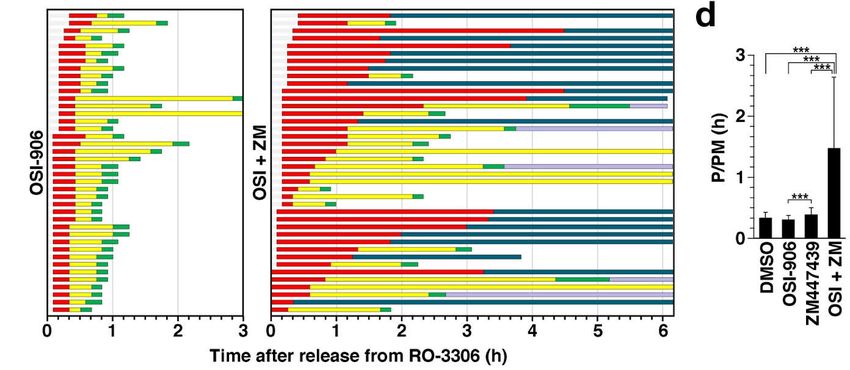
Int. J. Mol. Sci. 2021, 22, 5706 9 of 16
OSI-906 has been used in clinical trials for the treatment of lung cancer [21–23]. There-
fore, the combination treatment effect on cell viability was examined for human non-small
cell lung cancer A549 cells. First, a WST-8 assay was performed to determine the IC50
values. The absorbance of reduced 2-(2-methoxy-4-nitrophenyl)-3-(4-nitrophenyl)-5-(2,4-
isulfophenyl)-2H-tetrazolium monosodium salt at 450 nm showed that both OSI-906 and
ZM447439 reduced cell viability in a concentration-dependent manner. The IC50 values
are shown in the graph (Figure 6a). Next, we examined the possibility of the OSI-906 and
ZM447439 synergism using the methods reported by Chou and Talalay [24]. Although
3 µM OSI-906 showed almost no effect on cell viability, the combination with either 0.6 µM
or 1 µM ZM447439 significantly reduced cell viability compared to the single treatment
(Figure 6b). Combination index (CI) values were 0.32 (combined with 0.6 µM ZM447439)
and 0.35 (combined with 1 µM ZM447439). The obtained values were less than 1, suggest-
ing the possibility of OSI-906 and ZM447439 synergism for the reduction of cell viability
Int. J. Mol. Sci. 2021, 22, x FOR PEER REVIEW in
10 of 17
human non-small cell lung cancer A549 cells.
Figure
Figure 6.6. Combination
Combination of of OSI-906
OSI-906with
withZM447439
ZM447439reduces
reducescell
cell viability
viability in in
thethe non-small
non-small cellcell
lunglung cancer
cancer A549A549
cells.cells. (a)
(a) The
The A549 cells were treated with OSI-906 or ZM447439 for 72 h, and cell viability was determined using
A549 cells were treated with OSI-906 or ZM447439 for 72 h, and cell viability was determined using a WST-8 assay. The a WST-8 assay.
The relative absorbance ratios to the solvent control are plotted as mean ± SD calculated from three independent experi-
relative absorbance ratios to the solvent control are plotted as mean ± SD calculated from three independent experiments.
ments. The IC50 was calculated in each experiment and is shown as mean ± SD. (b) The A549 cells were treated with OSI-
The IC50 was calculated in each experiment and is shown as mean ± SD. (b) The A549 cells were treated with OSI-906,
906, ZM447439, or their combination for 72 h; next, a WST-8 assay was performed. The absorbance is plotted as mean ±
ZM447439,
SD calculated orfrom
theirmore
combination forindependent
than three 72 h; next, a experiments.
WST-8 assay Thewasp-values
performed. wereThe absorbance
calculated usingis Tukey’s
plotted as mean ±
multiple SD
com-
calculated from more than three independent
parison test. ** p < 0.01; *** p < 0.001. experiments. The p-values were calculated using Tukey’s multiple comparison
test. ** p < 0.01; *** p < 0.001.
3. Discussion
3. Discussion
In this study, we demonstrated that combination treatment of OSI-906 and ZM447439
In this study, we demonstrated that combination treatment of OSI-906 and ZM447439
causes cell death via generation of over-replicated cells with aberrant nuclei. Time-lapse
causes cell death via generation of over-replicated cells with aberrant nuclei. Time-lapse
imaging revealed that the defect in chromosome alignment and mitotic slippage are re-
imaging revealed that the defect in chromosome alignment and mitotic slippage are respon-
sponsible forgeneration
sible for the the generation of over-replicated
of over-replicated cells. cells. Treatment
Treatment withproteasome
with the the proteasome in-
inhibitor
hibitor and cyclin B1 staining revealed that precocious degradation of cyclin
and cyclin B1 staining revealed that precocious degradation of cyclin B1 is the mechanism B1 is the
mechanism
underlying underlying theof
the generation generation of over-replicated
over-replicated cells.provides
cells. This study This study provides
novel insightsnovel
into
insights into combination chemotherapy using IGF1R inhibitor
combination chemotherapy using IGF1R inhibitor and Aurora B inhibitor. and Aurora B inhibitor.
The
The microtubule-targeting
microtubule-targeting agents
agents exert
exert their
their anti-proliferative
anti-proliferative effects
effects by
by activating
activating
the SAC via induction of incorrect bipolar kinetochore–microtubule
the SAC via induction of incorrect bipolar kinetochore–microtubule attachments attachments [25]. Un-
[25].
attached
Unattached kinetochores trigger signals, including MPS1 kinase, for formationmitotic
kinetochores trigger signals, including MPS1 kinase, for formation of the of the
checkpoint complexcomplex
mitotic checkpoint (MCC) comprising Mad2, Bub3,
(MCC) comprising Mad2,BubR1, and CDC20
Bub3, BubR1, [19]. The
and CDC20 [19].MCC
The
inhibits APC/C and thereby prevents the degradation of cyclin B1 and cohesin.
MCC inhibits APC/C and thereby prevents the degradation of cyclin B1 and cohesin. This This can
halt
can halt cells before the onset of anaphase until all kinetochores are properly attachedmi-
cells before the onset of anaphase until all kinetochores are properly attached to to
crotubules emanating from two opposite poles. In our recent report, we demonstrated
that IGF1R inhibition delays M phase progression via affecting the chromosome align-
ment. This delay is rescued by treatment of cells with the MPS1 inhibitor AZ3146, thus
suggesting that activation of SAC is responsible for the delay in M phase progression and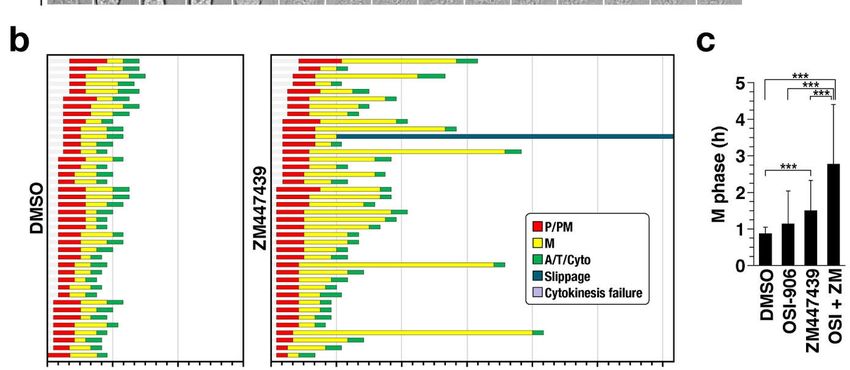
Int. J. Mol. Sci. 2021, 22, 5706                                                                                          10 of 16

                                   microtubules emanating from two opposite poles. In our recent report, we demonstrated
                                   that IGF1R inhibition delays M phase progression via affecting the chromosome alignment.
                                   This delay is rescued by treatment of cells with the MPS1 inhibitor AZ3146, thus suggesting
                                   that activation of SAC is responsible for the delay in M phase progression and partly
                                   for the anti-proliferative effect of IGF1R inhibitor [16]. In contrast, the concentration of
                                   OSI-906 used for the combination treatment in this study is not too high to sufficiently
                                   delay chromosome alignment in RO-3306 synchronization experiment (Figure 3) and, as
                                   such, it caused a slight prolongation of M phase possibly via SAC activation (Figure 4).
                                   Given the delay in chromosome alignment in ZM447439-treated cells (Figure 3), 1 µM
                                   ZM447439 is likely to cause the activation of SAC rather than SAC inhibition. Therefore, it
                                   was possible to hypothesize that the anti-proliferative effects of the combination treatment
                                   would be attributed to the activation of SAC.
                                         Gascoigne and Taylor proposed a model for deciding the fate of cells continuously
                                   treated with anti-mitotic drugs [26]. In this report, cell death pathway competes with the
                                   pathway for mitotic slippage. When degradation of cyclin B1 breaches the threshold for
                                   the mitotic exit earlier than breaching the threshold for cell death, cells prematurely exit
                                   the M phase, and the mitotic slippage prevents cell death in the M phase. When cyclin B1
                                   levels are maintained above a threshold as a result of continuous SAC activation, mitotic
                                   slippage does not occur and the cell dies in the M phase. This means that the longer the
                                   cells are arrested in M phase, the more cell death occurs. Indeed, we recently reported that
                                   v-Src–induced mitotic slippage attenuates the cytotoxicity of paclitaxel [27]. ZM447439
                                   prevents chromosome alignment [28]. Similarly, OSI-906 delays the onset of anaphase due
                                   to defect in chromosome alignment [16]. In the present study, a single treatment of either
                                   OSI-906 slightly or ZM447439 drastically prolonged the duration of metaphase (Figure 4).
                                   Furthermore, the combination severely disrupted the chromosome alignment (Figure 3).
                                   Therefore, we had expected that a combination would further delay the onset of anaphase
                                   and that cells would be arrested in M phase for longer periods with severe chromosome
                                   segregation defects. However, unexpectedly, generation of enlarged cells with aberrant
                                   nuclei (Figure 1) and over-replicated cells were observed (Figure 2), which indicates that
                                   the combination treatment caused SAC defect, which was supported by the result of the
                                   time-lapse imaging (Figure 4). Therefore, the anti-proliferative effects are not attributed
                                   to the prolonged duration of M phase due to SAC activation with the severe defect in the
                                   chromosome alignment.
                                         How is mitotic slippage caused by the combination? Cyclin B1 staining showed that
                                   the combination treatment causes a decrease in cyclin B1 levels in the presence of the
                                   Eg5 inhibitor STLC. This can be caused by either inhibition of synthesis or acceleration
                                   of cyclin B1 degradation. Simultaneous treatment with the proteasome inhibitor MG132
                                   partially reduced the number of cells with aberrant nuclei, thus suggesting that precocious
                                   degradation of cyclin B1 is responsible for the decrease in cyclin B1 levels and therefore
                                   the mitotic slippage. Considering that Aurora B plays a role in SAC activation via the
                                   recruitment of MPS1 [29–33], ZM447439 was expected to cause the precocious degradation
                                   of cyclin B1. However, M phase cells with low cyclin B1 levels were found in cells treated
                                   with OSI-906, but not with 1 µM ZM447439 (Figure 5). Furthermore, 1 µM of ZM447439 did
                                   not increase the number of cells after the onset of anaphase in the RO-3306 synchronization
                                   experiment (Figure 3). This implies that 1 µM ZM447439 is incapable of inhibiting the
                                   SAC function. The concentration of ZM447439 that affects chromosome alignment is
                                   expected to be lower than that inhibits the SAC function. ZM447439 at 1 µM may hinder
                                   the chromosome alignment without inhibiting SAC. These results raise the possibility
                                   that OSI-906 may partially disrupt the SAC function and synergize with ZM447439 to
                                   inhibit SAC function and accelerate the degradation of cyclin B1, thereby causing the
                                   mitotic slippage.
                                         However, the MPS1 inhibitor AZ3146 does not enhance the anti-proliferative effect of
                                   OSI-906 [16]. Therefore, further defect in the SAC function was not the sole cause of the
                                   anti-proliferative effects of combination treatment. Mitotic slippage results in generation of
Int. J. Mol. Sci. 2021, 22, 5706 11 of 16
over-replicated cells and the following cell division tends to be abnormal, thereby leading
to aneuploidy [34]. Given that both OSI-906 and ZM447439 cause defects in chromosome
alignment, the defects in chromosome alignment and the following mitotic slippage may
generate cells with massive aneuploidy. When SAC is inhibited before chromosomes are
properly attached to microtubules, chromosome bridges or lagging chromosomes can be
trapped inside the intercellular canal. The presence of chromosomes inside the intercellular
canal activates the abscission checkpoint, which prevents the progression of cytokine-
sis [35,36]. Aurora B is reportedly involved in this checkpoint [35]. Thus, upon Aurora B
inhibition, even if chromosomes would exist inside the intercellular canal, the abscission
checkpoint is not activated and is not capable of preventing progression of cytokinesis, thus
resulting in cleavage furrow regression. Alternatively, even if chromosomes are segregated
in anaphase, inhibition of Aurora B leads to cytokinesis failure, since Aurora B plays a role
in cytokinesis [37,38]. This cytokinesis failure generates cell with massive aneuploidization
and chromosomal instability (CIN). Although CIN at a minor levels is thought to drive
tumorigenesis, an increase in CIN may suppress cancer cell proliferation [39,40]. Therefore,
SAC defect following severe chromosome alignment defect may generate massive aneu-
ploidy in combination-treated cells. Induction of CIN at higher levels may be responsible
for the increase in cell death caused by the combination treatment of Aurora B and IGF1R
inhibitors, which is supported by the report describing that tetraploidization increases
sensitivity to Aurora B inhibitors [41].
In certain cancers, IGF1R signaling contributes to oncogene-induced cancer transfor-
mation, thus suggesting that IGF1R signaling pathway is an attractive therapeutic target
for cancer chemotherapy [42]. Because of expression of IGF1R in many human tissues and
cell types, as well as cross-reaction of many IGF1R inhibitors with insulin receptor, dose
reduction of IGF1R inhibitors is required to reduce the side effects. In this regard, combi-
nation therapy is advantageous for dose reduction and combination therapy approaches
have been widely applied [43]. However, some phase II trials of linsitinib (OSI-906) alone
or in combination with other anticancer drugs have failed to demonstrate clinical activity
as cancer chemotherapy [21–23,44–46]. Many Aurora kinase inhibitors have been also
developed, but not yet approved for clinical use due to their cytotoxicity. In this study,
combination of IGF1R inhibitor and Aurora B inhibitor drastically reduced cell viability
and induced cell death. Conversely, each inhibitor alone did not reduce cell viability at the
concentration used in this study. Therefore, this combination can potentially reduce their
concentrations and side effects. In addition, the reduction of the doses of these agents in
cancer chemotherapy will enable further combinations with other anti-cancer agents, such
as anti-microtubule agents.
Microtubule polymerization and depolymerization are critical for mitotic spindle for-
mation. The anti-microtubule agent paclitaxel suppresses microtubule dynamics, activating
SAC via defect in mitotic spindle formation. While SAC-caused prolonged mitotic arrest is
required for paclitaxel-induced cell death, SAC signaling is partially disrupted in many
cancer cells [47]. Thus, an anti-microtubule-based chemotherapy is not efficient because of
failure in prolonged mitotic arrest. It is noted that a severely disabled SAC signaling causes
cell death due to massive aneuploidy [47]. In this study, the combination treatment induced
mitotic slippage even in the presence of paclitaxel, as shown in Figure S2. Treating cancer
patients with a combination of OSI-906 and ZM447439, together with anti-microtubule
agents, can cause mitotic slippage and generate cells with aberrant-shaped nuclei with
over-replicated DNA, inducing cell death possibly via massive aneuploidy. Therefore, in
addition to anti-microtubule-based chemotherapy, treatment with a combination of OSI-906
and ZM447439 can be a novel and fruitful approach for cancer chemotherapy. Further
study is required to determine whether a combination of OSI-906 and ZM447439 actually
accelerates anti-microtubule agent-caused cell deaths.Int. J. Mol. Sci. 2021, 22, 5706 12 of 16
4. Materials and Methods
4.1. Cells
Human cervix adenocarcinoma HeLa S3 cells and human non-small cell lung cancer
A549 cells (Japanese Collection of Research Bioresources, Osaka, Japan) were maintained
in Dulbecco’s modified Eagle’s medium supplemented with 20 mM 4-(2-hydroxyethyl)-1-
piperazine ethanesulfonic acid (HEPES)-NaOH (pH 7.4) and 5% FBS. No Hoechst 33342
fluorescence was observed in the cytoplasm, indicating that these cells were not infected
with mycoplasma.
4.2. Chemicals
The IGF-1R inhibitor OSI-906 (07333, LKT Laboratories, St. Paul, MN, USA), the
Aurora B inhibitor ZM447439 (JS Research Chemicals Trading, Wedel, Germany), the
proteasome inhibitor MG132 (3175-v, Peptide Institute, Osaka, Japan), the Eg5 inhibitor
STLC (164739, MilliporeSigma, Burlington, MA, USA), and the microtubule-targeting agent
paclitaxel (169-18611, FujiFilm Wako, Osaka, Japan) were used in this study. The CDK1
inhibitor RO-3306 (S7747, Selleck Chemicals) was used for synchronization to M phase [48].
Dimethyl sulfoxide (Nacalai Tesque, Kyoto, Japan) was used to dissolve these chemicals.
4.3. Antibodies
The following primary antibodies were used for immunofluorescence (IF) and im-
munoblotting (IB): mouse monoclonal anti-γ-tubulin antibody (IF, 1:250; GTU-88, Sigma-
Aldrich, St. Louis, MO, USA), rat monoclonal anti-α-tubulin antibody (IF, 1:800; IB, 1:4000;
YOL1/34, MCA78G, Bio-rad, Hercules, CA, USA), rabbit polyclonal anti-cyclin B1 (IF,
1:250; IB, 1:2000; H-433, sc-752, Santa Cruz Biotechnology), and anti-cleaved caspase-3 (IF,
1:500; #9661, Cell Signaling Technology, Danvers, MA, USA) antibodies.
The following secondary antibodies for IF staining were purchased from Thermo
Fisher Scientific (Waltham, MA, USA): Alexa Fluor 488-labeled donkey anti-mouse im-
munoglobin G (IgG) (1:800; A21202), Alexa Fluor 488–labeled donkey anti-rabbit IgG (1:800;
A21206), Alexa Fluor 488–labeled donkey anti-rat IgG (1:800; A21208), and Alexa Fluor
555–labeled donkey anti-rabbit IgG (1:800; A31572) antibodies. The following secondary
antibodies for IB were purchased from Jackson ImmunoResearch (West Grove, PA, USA):
horseradish peroxidase-conjugated anti-rabbit (1:8000; 711-035-152) and anti-rat (1:8000;
712-035-153) IgG antibodies.
4.4. Immunofluorescence Microscopy
Cells were stained according to previously described methods [49–51]. In brief, after
washing with phosphate-buffered saline (PBS) (–), cells were fixed with 4% formaldehyde
in PBS (–) for 20 min, permeabilized, and blocked with PBS (−) containing 3% BSA and
0.1% saponin for 30 min at room temperature. When M phase cells were observed, the
washing step was omitted. For staining of γ-tubulin, cells were fixed with methanol
for 5 min at −30 ◦ C. For staining of cleaved caspase-3, loosely attached or floating cells
were sedimented onto glass cover slips by centrifugation prior to fixation. Primary and
secondary antibodies were diluted with PBS (–) containing 3% BSA and 0.1% saponin and
applied for 1 h each at room temperature. Hoechst 33342 was used to stain DNA with the
secondary antibody. Fluorescence images were obtained with a fluorescence microscope
(IX-83, Olympus, Tokyo, Japan) fitted with 20 × 0.45 NA, 40 × 0.75 NA objective lenses,
and 60 × 1.42 NA oil-immersion objective lens (Olympus). Hoechst 33342, Alexa Fluor 488,
and Alexa Fluor 555 signals were captured using a U-FUNA cube (360–370 nm excitation,
420–460 nm emission), U-FBNA cube (470–495 nm excitation, 510–550 nm emission), and
U-FRFP cube (535–555 nm excitation, 570–625 nm emission), respectively. Images were
processed using ImageJ (National Institutes of Health, Bethesda, MD, USA), Photoshop
CC, and Illustrator CC software (Adobe, San Jose, CA, USA).Int. J. Mol. Sci. 2021, 22, 5706 13 of 16
4.5. Western Blotting
Cells were lysed in sodium dodecyl sulfate (SDS)–sample buffer containing protease
and phosphatase inhibitors (2 µg/mL aprotinin, 0.8 µg/mL pepstatin A, 2 µg/mL leu-
peptin, 2 mM PMSF, 20 mM β-glycerophosphate, 50 mM NaF, and 10 mM Na3 VO4 ). The
cell lysates were subjected to SDS–polyacrylamide gel electrophoresis and were electro-
transferred onto polyvinylidene difluoride membranes (PVDF; Pall Corporation, Port
Washington, NY, USA). After blocking with Blocking One (Nacalai Tesque) at room tem-
perature for 30 min, the membranes were incubated with the antibodies diluted with
Tris-buffered saline [20 mM Tris–HCl (pH 7.5), 137 mM NaCl] containing 0.1% Tween 20
and 5% Blocking One. Chemiluminescence was detected with ChemiDoc XRSplus image
analyzer (Bio-Rad) using Clarity (Bio-Rad) as the chemiluminescence substrate.
4.6. Cell Cycle Synchronization
To analyze the progression of M phase, cells were treated with 6 µM RO-3306, a CDK1
inhibitor, for 20 h and then washed with pre-warmed PBS containing Ca2+ and Mg2+
[PBS(+)] four times on a water bath at 37 ◦ C. Immediately, cells were incubated with
pre-warmed medium for 60 min in a CO2 incubator. After fixing with 4% formaldehyde in
PBS (–), cells were stained for α-tubulin and DNA. Based on the morphologies of mitotic
spindle and chromosomes, cells were classified into four groups: prophase/prometaphase
(P/PM), metaphase (M), anaphase/telophase (A/T), and cytokinesis (Cyto).
4.7. Time-Lapse Imaging
For time-lapse imaging of M phase cells [52], cells were synchronized to M phase
as described above. After removal of RO-3306 by washing the cells, 0.1 µM Hoechst
33342 was added into the culture and time-lapse images of bright-field and Hoechst 33342
fluorescence were acquired in a live-cell chamber at 37 ◦ C in 5% CO2 using the Operetta
imaging system (PerkinElmer, Waltham, MA, USA). The durations of each of the mitotic
phases, such as P/PM, M, and A/T/Cyto, were determined.
4.8. WST-8 Assay
Cell viability was assessed using a Cell Counting Kit-8 (Dojindo, Kumamoto, Japan)
based on the manufacturer’s instructions, as described previously [14]. A549 cells seeded
in 96-well plates (3000–4000 cells per well) were cultured with either OSI-906, ZM447439,
or their combination for 3 days. DMSO was used as a solvent control. The absorbance
(450 nm) of reduced 2-(2-methoxy-4-nitrophenyl)-3-(4-nitrophenyl)-5-(2,4-isulfophenyl)-
2H-tetrazolium, monosodium salt (WST-8) was measured using an iMark Microplate
Reader (Bio-Rad).
4.9. Combination Index
Combination index (CI) was calculated by the following equation [24]:
CI = (D)1 /(Dx )1 + (D)2 /(Dx )2
where (Dx )1 and (Dx )2 are the concentrations for OSI-906 and ZM447439 alone, respectively,
that cause x% suppression of cell viability. (D)1 and (D)2 are the concentrations of OSI-906
and ZM447439, respectively, in combination that also cause x% suppression. (Dx )1 and
(Dx )2 were predicted from the results of dose-response curve shown in Figure 6a. CI values
less than 1 suggest synergism.
4.10. Statistics
Bartlett’s test was used to examine the homogeneity of variance. One-way analysis
of variance was used to identify the statistical significance for multiple comparisons with
equal variances, followed by Tukey–Kramer test. For multiple comparisons with unequal
variances, the Games–Howell test was used. Analyses were performed with EZR (SaitamaInt. J. Mol. Sci. 2021, 22, 5706 14 of 16
Medical Centre, Jichi Medical University; http://www.jichi.ac.jp/saitama-sct/SaitamaHP.
files/statmedEN.html [53] accessed on 1 May 2021), which is a graphical user interface for
R (The R Foundation for Statistical Computing, Vienna, Austria, version 2.13.0).
Supplementary Materials: The following are available online at https://www.mdpi.com/article/10
.3390/ijms22115706/s1.
Author Contributions: Conceptualization, Y.N.; methodology, Y.I. and Y.N.; validation, Y.I. and Y.N.;
formal analysis, Y.I., R.Y. (Ryuji Yasutake), R.Y. (Ryuzaburo Yuki), Y.S. and Y.N.; investigation, Y.I.,
R.Y. (Ryuji Yasutake), R.Y. (Ryuzaburo Yuki), Y.S. and Y.N.; resources, Y.N.; data curation, Y.I., R.Y.
(Ryuji Yasutake), R.Y. (Ryuzaburo Yuki), Y.S. and Y.N.; writing—original draft preparation, Y.N.;
writing—review and editing, Y.N.; visualization, Y.N.; supervision, Y.N.; project administration, Y.N.;
funding acquisition, R.Y. (Ryuzaburo Yuki), Y.S. and Y.N. All authors have read and agreed to the
published version of the manuscript.
Funding: This work was supported, in part, by Grants-in-Aid for Scientific Research from the Japan
Society for the Promotion of Science (Nos. JP16K08253, JP18K06672, JP19K07055, JP21K15263), a grant
from the Promotion and Mutual Aid Corporation for Private Schools of Japan (Kyoto Pharmaceutical
University and Chiba University), and Kyoto Pharmaceutical University Fund for the Promotion of
Scientific Research.
Institutional Review Board Statement: Not applicable.
Informed Consent Statement: Not applicable.
Conflicts of Interest: The authors declare no conflict of interest.
References
1. Ullrich, A.; Gray, A.; Tam, A.W.; Yang-Feng, T.; Tsubokawa, M.; Collins, C.; Henzel, W.; Le Bon, T.; Kathuria, S.; Chen, E.
Insulin-like growth factor I receptor primary structure: Comparison with insulin receptor suggests structural determinants that
define functional specificity. EMBO J. 1986, 5, 2503–2512. [CrossRef]
2. Hakam, A.; Yeatman, T.J.; Lu, L.; Mora, L.; Marcet, G.; Nicosia, S.V.; Karl, R.C.; Coppola, D. Expression of insulin-like growth
factor-1 receptor in human colorectal cancer. Hum. Pathol. 1999, 30, 1128–1133. [CrossRef]
3. Xie, Y.; Skytting, B.; Nilsson, G.; Brodin, B.; Larsson, O. Expression of insulin-like growth factor-1 receptor in synovial sarcoma:
Association with an aggressive phenotype. Cancer Res. 1999, 59, 3588–3591. [PubMed]
4. All-Ericsson, C.; Girnita, L.; Seregard, S.; Bartolazzi, A.; Jager, M.J.; Larsson, O. Insulin-like growth factor-1 receptor in uveal
melanoma: A predictor for metastatic disease and a potential therapeutic target. Investig. Ophthalmol. Vis. Sci. 2002, 43, 1–8.
5. Jiang, Y.; Wang, L.; Gong, W.; Wei, D.; Le, X.; Yao, J.; Ajani, J.; Abbruzzese, J.L.; Huang, S.; Xie, K. A high expression level of
insulin-like growth factor I receptor is associated with increased expression of transcription factor Sp1 and regional lymph node
metastasis of human gastric cancer. Clin. Exp. Metastasis 2004, 21, 755–764. [CrossRef]
6. Kornprat, P.; Rehak, P.; Rüschoff, J.; Langner, C. Expression of IGF-I, IGF-II, and IGF-IR in gallbladder carcinoma. A systematic
analysis including primary and corresponding metastatic tumours. J. Clin. Pathol. 2006, 59, 202–206. [CrossRef] [PubMed]
7. Shen, M.R.; Hsu, Y.M.; Hsu, K.F.; Chen, Y.F.; Tang, M.J.; Chou, C.Y. Insulin-like growth factor 1 is a potent stimulator of
cervical cancer cell invasiveness and proliferation that is modulated by αvβ3 integrin signaling. Carcinogenesis 2006, 27, 962–971.
[CrossRef]
8. Huang, Y.F.; Shen, M.R.; Hsu, K.F.; Cheng, Y.M.; Chou, C.Y. Clinical implications of insulin-like growth factor 1 system in
early-stage cervical cancer. Br. J. Cancer 2008, 99, 1096–1102. [CrossRef] [PubMed]
9. Chan, J.M.; Stampfer, M.J.; Giovannucci, E.; Gann, P.H.; Ma, J.; Wilkinson, P.; Hennekens, C.H.; Pollak, M. Plasma insulin-like
growth factor-I and prostate cancer risk: A prospective study. Science 1998, 279, 563–566. [CrossRef] [PubMed]
10. Yu, H.; Spitz, M.R.; Mistry, J.; Gu, J.; Hong, W.K.; Wu, X. Plasma levels of insulin-like growth factor-I and lung cancer risk:
A case-control analysis. J. Natl. Cancer Inst. 1999, 91, 151–156. [CrossRef] [PubMed]
11. Paterson, A.C.; Leeding, K.S.; Bach, L.A.; Baldwin, G.S.; Macrae, F.A.; Shulkes, A. Prospective study of colorectal cancer risk in
men and plasma levels of insulin-like growth factor (IGF)-I and IGF-binding protein-3. J. Natl. Cancer Inst. 2000, 92, 1947–1950.
[CrossRef] [PubMed]
12. Samani, A.A.; Yakar, S.; LeRoith, D.; Brodt, P. The role of the IGF system in cancer growth and metastasis: Overview and recent
insights. Endocr. Rev. 2007, 28, 20–47. [CrossRef]
13. Kaibori, Y.; Saito, Y.; Nakayama, Y. EphA2 phosphorylation at Ser897 by the Cdk1/MEK/ERK/RSK pathway regulates M-phase
progression via maintenance of cortical rigidity. FASEB J. 2019, 33, 5334–5349. [CrossRef] [PubMed]
14. Munira, S.; Yuki, R.; Saito, Y.; Nakayama, Y. ALK inhibitors-induced M phase delay contributes to the suppression of cell
proliferation. Cancers 2020, 12, 1054. [CrossRef] [PubMed]You can also read