Sublethal concentrations of clothianidin affect honey bee colony growth and hive CO2 concentration - Nature
←
→
Page content transcription
If your browser does not render page correctly, please read the page content below

www.nature.com/scientificreports
OPEN Sublethal concentrations
of clothianidin affect honey bee
colony growth and hive CO2
concentration
William G. Meikle1*, John J. Adamczyk2, Milagra Weiss1, Janie Ross2, Chris Werle2 &
Eli Beren1
The effects of agricultural pesticide exposure upon honey bee colonies is of increasing interest to
beekeepers and researchers, and the impact of neonicotinoid pesticides in particular has come under
intense scrutiny. To explore potential colony-level effects of a neonicotinoid pesticide at field-relevant
concentrations, honey bee colonies were fed 5- and 20-ppb concentrations of clothianidin in sugar
syrup while control colonies were fed unadulterated syrup. Two experiments were conducted in
successive years at the same site in southern Arizona, and one in the high rainfall environment of
Mississippi. Across all three experiments, adult bee masses were about 21% lower among colonies fed
20-ppb clothianidin than the untreated control group, but no effects of treatment on brood production
were observed. Average daily hive weight losses per day in the 5-ppb clothianidin colonies were about
39% lower post-treatment than in the 20-ppb clothianidin colonies, indicating lower consumption
and/or better foraging, but the dry weights of newly-emerged adult bees were on average 6–7%
lower in the 5-ppb group compared to the other groups, suggesting a nutritional problem in the 5-ppb
group. Internal hive CO2 concentration was higher on average in colonies fed 20-ppb clothianidin,
which could have resulted from greater CO2 production and/or reduced ventilating activity. Hive
temperature average and daily variability were not affected by clothianidin exposure but did differ
significantly among trials. Clothianidin was found to be, like imidacloprid, highly stable in honey in the
hive environment over several months.
Neonicotinoid pesticides have been suspected as a major factor in the decline in pollinator abundance, and
a global survey of honey samples has shown that the exposure of honey bees to neonicotinoid pesticides is
cosmopolitan1. Among neonicotinoid pesticides, thiamethoxam and its metabolite, clothianidin, are among
the most widely-used and pose the greatest risk for honey bees (Apis mellifera L.)2,3. Clothianidin exposure has
been found to affect honey bee grooming, hygienic behavior and neural gene expression4–6; memory p rocessing7;
drone semen q uality8; and has been associated with increased P450 gene e xpression9 indicating active detoxifica-
tion. Clothianidin has been found in some studies to increase worker m ortality10–12 and when combined with
λ-cyhalothrin was shown to affect adult bee weight9. Exposure of honey bees to clothianidin and nutritional
stress synergistically reduced bee survival and haemolymph sugar l evels13. Honey bees exposed to neonicotinoids
have been found to have higher Varroa and Nosema densities14–17 and reduced social immunity11. Imidacloprid,
perhaps the most heavily used neonicotinoid, has been shown to affect brood production, queen replacement, for-
aging activity and winter survivorship when applied at sublethal concentrations in pollen diet14. When applied at
a 5-ppb concentration in sugar syrup, imidacloprid has been found to affect honey bee colony thermoregulation
and adult bee m aturation18–20, and has significantly affected bumble bee colony behavior and t hermoregulation21.
Sublethal pesticide exposure may affect aspects of honey bee ecology and social organization, but in the case
of clothianidin, observations of negative impacts in managed manipulative field studies have not been consistent.
Different research groups have reported no effects of field-realistic concentrations of clothianidin on colony-level
growth or b ehavior22,23, or on colony winter s urvival24. A large-scale study in Germany in which bee colonies were
allowed to forage on oilseed crops treated with clothianidin found no effects on development of colony strength,
brood success, honey yield or levels of pathogen infection25. Similarly, a field study involving “mini-colonies”
1
Carl Hayden Bee Research Center, USDA-ARS, 2000 E. Allen Rd, Tucson, AZ 85719, USA. 2Thad Cochran Southern
Horticultural Laboratory, USDA-ARS, P.O. Box 287, Poplarville, MS 39470, USA. *email: william.meikle@usda.gov
Scientific Reports | (2021) 11:4364 | https://doi.org/10.1038/s41598-021-83958-8 1
Vol.:(0123456789)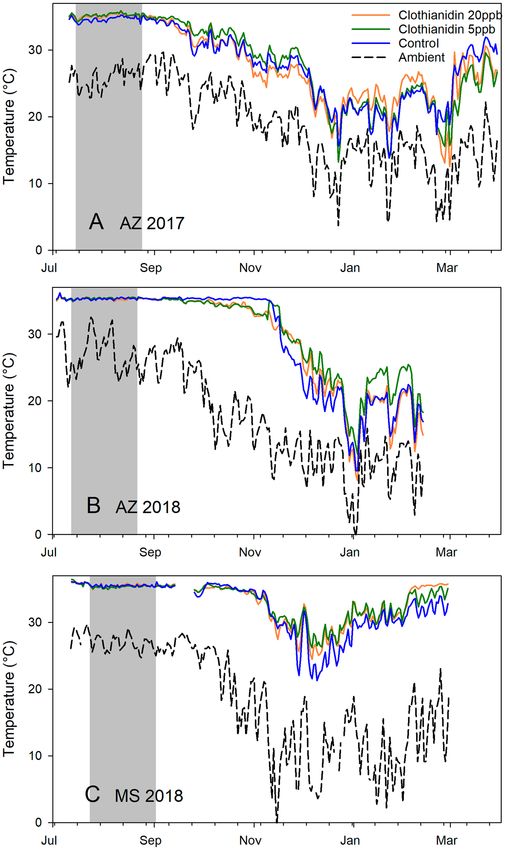
www.nature.com/scientificreports/
No. colonies
Experiment Start End No. assess NEB mass Hive weight Hive temp Hive [CO2] Pesticide residues Varroa levels
AZ 2017 18 12 5 Yes Yes Yes No Yes Yes
AZ 2018 18 7 5 Yes Yes Yes Yes Yes Yes
MS 2018 15 14 3 No Yes Yes No No Yes
Table 1. Overview of experimental design, colony survivorship and response variables. NEB newly emerged
bee. “Start” was defined as the beginning of the treatment period in mid-July; “End” was defined as February
12 of the following year; “No. assess.” means the number of colony assessments.
challenged with both Nosema and clothianidin found no effect of clothianidin treatment on mortality or flight
activity, and while the lifespans of Nosema infected bees were reduced compared to non-infected bees a combina-
tion of pesticide and pathogen did not reveal any synergistic effect26. Experiments with imidacloprid have also
had mixed results with respect to colony growth and t hermoregulation19,20,27.
One way to measure the impact of stressors such as pesticides on bee colonies is through the use of sensors,
here defined as devices that provide continuous data on physical parameters such as weight and temperature.
For example, continuous hive weight data show daily hive weight gain due to foraging, as well as changes in
colony resources due to food consumption, robbing or reproductive swarming28,29. Continuous hive tempera-
ture data show colony thermoregulation behavior due to the presence of brood, which require a temperature of
34–36 °C30,31, and to low ambient temperatures28,32. Colony thermoregulation can be affected by subspecies33,
within-colony genetic d iversity34, phenological s tatus35 and pesticide exposure20,21,36. Hive CO2 concentrations
are also controlled by honey bee colonies within the hive and exhibit strong changes on a daily basis37,38. When
concentrations of CO2, O2 and N2 within a hive were manipulated, only changes in CO2 provoked fanning
behavior within the colony39. By controlling CO2 concentration in bee hives, bees actively maintain a reversible
hypoxia and a reduced metabolic rate that, researchers hypothesized, allows them to conserve water and energy,
as well as increase activity on short n otice40. CO2 concentration is fundamentally different from measures such
as temperature and humidity in that, because bees produce (and cannot absorb) C O2, and do not produce any
other gases in sufficient quantity to displace appreciable amounts of CO2, hive CO2 concentrations are generally
equal to or higher than concentrations outside the hive.
To test the hypothesis that low concentrations of clothianidin can have measurable effects on bee colony
growth and behavior, honey bee colonies were fed with field-relevant concentrations (5 and 20-ppb) of clothia-
nidin in sugar syrup over approximately six weeks. The treatment was applied in in-hive feeders to simulate
pesticide exposure via nectar collection in the field. Exposure of the individual bees in a given colony would
vary- bee colonies typically have larvae and adults of different ages so some bees would only be exposed as adults,
some only as larvae, and some for their entire lives. Pesticide levels would be elevated in the stored honey so
essentially all the bees in treated colonies would have had some degree of exposure by the end of the experi-
ment. Treatment concentrations were based both on those used in previous studies on the exposure of bees to
neonicotinoids20,27 and on values reported from large-scale s urveys41. Acute oral LD50 of clothianidin to honey
bees is about 4 ng per bee (Pesticide Properties Database: https://sitem.herts.ac.uk/aeru/ppdb/en/atoz_insec
t.htm), or a single dose of about 200 mg of the 20-ppb syrup, which exceeds the maximum estimated daily intake
for even high-consumption nectar f oragers42.
Colony size, growth and behavior were monitored for several months post-treatment using sensors and hive
inspections, and avoiding methods that rely strictly on visual estimation. Colony size in terms of adult bee mass
and area of sealed brood (late instar larvae and pupae) was measured using a weight difference method and a
photograph analysis p rogram43. Colony growth was estimated from the daily hive weight change, and colony
behavior was observed by monitoring internal hive temperatures (i.e. thermoregulation), which have detected
sublethal pesticide effects in other s tudies20,28, and internal C O2 concentrations. Weather and landscape have
been found to play important roles in toxicological studies on bee c olonies44,45, so the experiment was conducted
twice (2017 and 2018) at a site in Arizona. A third experiment was conducted in Mississippi to determine whether
effects observed in Arizona were consistent in a very different environment. Some measurements were made
only at the Arizona site, including newly-emerged bee dry weight, hive C O2 concentration, and pesticide residue
concentrations in honey and wax.
Results
Two studies were conducted at the Santa Rita Experimental Range south of Tucson, AZ (31° 47′ 1.51ʺ N, 110°51′
37.39ʺ W). The first study ran from May 2017 to March 2018 (hereafter AZ 2017) and the second study, from
May 2018 to February 2019 (hereafter AZ 2018). The apiary was surrounded by unmanaged native plants, e.g.,
mesquite (Prosopis spp.), cactus (mostly Opuntia spp.), creosote (Larrea spp.) and wildflowers. No commercial
agriculture existed within 10 km of the apiary. The site had 286 mm of precipitation during AZ 2017 and 540 mm
during AZ 2018. Bee colonies were provided with a constant water source during both experiments, but low
rainfall inhibited flowering, reducing the nectar and pollen forage and colonies in AZ 2017 required supplemental
feeding in November. An additional study was conducted in Poplarville, MS (30° 50′ 2.59ʺ N, 89° 32′ 52.45ʺ W)
from May 2018 to March 2019 (hereafter MS 2018). The Mississippi site received 1395 mm rainfall during MS
2018. An overview of the response variables and data for all experiments is provided (Table 1).
Scientific Reports | (2021) 11:4364 | https://doi.org/10.1038/s41598-021-83958-8 2
Vol:.(1234567890)
www.nature.com/scientificreports/
Hive survivorship. No significant differences in hive survivorship were observed among treatment groups
(p = 0.55 for the 30th percentile, p = 0.38 for the 5 0th percentile, and p = 0.48 for the difference between the 30th
and 40th percentiles) (Fig. 1).
Syrup consumption. The amount of syrup offered to the colonies each year was partly a function of the
amount they consumed (that is, removed from the internal feeder). Colonies in AZ 2017 were offered a total of
30 kg syrup over 38 d and consumed on average 85 ± 3%, while colonies in AZ 2018 were offered 35 kg syrup
over 39 d and consumed on average 97 ± 1%. A comparison of syrup consumption between the two Arizona
experiments showed that colonies in AZ 2018 consumed significantly more than colonies did the previous year
(p < 0.001) but neither treatment group nor their interaction were significant. Colonies in MS 2018 were fed a
total of 36 kg syrup over 38 d and consumed it all.
Adult bee mass. Considering all three experiments, both treatment and experiment had significant effects
on adult bee mass for the 1st sampling occasion after the end of treatment, while the interaction term was not
significant (Fig. 2, Table 2, Supplementary Tables S1 and S2 online). Post hoc pairwise contrasts showed that
colonies in the clothianidin 20-ppb treatment had significantly lower adult bee mass (2.18 ± 0.14 kg) at that point
than colonies in the control treatment (average ± s.e.) (2.75 ± 0.17 kg). Pairwise contrasts did not detect any sig-
nificant differences among experiments at the p = 0.05 level. Restricting the analysis to the Arizona experiments,
treatment also had a significant effect across the 4 post-treatment hive evaluations (Supplementary Tables S3
and S4 online). However, post hoc pairwise contrasts did not reveal any significant differences at the p = 0.05
level among treatment groups, and the interaction between treatment and sampling occasion was not significant.
Brood surface area. Neither treatment nor experiment had significant effects on brood surface area, either
considering all experiments on the 1st sampling occasion after the end of treatment, or with across the 4 post-
treatment hive evaluations in Arizona (Fig. 3, Supplementary Tables S5 and S6 online). Brood production was
very low by October in AZ 2017.
Total food resources. The experiment factor had a significant effect on food resources, considering all
experiments on the 1st sampling occasion after the end of treatment, but treatment did not (Supplementary
Tables S7-S10 online). Pairwise post hoc contrasts showed that hives in the AZ 2017 experiment had signifi-
cantly fewer resources on average, when taking pre-treatment resources into account, then hives in either of the
other two experiments. Prior to treatment, hives in MS 2018 had 9.62 ± 0.99 kg food resources, hives in the AZ
2018 had 4.78 ± 0.41 kg and hives in AZ 2017 had on average of 4.06 ± 0.28 kg. Post-treatment, hives in MS 2018
had on average 21.85 ± 1.32 kg, hives in AZ 2018 had on average 16.36 ± 0.57 kg and hives in AZ 2017 had on
average 10.24 ± 0.68 kg. Comparing the two Arizona experiments across the three sampling occasions in the fall
(the February sampling occasion was omitted because of effects from the spring nectar flow), the experiment
factor was again significant while treatment was not, and average resources per hive were significantly higher in
AZ 2018 at all three sampling occasions.
Newly emerged bee (NEB) dry weight. Considering AZ 2017 and AZ 2018 together for August (the
only post-treatment sampling date included in both experiments), treatment was significant, while experiment
and the treatment x experiment interaction were not (Supplementary Tables S11 and S12 online). Pairwise con-
trasts showed that the NEB dry weights from the clothianidin 5-ppb group were about 6.1% smaller, on average
0.0186 g, than NEBs from the control group, on average 0.0198 g (p = 0.0440). Data for AZ 2018 included an
additional sampling occasion, so another analysis was conducted (Supplementary Tables S13 and S14 online). In
that analysis, treatment had a significant effect on NEB dry weight for the August and October samples (Fig. 4)
and neither sampling date nor the interaction term was significant. Post hoc contrasts also showed that average
NEB dry weight from the clothianidin 5-ppb treatment group was about 7.2% smaller than that of the con-
trol group (0.0189 g vs. 0.0204 g) (p = 0.0054) and 5.2% smaller than the clothianidin 20-ppb group (0.0200 g)
(p = 0.0310). The control and clothianidin 20-ppb groups were not significantly different.
Daily hive weight change. Considering all experiments during the post-treatment period from 1 Sept.
to 31 Oct. (the point at which colonies had largely ceased foraging), treatment did not have a significant effect
(p = 0.89) but the experiment factor did (p < 0.0001) as did the interaction term (p = 0.03) (Supplementary
Tables S15 and S16 online). Post hoc contrasts showed that colonies in AZ 2017 had significantly greater weight
loss, 187 ± 16 g/day, than those in AZ 2018, 9 ± 7 g/day, while colonies in MS 2018 gained 6 ± 3 g/day. Consider-
ing the two Arizona experiments from 1 Sept. to 31 Oct., treatment was found to have a significant effect on
daily weight change (p = 0.03) and the interaction of treatment and experiment was not significant, indicating
the effect was consistent between the two years (Fig. 5) (Supplementary Tables S17 and S18 online). Post hoc
contrasts showed that colonies fed 20-ppb clothianidin on average lost more weight per day post-treatment, on
average 127 ± 20 g than did colonies fed 5-ppb clothianidin, 90 ± 19 g. Control colonies, which lost on average
95 ± 16 g per day, were not significantly different from either group. Colonies in AZ 2017 lost much more weight
per day overall, on average 196 ± 19 g, than did colonies the following year, on average 13 ± 8 g per day. Daily hive
weight change in the winter (1 Dec.–31 Jan.) was not affected by treatment (Supplementary Table S19 online).
Hive temperature average and variability. The effects of treatment and experiment were measured
with respect to internal hive temperature and temperature amplitude for two periods: (1) from 1 Sept. to 31 Oct.,
Scientific Reports | (2021) 11:4364 | https://doi.org/10.1038/s41598-021-83958-8 3
Vol.:(0123456789)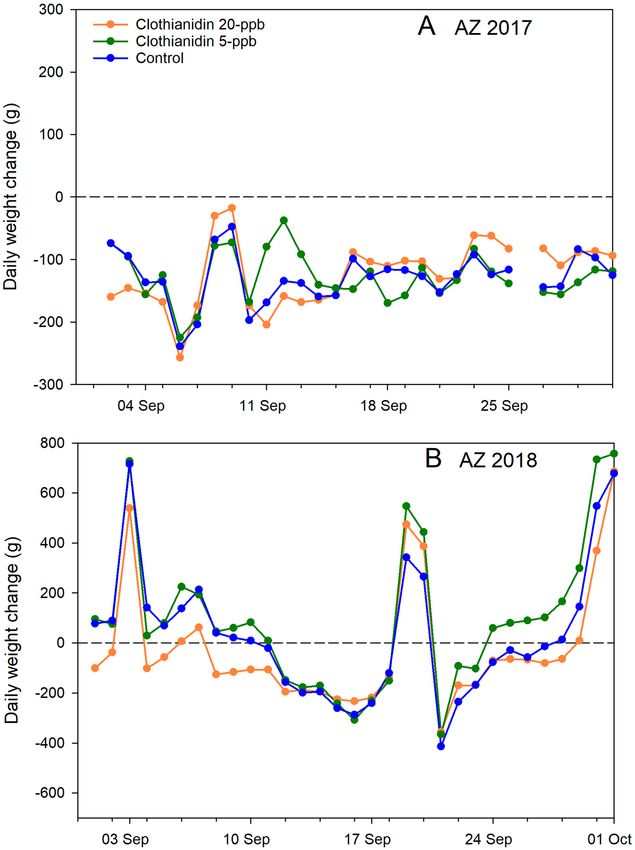
www.nature.com/scientificreports/

                                            Figure 1.  Honey bee colony survivorship from 1 Sept. to 15 April for each of the 3 treatment groups:
                                            Clothianidin 20-ppb (orange), clothianidin 5-ppb (green), control (blue) across 3 experiments. (A) AZ 2017; (B)
                                            AZ 2018; (C) MS 2018.

          Scientific Reports |   (2021) 11:4364 |               https://doi.org/10.1038/s41598-021-83958-8                                               4

Vol:.(1234567890)
www.nature.com/scientificreports/

                                  Figure 2.  Average adult bee mass (kg) per colony for each of 3 treatment groups: Clothianidin 20-ppb (orange),
                                  clothianidin 5-ppb (green), control (blue). (A) AZ 2017; (B) AZ 2018; (C) MS 2018. Boxes are defined as 1.58 *
                                  IQR/n0.5, where IQR is the inter-quartile range and n is the number of data points.

                                  to capture effects immediately after treatment during the active season, and (2) from 1 Nov. to 31 Dec., to capture
                                  effects as ambient conditions changed. Equipment failed from 12 to 25 Sept. in Mississippi so those dates were
                                  removed from the analysis. Treatment had no significant effect on average internal hive temperature (Fig. 6) or
                                  temperature variability (Fig. 7) but experiment did (Supplementary Tables S20-S27 online). Experiment as a fac-
                                  tor had a significant effect on average hive temperature and temperature amplitude from 1 Sept. to 31 Oct., but
                                  only amplitude was affected in the 1 Nov. to 31 Dec. dataset.

Scientific Reports |   (2021) 11:4364 |                https://doi.org/10.1038/s41598-021-83958-8                                                  5

                                                                                                                                              Vol.:(0123456789)
www.nature.com/scientificreports/
Response variable Datasets Sample periods (post treatment) Treatment Exp Treat. x Exp
Adult mass (kg) All 1st sample (Sept.) 0.0240 0.0180 0.1290
Adult mass (kg) AZ only Sept., Oct., Nov 0.0456 0.5053 0.5712
Brood area (cm2) All 1st sample (Sept.) 0.5131 0.2729 0.7098
Brood area (cm2) AZ only Sept., Oct., Nov 0.5532 0.1197 0.7798
Food resources (kg) All 1st sample (Sept.) 0.3724 < 0.0001 0.6879
Food resources (kg) AZ only Sept., Oct., Nov 0.4346 < 0.0001 0.2195
Daily hive wt. change (g/day) All 1 Sept. – 31 Oct 0.8908 < 0.0001 0.0324
Daily hive wt. change (g/day) AZ only 1 Sept. – 31 Oct 0.0301 < 0.0001 0.0759
Temperature average (°C) All 1 Sept. – 31 Oct 0.4084 < 0.0001 0. 7020
Temperature amplitude (°C) All 1 Sept. – 31 Oct 0.2159 < 0. 0001 0. 5664
NEB dry weight (g) AZ only Aug 0.0413 0.2485 0.1008
NEB dry weight (g) AZ 2018 only Aug., Oct 0.0046 – –
Log CO2 average (ppm) AZ 2018 only 1 Sept.– 31 Oct 0.0003 – –
Log CO2 amplitude (ppm) AZ 2018 only 1 Sept.– 31 Oct 0.0041 – –
Log Varroa fall per day AZ only Aug. – Nov 0.4160 < 0.0001 0.3474
Table 2. Summary of results for MANOVA analyses for treatment and experiment on different response
variables. “All” indicates that all three experiments were included in the analysis; “AZ only” indicates that
only the Arizona experiments were included. The covariates in all analyses were pre-treatment values of those
variables. Newly Emerged Bee (NEB) dry weight data were only collected in Arizona and C O2 data were only
collected in the AZ 2018 study. Numbers in bold indicate signficance at P < 0.05.
HIve CO2 concentration. Pre-treatment log CO2 average concentrations were significantly different among
treatment groups (p = 0.0283) while pre-treatment concentration amplitudes were not (p = 0.068). Colonies had
been ranked by adult bee mass and randomly assigned to groups, so the reason for these differences, which were
detected after the experiments, was unclear. As with other analyses in this study, average pre-treatment values
were used as covariates in the analysis of post-treatment data to control for pre-existing differences. Treatment
had a significant effect (p = 0.0003) on average CO2 concentrations within the hive for at least the first two
months after the end of the treatment period, from 1 Sept. to 31 Oct. (Figs. 8, 9, Supplementary Tables S28
and S29 online). Pairwise contrasts indicated that hives in the clothianidin 20-ppb treatment group had sig-
nificantly higher CO2 concentration, 5002 ± 140 ppm, than either the clothianidin 5-ppb group, 3386 ± 91 ppm,
(p = 0.0002) or the control group, 4109 ± 136 ppm (p = 0.0140). Treatment also affected CO2 concentration vari-
ability (amplitude) (p = 0.0041). Daily amplitudes within the hives ranged across treatment groups from 1933 to
2441 ppm, whereas amplitudes of ambient CO2 averaged 49 across the same time period.
Varroa density. Varroa mite fall per hive was not affected by treatment group either in the AZ 2017 (p = 0.48)
or AZ 2018 (p = 0.82) experiments (Table 3, Supplementary Table S30 online).
Pesticide residue analyses. Residues in honey other than clothianidin were limited to thymol and trace
amounts of 2,4-dimethylphenyl formamide (2,4-DMPF) in one sample (Table 4). Wax samples had many com-
pounds but the residue concentrations were very low compared to acute contact LD50 (Supplementary Table S31
online).
Landscape analysis of Mississippi apiary. Analysis of the Poplarville, MS, landscape using CropScape
yielded the usage patterns within about 1.8 km of the apiary (Supplementary Table S32 online), or an area of
about 1018 ha. Agriculture (soybeans, corn, cotton, non-alfalfa hay, sweet potatoes and grass seed production)
covered about 0.3% of the area, or about 3.1 ha. Uncultivated land, including forest, shrubland, wetland and pas-
ture, covered 72.5% of the area. The remaining area, 27.2% of the total, was classified as “developed” to varying
degrees, or open water.
Discussion
The objective of this study was to compare honey bee colony size, growth and behavior among groups subjected
to sublethal concentrations of clothianidin over three trials, including two conducted in consecutive years at the
same site in Arizona and another conducted at a site in Mississippi. Response variables in all three trials included
discrete measurements, i.e. adult bee mass, brood levels, and food resources, as well as continuous measurements,
i.e. hive weight and internal hive temperature. Both treatment group and experiment (year and location) were
used as factors in the analyses of those data. Two response variables, newly-emerged bee (NEB) weights and
hive CO2 concentration, were collected only at the Arizona site. Clothianidin exposure had a significant impact
on adult bee mass across all three rials at the first sampling occasion post-treatment, and colonies fed 20-ppb
clothianidin had, on average, about 0.5 kg fewer adult bees, or about 21% less, than did those in the control group.
Fewer adult bees would result in lower food consumption, and likely reduced foraging. However, clothianidin
Scientific Reports | (2021) 11:4364 | https://doi.org/10.1038/s41598-021-83958-8 6
Vol:.(1234567890)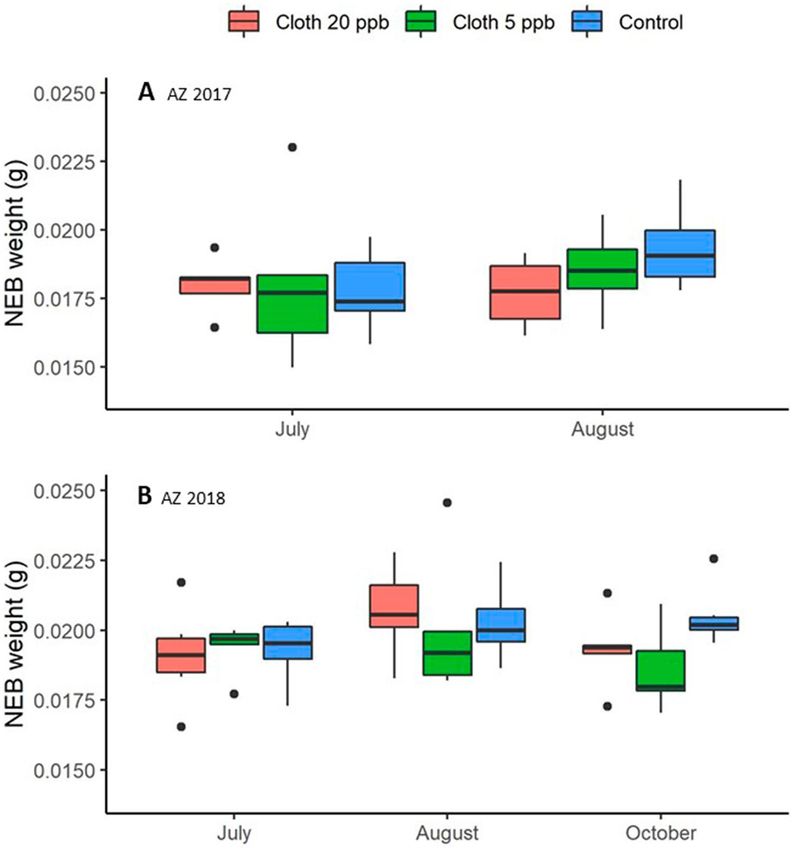
www.nature.com/scientificreports/
Figure 3. Average brood surface area ( cm2) per colony for each of 3 treatment groups: Clothianidin 20-ppb
(orange), clothianidin 5-ppb (green), control (blue). (A) AZ 2017; (B) AZ 2018; (C) MS 2018. Boxes are defined
as 1.58 * IQR/n0.5, where IQR is the inter-quartile range and n is the number of data points.
exposure did not have a significant effect on brood levels, food resources, daily hive weight change, or on average
hive temperature or temperature variability.
Part of the difficulty in detecting treatment effects across all three trials may have been due to environmental
variability between years and sites. The Arizona site was higher (about 1100 m) than the Mississippi site (95 m).
Only 286 mm of precipitation fell during AZ 2017, reducing bee forage that year, while almost twice as much
fell during AZ 2018 and almost 5 times as much fell during MS 2018. Between the pre-treatment hive inspection
and the first post-treatment inspection, colonies in MS 2018 gained on average about 12.2 kg in food resources
and colonies in AZ 2018 gained about 11.6 kg, compared to colonies in AZ 2017 which gained only about 6.2 kg.
Hives in AZ 2017 also lost over 180 g per day on average for the first two months post-treatment, while hives
Scientific Reports | (2021) 11:4364 | https://doi.org/10.1038/s41598-021-83958-8 7
Vol.:(0123456789)
www.nature.com/scientificreports/
Figure 4. Average Newly Emerged Bee (NEB) dry weights for each of 3 treatment groups: Clothianidin 20-ppb
(orange), clothianidin 5-ppb (green), control (blue). (A) AZ 2017 (2 sampling dates); (B) AZ 2018 (3 sampling
dates). Boxes are defined as 1.58 * IQR/n0.5, where IQR is the inter-quartile range and n is the number of data
points.
in AZ 2018 lost only 6 g per day on average and hives in MS 2018 gained 6 g per day. Poor forage in AZ 2017
likely affected residue concentrations in the stored honey. Clothianidin was stable in honey for several months
after the end of treatment, as has been found with imidacloprid27, and clothianidin residues in stored honey
were much higher in AZ 2017 than the following year, suggesting less dilution from alternative nectar sources
and a higher dose per bee.
Environmental factors also significantly affected internal hive temperature. Average daily hive temperatures
were significantly lower for two months post-treatment in AZ 2017 compared to the other trials. Daily tempera-
ture amplitudes, reflecting variability, were significantly lower for colonies in Mississippi than colonies in Arizona
for up to four months post-treatment, indicating more stable temperatures in the Mississippi hives. Treatment
had no measurable effect on hive temperature.
In an effort to reduce variability and exploit the data further for treatment effects, further analyses focused
on the Arizona trials. In Arizona, clothianidin exposure significantly affected adult bee mass, although post hoc
comparisons were not significant. Lower adult bee numbers may have played a role in the hive weight data in
Arizona; colonies fed 20-ppb clothianidin lost significantly more weight, 127 g per day on average, over two
months post-treatment, than colonies fed 5-ppb clothianidin, 90 g per day. Lower daily hive weight loss in the
5-ppb group indicated either better foraging, reduced consumption or some combination of the two, compared
to the 20-ppb group. Neither brood levels nor food resource levels were different between the two Arizona trials.
The dry weight of NEBs, measured only in Arizona, was about 6–7% lower for the 5-ppb treatment group
than the control group, and was consistent across two years. The lower weight may have been due to lower
consumption as larvae (NEBs were collected before they could feed as adults) or other factors. Low adult body
weight has been associated with nutritional d eficiencies43. Similar results have been observed in a study involv-
ing foragers exposed as larvae to clothianidin at about the same c oncentrations4. One possibility, although not
Scientific Reports | (2021) 11:4364 | https://doi.org/10.1038/s41598-021-83958-8 8
Vol:.(1234567890)
www.nature.com/scientificreports/
Figure 5. Average colony daily weight change (g) for each of 3 treatment groups: Clothianidin 20-ppb (orange),
clothianidin 5-ppb (green), control (blue) for the month of September for 2 experiments. (A) AZ 2017; (B) AZ
2018.
investigated here, is that some treatment effects may be due to hormesis, defined as a change in the shape of
the dose–response curve at low, sublethal concentrations of toxic compounds46,47 and thought to be rooted in
oxidative stress protective m echanisms48. Effects observed at lower concentrations may be different to those
observed at higher concentrations. For example, while high concentrations of nicotine, which attacks the same
Scientific Reports | (2021) 11:4364 | https://doi.org/10.1038/s41598-021-83958-8 9
Vol.:(0123456789)www.nature.com/scientificreports/
Figure 6. 24 h running average internal hive temperature (°C) per hour for each of 3 treatment groups:
Clothianidin 20-ppb (orange), clothianidin 5-ppb (green), control (blue) compared to ambient temperatures
(black) across 3 experiments. The gray area shows the treatment period. (A) AZ 2017; (B) AZ 2018; (C) MS
2018.
Scientific Reports | (2021) 11:4364 | https://doi.org/10.1038/s41598-021-83958-8 10
Vol:.(1234567890)www.nature.com/scientificreports/
Figure 7. Average daily amplitudes of sine curves fit to within-day temperature changes per day (see text for
details) for each of 3 treatment groups: Clothianidin 20-ppb (orange), clothianidin 5-ppb (green), control (blue)
across 3 experiments. The gray area shows the treatment period. (A) AZ 2017; (B) AZ 2018; (C) MS 2018.
Scientific Reports | (2021) 11:4364 | https://doi.org/10.1038/s41598-021-83958-8 11
Vol.:(0123456789)www.nature.com/scientificreports/
Figure 8. Average CO2 concentrations per treatment group for 5 days immediately after the end of treatment
for each of 3 groups: Clothianidin 20-ppb (orange), clothianidin 5-ppb (green), and control (blue) for the AZ
2018 experiment.
acetylcholine receptors as clothianidin, reduce honey bee colony survival, low concentrations have been found
to improve honey bee short term memory and s urvival49,50.
Hive CO2 concentration was monitored in AZ 2018 as an indicator of colony-level organization. Hive C O2
concentrations are generally higher and more variable compared to ambient conditions; in Arizona hive CO2
concentrations averaged > 3700 ppm across all hives while ambient values averaged 409 ppm, and concentra-
tions varied on average > 1900 ppm (often > 5000 ppm) while ambient values varied about 49 ppm. Managing
CO2 levels is an important colony function; elevated C O2 concentrations can affect honey bee memory, ovary
development and gene e xpression51,52. Treatment affected hive C O2 concentrations; average concentrations in the
20-ppb group were about 22% higher compared to the control group for two months after treatment. Since hive
concentration depends on CO2 production as well as ventilation, colonies in the 20-ppb group either produced
more CO2, or did not ventilate the hive the same way, or both. Daily variability in C O2 concentration was also
higher in the 20-ppb group, at least compared to the 5-ppb group, suggesting that colonies in the 20-ppb group
may have also ventilated more. Significant differences among groups were also observed before treatment, and
although pre-treatment values were used as covariates to control for those differences, why those differences
existed was not clear.
Environmental variability among experiments may have made effects due to pesticide exposure harder to
detect. Results from MS 2018 were consistent with studies conducted in the southern half of the U.S. that have
shown higher growth rates, better thermoregulation and lower pathogen loads for bee colonies kept in landscapes
with some agriculture compared to those kept in other landscapes (urban, peri-urban, or completely unmanaged,
depending on the study)53–55. The amount of agriculture within a 1.8 km radius of the Mississippi site was not
high, but the density and diversity of honey bee forage was clearly higher than in southern Arizona. In contrast,
other studies conducted in northern U.S. have found that honey bee colonies exposed to commercial agriculture
reported higher levels of detoxification enzymes and poorer thermoregulation compared to colonies kept on
non-agricultural Conservation Reserve Program l and56,57.
These results indicate that, considering all three experiments, exposure to a 20-ppb concentration of clothia-
nidin reduced average adult bee mass per colony by about 21% but had no significant effects on brood levels,
food resources or thermoregulation. Considering only the Arizona trials, significant effects were observed with
respect to adult bee mass, daily hive weight change, NEB weights and C O2 concentration. Some results were
more difficult to interpret: daily hive weight loss in the fall was about 41% higher in colonies exposed to 20-ppb
clothianidin than those exposed to 5-pbb clothianidin, but neither group was different from the control, and
NEB weights were affected by a 5-ppb clothianidin exposure but not by a 20-ppb exposure. Those results sug-
gest that the dose–response curve may change at low concentrations. Continuous data gathered over several
months, such as hive weight and internal temperature, were easier to harmonize for analysis than discrete data
that depended on similar hive assessment dates, and were statistically powerful due to frequent sampling. It is
hoped that gathering more different kinds of data, particularly on the colony level, might provide further clues
in understanding the relationships among bees, stressors and landscapes.
Scientific Reports | (2021) 11:4364 | https://doi.org/10.1038/s41598-021-83958-8 12
Vol:.(1234567890)www.nature.com/scientificreports/
Figure 9. Running average C O2 concentrations, and daily amplitudes of sine curves fit to within-day C
O2
concentration changes per day (see text for details), for each of 3 treatment groups: Clothianidin 20-ppb
(orange), clothianidin 5-ppb (green), and control (blue) for the AZ 2018 experiment. The gray area shows the
treatment period. (A) 24 h running average; (B) daily amplitudes.
Conclusions
1. Exposure of bee colonies to 20-ppb in sugar syrup clothianidin reduced average adult bee mass per colony
by 21% and increased within-hive C O2 concentration by about 22%, compared to control colonies;
2. Exposure of colonies to a 5-ppb clothianidin concentration reduced NEB dry weight, but exposure to 20-ppb
had no measurable effect;
Scientific Reports | (2021) 11:4364 | https://doi.org/10.1038/s41598-021-83958-8 13
Vol.:(0123456789)www.nature.com/scientificreports/
AZ 2017 AZ 2018 MS 2018
Treatment July October July October November May
Clothianidin 20-ppb 2.7 ± 0.9 7.8 ± 4.2 3.9 ± 1.3 18.7 ± 7.1 17.5 ± 6.7 8.9 ± 8.1
Clothianidin 5-ppb 2.0 ± 0.8 19.8 ± 11.6 3.4 ± 1.7 16.9 ± 6.7 37.1 ± 12.9 3.7 ± 1.1
Control 1.5 ± 0.7 15.3 ± 10.0 6.6 ± 2.3 14.3 ± 4.1 38.0 ± 18.7 5.6 ± 1.9
Table 3. Mite infestations per experiment. Mite levels in the two Arizona experiments were calculated as the
number of mites fallen per colony per day; mite levels in the MS 2018 experiment were calculated as number
of mites per 100 bees from samples of 300 bees.
Clothianidin
Year Treatment group Matrix Thymol July August November February
Cloth_20 Honey 15 0 153 107 103
Cloth_05 Honey 23 0 42 34 18
2017 Control Honey 89* 0 0 0 0
Cloth_20 Syrup 46
Cloth_5 Syrup 12
Cloth_20 Honey 55 0 22 12 7
Cloth_05 Honey – 0 trace trace 0
2018 Control Honey – 0 0 0 0
Cloth_20 Syrup 33
Cloth_5 Syrup 12
Table 4. Concentrations of clothianidin and thymol in honey and syrup samples across treatment groups for
the two experiments in Arizona. Values are parts per billion. *Trace amounts of 2,4-DMPF were also detected.
3. Hive temperature profiles were not significantly affected by clothianidin exposure but did differ significantly
among replicate trials, likely due to environmental differences; and
4. Clothianidin was very stable in honey within the hive over at least 6 months.
Materials and methods
Syrup preparation. Control (0 ppb clothianidin) sucrose solution was mixed at 1:1 w:w (e.g. 500 g
sucrose:500 mL distilled water). Sucrose was added to distilled water in a 5-gallon bucket and mixed using an
electric drill with a mortar mixing attachment until sugar was completely dissolved. Sucrose solution for solu-
tions with clothianidin (PESTANAL, CAS# 210880-92-5) was mixed in the same manner but 50 mL was with-
held (thus “short”) to allow for the added volume of respective clothianidin spikes. 500 g of sugar is dissolved in
450 mL of distilled water to allow for the addition of a 50 mL spike to achieve 1 kg of treatment solution. 950 g
of “short” sugar solution was transferred to a Nalgene bottle, then the spike added to each individual bottle. A
10 ppm clothianidin stock solution was made by dissolving 1.0 mg of clothianidin, in 100 mL of distilled water,
using a mixing bar but without heat. To avoid problems with static electricity, the clothianidin was weighed into
a small, nonreactive plastic receptacles and those receptacles were placed in the solution, the solution stirred,
and the receptacles removed after confirming the clothianidin had dissolved. For the 5-ppb solution: 0.5 mL of
the stock solution was mixed into 49.5 mL of distilled water to achieve 50 mL of spike solution, which was then
added to 950 g of the short sucrose solution to achieve 1 kg of 5-ppb clothianidin syrup. For the 20-ppb solution
(only in 2nd experiment) 2.0 mL of stock solution was mixed into 48.0 mL of distilled water, and that solution
added to 950 g of the short solution to achieve 1 kg of 20-ppb clothianidin syrup.
AZ 2017 experiment. On 20 April, 2017, 24 bee colonies were established from packages of Italian honey
bees (A. mellifera ligustica) (C.F. Koehnen & Sons, Inc., Glenn, CA 95,943) of approximately 1 kg honey bees in
painted, 10-frame, wooden Langstroth boxes (43.7 l capacity) (Mann Lake Ltd., Hackensack, MN) with migra-
tory wooden lids. At establishment, each colony was given 4 full or partial frames of capped honey, 2 frames
of drawn but empty comb, 2 frames of partially drawn with some capped honey, 3 frames of foundation and
a 1-frame feeder. Queens were marked, and during the course of the studies any queen replacements, such
as for supersedure queens, was done with queens from the same breeder. Hives were placed on stainless steel
electronic scales (Tekfa model B-2418 and Avery Weigh-Tronix model BSAO1824-200) (max. capacity: 100 kg,
precision: ± 20 g; operating temperature: − 30 °C to 70 °C) and linked to 16-bit dataloggers (Hobo UX120-006 M
External Channel datalogger, Onset Computer Corporation, Bourne, MA) with weight recorded every 5 min.
The scales were powered by deep-cycle batteries connected to solar panels. The system had an overall precision
of approximately ± 20 g. Hives were arranged in a circular pattern around a central box that contained the batter-
ies and electronic gear. Hives within such a group were 0.5- 1 m apart and groups were > 3 m apart. During the
Scientific Reports | (2021) 11:4364 | https://doi.org/10.1038/s41598-021-83958-8 14
Vol:.(1234567890)www.nature.com/scientificreports/
course of the experiments the power systems had occasional malfunctions, resulting in short periods of missing
data for some hives.
Colonies were all fed 2 kg sugar syrup (1:1 w:w) and 250 g pollen patty, made at a ratio of 1: 1: 1 corbicular pol-
len (Great Lakes Bee Co.): granulated sugar: drivert sugar (dry fondant sugar with approximately 8% invert sugar)
(Domino Foods, Yonkers, NY). On 10 July a temperature sensor (iButton Thermochron, precision ± 0.06 °C)
enclosed in plastic tissue embedding cassettes (Thermo Fisher Scientific, Waltham, MA) was stapled to the center
of the top bar on the 5th frame in the bottom box of each hive and set to record every 15 min. The same day,
pieces of slick paperboard coated with petroleum jelly and covered with mesh screens were inserted onto the
hive floor to monitor Varroa mite fall within the h ive58. The boards were removed 2 days later, and the number
of mites counted on each board. Infestation levels of Varroa were again monitored during and post-treatment.
Colonies were treated with amitraz (Apivar, Arysta LifeScience America Inc., New York, NY) on 19 October.
Hives were assessed on 12 July, and approximately every 5–6 weeks thereafter until November, the again 13
February 2020 and finally on 29 March using a published p rotocol21,28. Briefly, the hive was opened after the
application of smoke, and each frame was lifted out sequentially, gently shaken to dislodge adult bees, photo-
graphed using a 16.3 megapixel digital camera (Canon Rebel SL1, Canon USA, Inc., Melville, NY), weighed on
a portable scale (model EC15, OHaus Corp., Parsippany, NJ), and replaced in the hive. Frame photographs were
analyzed later in the laboratory (see below). During this first assessment (but not subsequent assessments), all
hive components (i.e. lid, inner cover, box, bottom board, frames, entrance reducer, internal feeder) were also
shaken free of bees and weighed to yield an initial mass of all hive components. At the initial inspection, 3–5 g of
wax and honey were collected from each hive into 50 ml centrifuge tubes and stored at − 80 °C; samples collected
in September, prior to treatment, were pooled and subjected to a full panel analysis for residues of pesticides
and fungicides, from all major classes, by the Laboratory Approval and Testing Division, Agricultural Market-
ing Service, USDA. Wax samples were collected only at the initial assessment in order to establish a baseline
exposure—the lack of agriculture or landscaping within foraging distance excluded the possibility of further
exposure. Honey samples from later assessments were pooled within treatment group and subjected only to
neonicotinoid residue analysis.
Newly-emerged bees (NEBs) were sampled by pressing an 8 cm × 8 cm × 2 cm cage of wire mesh into a section
of capped brood, then returning the following day to collect NEBs that had emerged within the cage over the
previous 24 h. The NEBs were then placed in a 50 mL centrifuge tube, frozen on dry ice, and stored at − 80 °C.
At the laboratory, 5 bees per hive per assessment date were placed in Eppendorf tubes, weighed, dried for 72 h
at 60 °C, then re-weighed to determine average wet and dry weight per bee. NEBs were collected on 12 July and
24 August 2017 (brood levels were too low in October 2017 for sampling).
After the first assessment, hives were ranked with respect to adult bee mass and then randomly assigned to
treatment group, ensuring that the average bee masses per group were approximately equal and after eliminat-
ing assignments that resulted in excessive spatial clumping of the colonies. Just prior to treatment all broodless
frames containing honey and/or pollen were replaced with frames of empty drawn comb collected earlier from
the same apiary. Colonies were then fed 2–3 kg syrup twice per week from 14 July to 21 August, with clothianidin
concentrations depending on their treatment group. Syrup consumption per colony was recorded. Hives were
assessed approximately every 5–6 weeks thereafter until November, and again in February and March. At each of
those subsequent assessments, the same protocol was followed but only the frames, hive lid and inner cover were
weighed. The hive lid and inner cover weights were compared to previous values and used to correct for moisture
content changes in the hive components and improve estimates of adult bee mass. Food resources in the colonies
were very low by mid-November so all colonies were provided with an additional 2 kg sugar syrup at that time.
AZ 2018 experiment. The 2017–2018 experiment was conducted in the same manner, with the same or
similar equipment and using the same bee suppliers. Varroa mite fall onto adhesive boards was monitored 6–9
July, and hives were assessed and sampled on 5 July in the same manner as before. NEBS were sampled on 6 July,
23 August and 4 October, 2018. CO2 probes (Vaisala Inc., Helsinki, Finland), calibrated for 0–20% concentra-
tions, were installed in five hives in each treatment group and set to record CO2 concentration every 5 min.
Colonies were fed 3 kg sugar syrup twice per week from 12 July to 20 August with the same pesticide concentra-
tions as the previous year and assessed as before, with the experiment ending in February. Varroa infestation
levels were monitored at the end of August and again at the beginning of November. Colonies were treated with
amitraz (Apivar) on 19 October. Unlike the previous year, colonies were found to have sufficient resources to last
to spring and so they were not fed any additional syrup after the treatment period.
MS 2018 experiment. Full bee colonies, each comprised of two “deep” boxes as described above, were
obtained from a local bee supplier (Gunter Apiaries, Lumberton MS) as nucleus colonies the previous year.
Queens were bred locally and subspecies was unspecified. Colonies were placed on hive scales (Tekfa model B-2418) on 16 May 2018.
Colonies were assessed, using the methods described above, on 11 July 2018 and temperature sensors (iButtons)
were installed on 12 July 2018. Frames of honey were removed on 18 July and colonies were randomly placed in
treatment groups. Treatment feeding commenced 24 July, lasting 31 August, using the same concentrations and
amounts as described above. Colonies were not fed pollen patty because sufficient pollen was available. Colonies
were assessed again 18 September 2018 and finally on 27 March 2019. Samples of 300 bees were collected on 7
May 2018, washed in 70% ethanol and the Varroa mites counted. Colonies were treated for Varroa (Checkmite,
Mann Lake Ltd) on 28 June 2018. The apiary site was assessed using the National Agricultural Statistical Service
(NASS) Cropscape web site (https://nassgeodata.gmu.edu/ CropScape) to obtain acreage estimates for all land
use categories within an approximately 1.8 km radius of the apiary. Bees can forage beyond that distance; the
radius was chosen to provide a sufficient area (> 1000 ha) to be representative of the forage available to the bees.
Scientific Reports | (2021) 11:4364 | https://doi.org/10.1038/s41598-021-83958-8 15
Vol.:(0123456789)www.nature.com/scientificreports/
Data analysis. The total weight of the adult bee population was calculated by subtracting the combined
weights of hive components (i.e. lid, inner cover, box, bottom board, frames, entrance reducer, internal feeder)
obtained at the start of the experiment (model EC15, OHaus) from the total hive weight recorded the midnight
prior to the inspection. The area of sealed brood per frame was estimated from the photographs using ImageJ
version 1.47 software (W. Rasband, National Institutes of Health, USA) or CombCount59; this method has been
described elsewhere20,28. Food resources in the colonies were calculated as the total frame weight, less (1) the
mass of the brood (calculated at 0.77 g/cm2) and (2) the mass of an empty frame of drawn comb (555 g)28.
Honey bee colony survivorship was analyzed using Proc LifeReg (SAS Inc. 2002). Survivorship curves were
generated for each treatment group within each experiment. Treatments compared using ANOVA (α = 0.05)
(Proc Glimmix, SAS Inc. 2002), with experiment as a random factor, with respect to three parameters: (1) the
30th percentile; (2) the 50th percentile; and 3) a shape variable calculated by subtracting the 40th from the 30th
percentile.
Daily hive weight change was calculated as the difference between the weight at midnight of a given day to
the weight 23 h 55 min later. Continuous temperature data were divided into daily average data and within-day
detrended data. Detrended data were obtained as the difference between the 24 h running average and the raw
data. Sine curves were fit to 3-day subsamples of the detrended data, taken sequentially by d ay28. Curve ampli-
tudes, representing estimates of daily variability, were reduced to a data point every 3 days, to ensure no overlap
between data subsamples, for repeated measures MANOVA analyses. C O2 concentration data were treated in
the same fashion.
Adult bee masses , brood surface area, and total food resources for the 1st sampling occasion after treatment
were analyzed across all three experiments using ANOVA (Proc Glimmix, SAS Inc. 2002). Further analyses
were conducted among the Arizona experiments across multiple sampling occasions using repeated-measure
MANOVA (Proc Glimmix, SAS Inc. 2002). A similar approach was taken with newly-emerged bee weights, i.e.
initial analysis across AZ 2017 and AZ 2018 using ANOVA for a single sampling occasion, then for AZ 2018
using MANOVA across two sampling occasions. Daily hive weight change, internal hive temperature average
and variability (i.e. amplitudes of fit sine curves) and C O2 concentration average and variability were used as
response variables in repeated-measures MANOVA with treatment, sampling date, experiment and day, and all
2-way interactions, as fixed effects and with pre-treatment values as a covariate to control for pre-existing differ-
ences. Proc Univariate was used with all response variables to inspect the data for normality. Log transformations
were conducted where necessary to improve normality. Analyses of hive weight and temperature were limited
to approximately 3 months after the end of treatment to focus on the active season, and consisted of omnibus
tests that initially included all three field experiments followed by analyses within each experiment. The reason
for this is that effects that are significant in one trial might not be so in another, or might be significant but in a
contrary fashion. CO2 concentration data were only collected in AZ 2018.
NEB data were analyzed with Treatment, Sampling date and their interaction, with the July values as a covari-
ate. Varroa fall were analyzed within each Arizona experiment, with the pre-treatment values used as covariates
where applicable. Varroa alcohol wash data for MS 2018 were analyzed separately.
Rainfall, and ambient temperature and C O2 data, were obtained for the Arizona site: AmeriFlux US-SRM
Santa Rita Mesquite, https://doi.org/10.17190/AMF/1246104; and temperature and rainfall data for Mississippi:
National Environmental Satellite, Data, and Information Service, National Oceanic and Atmospheric Adminis-
tration, Poplarville Experimental Station, MS US USC00227128.
Data availability
All raw data on hive assessment, temperature and weight are available in the Supplementary File online.
Received: 7 August 2020; Accepted: 19 January 2021
References
1. Mitchell, E. A. D. et al. A worldwide survey of neonicotinoids in honey. Science 358(6359), 109–111. https://doi.org/10.1126/scien
ce.aan3684 (2017).
2. Casida, J. E. Neonicotinoids and other insect nicotinic receptor competitive modulators: progress and prospects. Annu. Rev.
Entomol. 63, 125–144. https://doi.org/10.1146/annurev-ento-020117-043042 (2018).
3. Sanchez-Bayo, F. & Goka, K. Pesticide residues and bees: a risk assessment. PLoS ONE 9(4), e94482. https://doi.org/10.1371/journ
al.pone.0094482 (2014).
4. Morfin, N., Goodwin, P. H., Correa-Benitez, A. & Guzman-Novoa, E. Sublethal exposure to clothianidin during the larval
stage causes long-term impairment of hygienic and foraging behaviours of honey bees. Apidologie 50(5), 595–605. https://doi.
org/10.1007/s13592-019-00672-1 (2019).
5. Morfin, N., Goodwin, P. H., Hunt, G. J. & Guzman-Novoa, E. Effects of sublethal doses of clothianidin and/or V. destructor on
honey bee (Apis mellifera) self-grooming behavior and associated gene expression. Sci. Rep. 9(1), 5196. https://doi.org/10.1038/
s41598-019-41365-0 (2019).
6. Morfin, N., Goodwin, P. H. & Guzman-Novoa, E. Interaction of field realistic doses of clothianidin and Varroa destructor parasit-
ism on adult honey bee (Apis mellifera L.) health and neural gene expression, and antagonistic effects on differentially expressed
genes. PLoS ONE 15(2), e0229030. https://doi.org/10.1371/journal.pone.0229030 (2020).
7. Tison, L., Rößner, A., Gerschewski, S. & Menzel, R. The neonicotinoid clothianidin impairs memory processing in honey bees.
Ecotoxicol. Environ. Saf. 180, 139–145. https://doi.org/10.1016/j.ecoenv.2019.05.007 (2019).
8. Abdelkader, F. B. et al. Effects of clothianidin on antioxidant enzyme activities and malondialdehyde level in honey bee drone
semen. J. Apicult. Res. 58(5), 740–745. https://doi.org/10.1080/00218839.2019.1655182 (2019).
9. Yao, J., Zhu, Y. C. & Adamczyk, J. Responses of honey bees to lethal and sublethal doses of formulated clothianidin alone and
mixtures. J. Econ. Entomol. 111(4), 1517–1525. https://doi.org/10.1093/jee/toy140 (2018).
10. Samson-Robert, O., Labrie, G., Chagnon, M. & Fournier, V. Planting of neonicotinoid-coated corn raises honey bee mortality and
sets back colony development. PeerJ 8, 3670. https://doi.org/10.7717/peerj.3670 (2017).
Scientific Reports | (2021) 11:4364 | https://doi.org/10.1038/s41598-021-83958-8 16
Vol:.(1234567890)www.nature.com/scientificreports/
11. Tsvetkov, N. et al. Chronic exposure to neonicotinoids reduces honey bee health near corn crops. Science 356(6345), 1395–1397.
https://doi.org/10.1126/science.aam7470 (2017).
12. Zhu, Y. C. et al. Spray toxicity and risk potential of 42 commonly used formulations of row crop pesticides to adult honey bees
(Hymenoptera: Apidae). J. Econ. Entomol. 108(6), 2640–2647. https://doi.org/10.1093/jee/tov269 (2015).
13. Tosi, S., Nieh, J. C., Sgolastra, F., Cabbri, R. & Medrzycki, P. Neonicotinoid pesticides and nutritional stress synergistically reduce
survival in honey bees. Proc. R. Soc. B Biol. Sci. 284, 1869. https://doi.org/10.1098/rspb.2017.1711 (2017).
14. Dively, G. P., Embrey, M. S., Kamel, A., Hawthorne, D. J. & Pettis, J. S. Assessment of chronic sublethal effects of imidacloprid on
honey bee colony health. PLoS ONE 10(3), e0118748. https://doi.org/10.1371/journal.pone.0118748 (2015).
15. Alaux, C. et al. Interactions between Nosema microspores and a neonicotinoid weaken honeybees (Apis mellifera). Environ.
Microbiol. 12, 774–782 (2010).
16. Collison, E., Hird, H., Cresswell, J. & Tyler, C. Interactive effects of pesticide exposure and pathogen infection on bee health: a
critical analysis. Biol. Rev. 91(4), 1006–1019. https://doi.org/10.1111/brv.12206 (2015).
17. Pettis, J. S., vanEngelsdorp, D., Johnson, J. & Dively, G. Pesticide exposure in honey bees results in increased levels of the gut
pathogen Nosema. Naturwissenschaften 99, 153–158 (2012).
18. Colin, T., Meikle, W. G., Paten, A. M. & Barron, A. B. Long-term dynamics of honey bee colonies following exposure to chemical
stress. Sci. Total Environ. 667, 660–670. https://doi.org/10.1016/j.scitotenv.2019.04.402 (2019).
19. Colin, T., Meikle, W. G., Wu, X. & Barron, A. B. Traces of a neonicotinoid induce precocious foraging and reduce foraging per-
formance in honey bees. Environ. Sci. Technol. 53(14), 8252–8261. https://doi.org/10.1021/acs.est.9b02452 (2019).
20. Meikle, W. G. et al. Sublethal effects of imidacloprid on honey bee colony growth and activity at three sites in the U.S.. PLoS ONE
11(12), e0168603. https://doi.org/10.1371/journal.pone.0168603 (2016).
21. Crall, J. D. et al. Neonicotinoid exposure disrupts bumblebee nest behavior, social networks, and thermoregulation. Science 362,
683–686. https://doi.org/10.1126/science.aat1598 (2018).
22. Osterman, J. et al. Clothianidin seed-treatment has no detectable negative impact on honeybee colonies and their pathogens. Nat.
Commun. 10(1), 692. https://doi.org/10.1038/s41467-019-08523-4 (2019).
23. Siede, R. et al. A long-term field study on the effects of dietary exposure of clothianidin to varroosis-weakened honey bee colonies.
Ecotoxicology 27(7), 772–783. https://doi.org/10.1007/s10646-018-1937-1 (2018).
24. Wood, S. C. et al. Chronic high-dose neonicotinoid exposure decreases overwinter survival of Apis mellifera L. Insects 11(1), 30.
https://doi.org/10.3390/insects11010030 (2020).
25. Rolke, D., Fuchs, S., Grünewald, B., Gao, Z. & Blenau, W. Large-scale monitoring of effects of clothianidin-dressed oilseed rape
seeds on pollinating insects in Northern Germany: effects on honey bees (Apis mellifera). Ecotoxicology 25(9), 1648–1665. https
://doi.org/10.1007/s10646-016-1725-8 (2016).
26. Odemer, R., Nilles, L., Linder, N. & Rosenkranz, P. Sublethal effects of clothianidin and Nosema spp. on the longevity and foraging
activity of free flying honey bees. Ecotoxicology 27(5), 527–538. https://doi.org/10.1007/s10646-018-1925-5 (2018).
27. Meikle, W. G., Adamczyk, J. J., Weiss, M. & Gregorc, A. Effects of bee density and sublethal imidacloprid exposure on cluster
temperatures of caged honey bees. Apidologie 49(5), 581–593. https://doi.org/10.1007/s13592-018-0585-z (2018).
28. Meikle, W. G., Weiss, M. & Stillwell, A. R. Monitoring colony phenology using within-day variability in continuous weight and
temperature of honey bee hives. Apidologie 47(1), 1–14. https://doi.org/10.1007/s13592-015-0370-1 (2016).
29. Meikle, W. G. et al. Using within-day hive weight changes to measure environmental effects on honey bee colonies. PLoS ONE
13(5), e0197589. https://doi.org/10.1371/journal.pone.0197589 (2018).
30. Stabentheiner, A., Kovac, H. & Brodschneider, R. Honeybee colony thermoregulation—regulatory mechanisms and contribution of
individuals in dependence on age, location and thermal stress. PLoS ONE 5(1), e8967. https: //doi.org/10.1371/journa l.pone.00089
67 (2010).
31. Wang, Q. et al. Low-temperature stress during capped brood stage increases pupal mortality, misorientation and adult mortality
in honey bees. PLoS ONE 11(5), e0154547. https://doi.org/10.1371/journal.pone.0154547 (2016).
32. Gates, B. N. The temperature of the bee colony. United States Department of Agriculture, Dept. Bull. No. 96 (1914).
33. Worswick, P. V. Comparative study of colony thermoregulation in the African honeybee, Apis mellifera adansonii Latreille and the
Cape honeybee, Apis mellifera capensis Escholtz. Comp. Biochem. Physiol. 86A(1), 95–102 (1987).
34. Jones, J. C., Myerscough, M. R., Graham, S. & Oldroyd, B. P. Honey bee nest thermoregulation: diversity promotes stability. Science
305, 402–404 (2004).
35. Stalidzans, E. & Berzonis, A. Temperature changes above the upper hive body reveal the annual development periods of honey
bee colonies. Comput. Electron. Agric. 90, 1–6. https://doi.org/10.1016/j.compag.2012.10.003 (2013).
36. Meikle, W. G. et al. Exposure to sublethal concentrations of methoxyfenozide disrupts honey bee colony activity and thermoregula-
tion. PLoS ONE 14(3), e0204635. https://doi.org/10.1371/journal.pone.0204635 (2019).
37. Kronenberg, F. & Heller, H. C. Colonial thermoregulation in honey bees (Apis mellifera). J. Comp. Physiol. B 148, 65–76 (1982).
38. Southwick, E. E. & Moritz, R. F. A. Social control of air ventilation in colonies of honey bees (Apis mellifera). J. Insect Physiol. 33(9),
623–626 (1987).
39. Seeley, T. D. Atmospheric carbon dioxide concentration in honey bee (Apis mellifera) colonies. J. Insect Physiol. 20, 2301–2305
(1974).
40. Van Nerum, K. & Buelens, H. Hypoxia-controlled winter metabolism in honeybees (Apis mellifera). Comp. Biochem. Physiol.
117A(4), 445–455 (1997).
41. Mullin, C. A. et al. High levels of miticides and agrochemicals in North American apiaries: Implications for honey bee health.
PLoS ONE 5, e9754. https://doi.org/10.1371/journal.pone.0009754 (2010).
42. Rortais, A., Arnold, G., Halm, M.-P. & Touffet-Briens, F. Modes of honeybees exposure to systemic insecticides: estimated amounts
of contaminated pollen and nectar consumed by different categories of bees. Apidologie 36, 71–83. https://doi.org/10.1051/apido
:2004071 (2005).
43. Reeves, A. M. et al. In-Hive acaricides alter biochemical and morphological indicators of honey bee nutrition, immunity, and
development. J. Insect Sci. 18(5), 1–6. https://doi.org/10.1093/jisesa/iey086 (2018).
44. Woodcock, B. A. et al. Country-specific effects of neonicotinoid pesticides on honey bees and wild bees. Science 356, 1393–1395.
https://doi.org/10.1126/science.aaa1190 (2017).
45. Henry, M. et al. Pesticide risk assessment in free-ranging bees is weather and landscape dependent. Nat. Commun. 5, 4359. https
://doi.org/10.1038/ncomms5359 (2014).
46. Calabrese, E. J. & Baldwin, L. A. Hormesis: the dose-response revolution. Annu. Rev. Pharmacol. Toxicol. 43, 175–197. https://doi.
org/10.1146/annurev.pharmtox.43.100901.140223 (2003).
47. Cutler, G. C. & Rix, R. R. Can poisons stimulate bees? Appreciating the potential of hormesis in bee pesticide research. Pest Manag.
Sci. 71, 1368–1370. https://doi.org/10.1002/ps.4042 (2015).
48. Berry, R. III. & Lopez-Martinez, G. A dose of experimental hormesis: When mild stress protects and improves animal performance.
Comp. Biochem. Physiol. Part A 242, 110658. https://doi.org/10.1016/j.cbpa.2020.110658 (2020).
49. Thany, S. H. & Gauthier, M. Nicotine injected into the antennal lobes induces a rapid modulation of sucrose threshold and improves
short-term memory in the honey bee Apis mellifera. Brain Res. 1039(1–2), 216–219. https: //doi.org/10.1016/j.brainr es.2005.01.056
(2005).
Scientific Reports | (2021) 11:4364 | https://doi.org/10.1038/s41598-021-83958-8 17
Vol.:(0123456789)You can also read