Monitoring Your Dialysis Water Treatment System - Northwest Renal Network
←
→
Page content transcription
If your browser does not render page correctly, please read the page content below

Monitoring Your
       Dialysis
Water Treatment System

    Northwest Renal Network
Monitoring Your
              Dialysis Water
             Treatment System

                                  Published June, 2005

                         Northwest Renal Network
                           4702 42nd Avenue SW
                         Seattle, Washington 98116
                           Phone: (206) 923-0714
                            Fax (206) 923-0716
                      WEBSITE: www.nwrenalnetwork.org

                     This document was prepared by the Northwest Renal Network, under
                      contract #500-03-NW16 with the Centers for Medicare & Medicaid
                         Services. The contents do not necessarily reflect CMS policy.

Cover Photograph: Mt. Shuksan by Lorabeth Lawson

                                                                                         i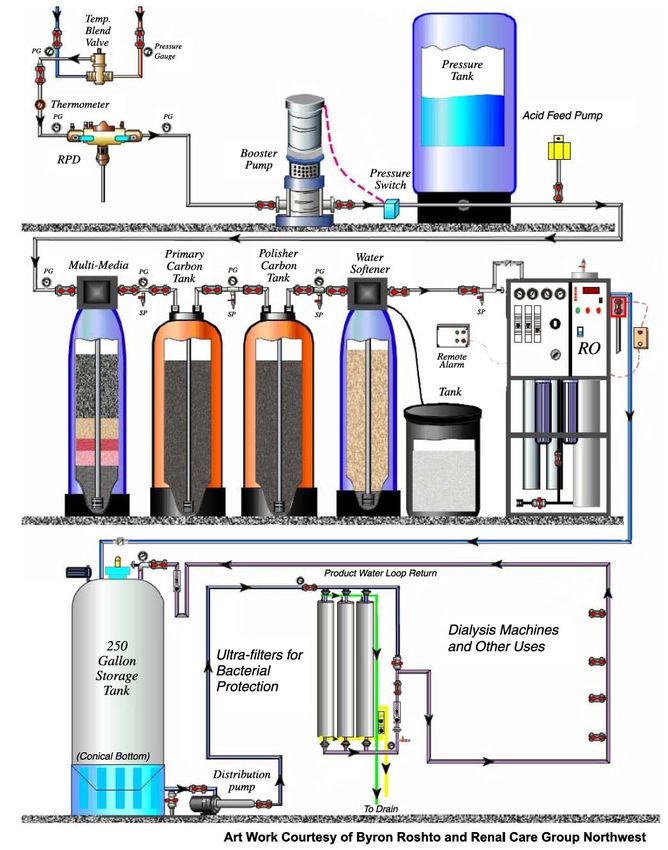
Dedication

Monitoring Your Dialysis Water Treatment System is dedicated to
Michael Lee Matson, an eloquent advocate for kidney patients.

Michael cared passionately about patient safety, and felt that the
best outcomes for patients could be achieved when all members of
the team, including patients, were informed and responsible.

An outstanding grass roots organizer, Michael articulated the
concerns of kidney patients as an active member of our Medical
Review Board, served on the Board of the National Kidney
Foundation of Oregon and Washington, and on the Consumer
Advocacy Group at Olympic View Dialysis Center. His testimony to
a Washington State Task Force on the Certification of Dialysis
Technicians was key to developing the guidelines in place today.

We miss Michael’s humor and the special wisdom he gained from
over thirty years on dialysis. He brought many deliberations of our
Medical Review Board back into focus on the “person” rather than
the “patient”, and challenged his fellow consumers to be informed
participants in their care and encouraged them to view their
physicians, nurses and dialysis technicians as consultants. He was
particularly vigilant about the technical process of dialysis, and thus,
we honor his memory with this document.

Lorabeth Lawson, MPP
Executive Director

                                                                       ii
Water Treatment Monitoring Committee:
Jim Curtis, CHT, CCHT (Chair)
       Quality Improvement Consultant, Northwest Renal Network
       Portland, Oregon
Larry Byers, CHT
       Director of Technical Operations, Puget Sound Kidney Centers
       Everett, Washington
Blu Roshto, CHT
       Area Education Coordinator, Fresenius Medical Services
       Eugene, Oregon
Byron Roshto, CHT, EMT
       Director of Operations, Renal Care Group Northwest
       Portland, Oregon

Reviewers:
Lynda K. Ball, BS, BSN, RN, CNN
       Quality Improvement Coordinator
       Northwest Renal Network, Seattle WA
Suhail Ahmad, MD
       Acting Section Chief, Nephrology, Medical Director, Dialysis/Apheresis,
       University of Washington
       Medical Director, Scribner Kidney Center,
       Seattle, Washington
John Pilmer, RN
       Client Care Surveyor, Lead ESRD Surveyor, Oregon Health Division
       Portland, Oregon
James W. Baker, BS, CWS VI
       President
       AmeriWater, Inc., Dayton, Ohio
Lorabeth Lawson, MPP
       Executive Director
       Northwest Renal Network, Seattle, WA
Northwest Renal Network Board of Directors and Medical Review Board (itemization follows)

Artwork Courtesy of Byron Roshto and Renal Care Group NW

Monitoring Your Dialysis Water Treatment System - June 2005                             iii
Northwest Renal Network - CMS Contract #500-03-NW16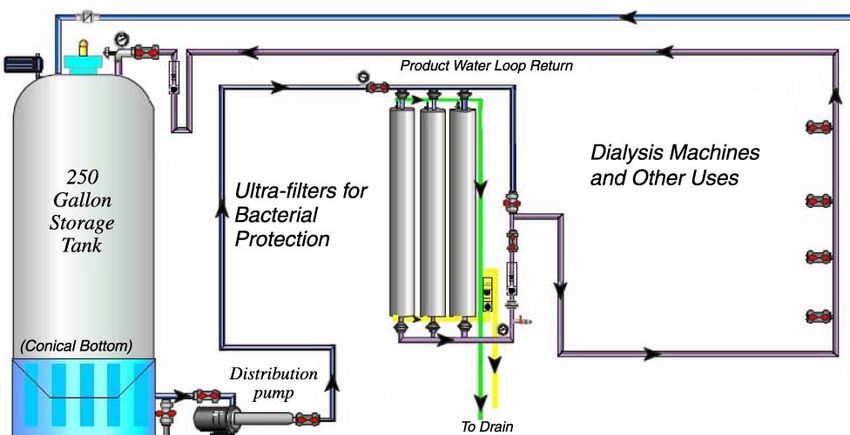
NORTHWEST RENAL NETWORK - BOARD OF DIRECTORS

Margaret Eddy MD                                          Jean Stevens RN MBA
Chairperson                                               Vice-Chair
Missoula, MT                                              Anchorage, AK

John Stivelman MD                                         Miriam Cressman BSN RN CNN
Secretary-Treasurer                                       Seattle, WA
Seattle, WA
                                                          Troyce Crucchiola
Micheal J. Adcox MD                                       Wilsonville, OR
Medical Review Board Chair
Boise, ID                                                 Peter B Hulman MD
                                                          Anchorage, AK
Jackie Chandler RN CNN
Corvallis, OR                                             Gwendolyn Pincomb MD PhD
                                                          Helena, MT

                 NORTHWEST RENAL NETWORK - MEDICAL REVIEW BOARD

Micheal J. Adcox MD                                       Sandra Watkins MD
Chairperson                                               Vice-Chair
Boise, ID                                                 Seattle, WA

Suhail Ahmad MD                                           Nancy Pierce RN CNN
Seattle, WA                                               Helena, MT

Martha Hanthorn MSW LCSW                                  Byron Roshto CHT EMT
Portland, OR                                              Portland, OR

Linda Jackson-Dale RN BSN CNN                             Katrina Russell RN CNN
Mountlake Terrace, WA                                     Seattle, WA

Lyn Jones MSW LCSW                                        Timothy J. Stevens RN BSN CCTC
Corvallis, OR                                             Spokane, WA

Kathleen Kuechenmeister                                   Annie W. Tu MS ARNP CNN
Everett, WA                                               Seattle, WA

Vickie Muchow                                             Curtis Wickre MD
Hungry Horse, MT                                          Spokane, WA

Jessie Pavlinac RD MS                                     Katy Wilkens RD MS
Portland, OR                                              Seattle, WA

Monitoring Your Dialysis Water Treatment System - June 2005                                iv
Northwest Renal Network - CMS Contract #500-03-NW16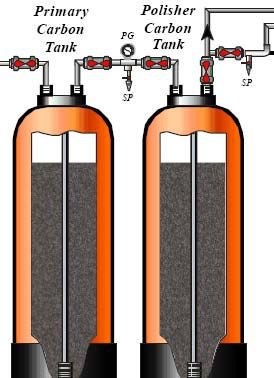
Table of Contents

Temperature Blending Valve................................................................................1
Backflow Prevention Device ................................................................................2
Booster Pump........................................................................................................3
Acid Feed Pump....................................................................................................3
Depth Filtration.....................................................................................................4
Water Softener ......................................................................................................4
Carbon Tank..........................................................................................................6
Reverse Osmosis Device ......................................................................................8
De-Ionization System ...........................................................................................9
Chemical Contaminant Monitoring ....................................................................10
Continuous Monitoring of Chemical Contaminants...........................................12
Microbiological Monitoring ...............................................................................13
Flow Rates ..........................................................................................................16
Drain System.......................................................................................................18
Monitoring Disinfectants ....................................................................................19
Documentation....................................................................................................19
Frequently Cited Standards.................................................................................20
Water Monitoring Summary Table.....................................................................22

                   Northwest Renal Network’s Mission:

  To promote optimal dialysis and transplant care for
kidney patients in Alaska, Idaho, Montana, Oregon and
                     Washington.

Monitoring Your Dialysis Water Treatment System - June 2005                                                           v
Northwest Renal Network - CMS Contract #500-03-NW16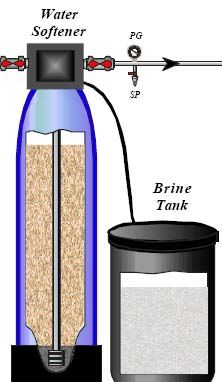
Monitoring Your
               Dialysis Water Treatment System
Water treatment systems used in dialysis are a critical factor in the overall care received
by dialysis patients; they also provide one of the greatest hazards to the patients if they
are not functioning properly.

Monitoring of water treatment systems has been an identified area of concern, and an
opportunity for quality improvement nationally. To respond to this need, the Northwest
Renal Network developed this comprehensive review of water treatment monitoring. This
document was created by the Network Water Treatment Monitoring committee: Jim
Curtis, Network Quality Improvement Consultant; Byron Roshto, Director of Operations
for Renal Care Group Northwest; Blu Roshto, Area Education Coordinator, Fresenius
Medical Services; and Larry Byers, Director of Technical Services for Puget Sound
Kidney Centers. Key reviewers were Lynda Ball, Quality Improvement Coordinator for
Northwest Renal Network; Suhail Ahmad, Medical Director of Scribner Kidney Center;
and John Pilmer, Client Care Surveyor at Oregon State Health Division. The graphics in
both the document and accompanying poster were created by Byron Roshto.

We believe that it will be very useful to technical personnel in the facility who are
responsible for the day-to-day monitoring of their water treatment system. We have
described the important monitoring parameters for each component in the system, from
the incoming water to the drain system.

Monitoring the Temperature Blending Valve:

                                      Often, water treatment systems will require that the
                                      feed water temperature be raised to a certain degree.
                                      For example, reverse osmosis systems operate most
                                      efficiently (produce the largest volume of dialysis-
                                      quality water for the number and type of
                                      membranes) - at a feed water temperature of 77°F.
This is accomplished through the use of a heater in conjunction with a temperature
blending valve. A common problem comes from the water heater not being large enough
to keep up with the facility’s needs.

The temperature blending valve is a device that can be set to mix hot and cold water to
achieve a specific water temperature. There are various designs for this important piece
of equipment, but some are more appropriate for use in a dialysis setting – specifically
ones with an incorporated temperature indicator or thermometer. A common type seen
today uses a spring-loaded thermostat. This is important because these tend to fail hot—
meaning that when they go out, the output water temperature rises, and rises quickly. For
this reason, it is necessary to monitor and record the output temperature at least daily.

Monitoring Your Dialysis Water Treatment System - June 2005                              1
Northwest Renal Network - CMS Contract #500-03-NW16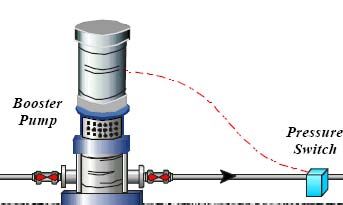
When working properly, with an appropriately sized water heater, the blending valve
output temperature will rarely vary more than plus or minus 2 to 3 degrees F. If, during
your daily recording, you note a temperature fluctuation out of this acceptable range,
immediately bring it to the attention of the facility’s maintenance person or your
supervisor.

A defective blending valve will not necessarily endanger your patients (dialysis machines
have a bypass mechanism for overheated water/dialysate), but it can damage the heart of
your dialysis clinic, your water treatment equipment.

Blending Valve Summary
      What to monitor: Water temperature
      What to look for: Appropriate water temperature, minimal temperature
      fluxuation

Monitoring the Back Flow Prevention Device:

                                       It is required by building codes that dialysis water
                                       treatment equipment be connected to the source
                                       water through a Backflow Prevention Device (also
                                       known as a Reverse Flow Prevention Device), or
                                       RP. The purpose of this is to prevent water from the
                                       water treatment equipment being pulled backward
                                       through the building’s water supply piping. As an
                                       example, if a water main broke at the bottom of a
hill, gravity would cause the water in the pipe feeding the dialysis unit to drain down. The
RP device would prevent the draining back of water from the treatment system. If there
were not backflow prevention, this suction would pull water out of the treatment system.
The Backflow Prevention Device also prevents the backflow of chemicals into the
building water main during the process of chemical disinfection of the water treatment
system, thus eliminating the risk of chemical exposure to the other parts of the building.
If the system was being disinfected, the chemical would be pulled into the water main as
well. Once the break was fixed, water that had been in the RO machine, and is now in the
water main could be diverted to any other uses on the main water line.

The screen on the RP device can get plugged up thus reducing the water flow through it.
Therefore, the RP device needs to be monitored for fouling of the internal screen. This is
done by monitoring the pressure going into and out of the device. There is normally a
significant reduction in pressure across an RP device, often as much as 20 Pounds Per
Square Inch (PSI). It is important to have a baseline pressure drop established which
would be the normal pressures for the device. After that, if the pressure difference
between pre and post RP device increases by 10 PSI, the internal screen should be
cleaned, or the RP device may need servicing.

Monitoring Your Dialysis Water Treatment System - June 2005                               2
Northwest Renal Network - CMS Contract #500-03-NW16
RP devices must also be checked for proper function at least annually by someone who
has been properly trained and certified. Most facilities use a plumber for this, though you
can get certified by taking a class specifically for this purpose.
RP Device Summary
What to monitor: Pressure drop across the device, annual testing
What to look for: A pressure drop change of 10 PSI from baseline
Monitoring the Booster Pump:
In order to maintain the necessary minimum
pressure and flow to the treatment system,
booster pumps are often used on the feed water
line. The on/off cycle of booster pumps are
controlled by either a pressure switch or flow
switch, which turns the pump on when the
pressure drops below a specific set point, and
turns it off once the pressure recovers to the
baseline (above the set point). These set points vary depending on the needs of an
individual dialysis facility. Once the proper set points are established, the pump should be
monitored periodically to ensure its proper functioning and that the booster pump cycles
on and off as needed.
Booster Pump Summary
What to monitor: Water pressure
What to look for: Pump turning on and off at the appropriate pressures or flow
rates
Monitoring the Acid Feed Pump:
Though this is not needed in all water treatment systems, adding an
acidic solution to the raw water is indicated in areas where the pH of
incoming feed water is high. Some municipalities add a base such as
sodium hydroxide into the water system to increase the pH of the
water. This minimizes leaching of metals from the pipes. Carbon filtration and Reverse
Osmosis devices will not work as effectively at a pH of >8.5. In these municipalities,
adding an inorganic acid to lower the feed water pH may be required for the proper
functioning of water treatment system. Organic acids are discouraged because they
encourage bacterial growth.
To assure that the acid is fed in at the appropriate rate, pH must be monitored from a
sample port just downstream from the acid feed pump. This monitoring should be
performed with a pH meter or pH strip that is designed for the level anticipated.
Monitoring Your Dialysis Water Treatment System - June 2005 3
Northwest Renal Network - CMS Contract #500-03-NW16The expected range for pH should be between 7.0 and 8.0. Some important points to
consider:
1. Place the acid feed system before the multi-media since the lower pH can cause
aluminum to precipitate.
2. Online monitoring of pH is required with both audible and visual alarms in place
3. An independent test of pH is required daily
Note: Sometimes as an alternative pretreatment, weak acid cation tanks are used to lower
pH by adding hydrogen ions.
Acid Feed Pump Summary
What to monitor: pH post acid feed pump
What to look for: pH should be between 7.0 and 8.0
Monitoring Depth Filtration Devices:
Depth filters are used to remove particulate matter from the
water. They range from large multi-media filters and
cartridge filters which remove dirt from the incoming water
to ultrafilters that remove bacteria from product water.
Monitoring of depth filters is the same, regardless of their
size or configuration. The pressure should be measured both
pre and post filter, and a baseline pressure drop established
when they are fresh. From this point, there should not be
more than a 10 PSI pressure drop from this baseline. If the
pressure drop change is greater than 10 PSI, the filter should
be replaced or backflushed to restore unrestricted flow of
water.
The backflush timer (if present) should be set to perform the
backflush operation after facility operation hours.
Depth Filtration Summary
What to monitor: Pressure drop across the device, backflush timer
What to look for: Pressure drop of 10 PSI or more from baseline operating
pressures, timer set correctly
Monitoring the Water Softener:
Water softeners are an important part of most water treatment systems. Their use,
however, is primarily in protecting and prolonging the life of the RO membrane. Water
softeners are used primarily to remove calcium and magnesium from the water, which an
RO will do easily as well. (Softeners remove Ca++ and Mg++ by exchanging these for
Monitoring Your Dialysis Water Treatment System - June 2005 4
Northwest Renal Network - CMS Contract #500-03-NW16Na+.) The problem resolved by softening is that the calcium would otherwise build up on
the RO membrane and cause a significant decrease in water quality as well as RO
membrane life.
To assure that your softener will perform appropriately, you need to monitor:
1. Total hardness post softener
Measured in either Grains per Gallon
(GPG) or Parts per Million (PPM). The
Association for the Advancement of
Medical Instrumentation (AAMI) RD52
recommends a limit of 1GPG, which is
equal to 17.2 PPM. PPM can be
converted to GPG by multiplying by
0.058. GPG can be converted to PPM by
dividing by 0.058.
2. Pressure Drop
The pressure should be monitored before
and after the softener. Softeners vary in
how much pressure is lost across them,
and you need to establish a baseline when
it is working properly. The device may
require back flushing if the pressure drop
changes by more than 10 PSI. A
breakdown of the resin can occur (from
chlorine) which can also cause increased pressure drops.
3. Salt level in the brine tank
There should always be an adequate amount of salt in the tank to allow the
resin beads to be regenerated by the softener.
Monitor the brine tank for a “Salt Bridge”- where salt at the top of the tank
solidifies, making it appear as though the tank is full when it is actually empty
underneath.
4. Regeneration Timer
The system should be set to regenerate the resin beads often enough to
provide exchange ions for the calcium and magnesium.
The timer should be set to activate when the facility is not operating, and
monitored daily to make sure it will not go into a regeneration cycle during a
patient treatment. The timer should always be visible.
Water Softener Summary
What to monitor: Post softener hardness at the end of the day, amount of salt in
the brine tank, “salt bridge” in the brine tank, pressure drop across the device,
settings on regeneration timer.
What to look for: Hardness not exceeding 1 GPG (17.24 PPM), adequate amount
of salt with no salt bridge, pressure drop change from baseline of 10 PSI or more,
timer set to activate when facility is not in operation.
Monitoring Your Dialysis Water Treatment System - June 2005 5
Northwest Renal Network - CMS Contract #500-03-NW16Monitoring the Carbon Tanks:
One of the most critical tasks regarding
patient safety in the day of a dialysis
technician is checking the water treatment
system for chlorine and chloramines.
Chlorine and its combined form, chloramine,
are high-level oxidative chemicals. They are
added to municipal water systems to kill
bacteria—but they also destroy red blood
cells. For this reason they must be removed
from water to be used for dialysis.
Unfortunately the R/O system is not very
effective at removing chlorine and
chloramines. In fact, many membranes are
destroyed by them. Chlorine is removed
from the incoming water by running it
through tanks filled with Granulated
Activated Charcoal (GAC, or carbon), which
absorbs it.
Carbon tanks are part of the pre-treatment section of a water treatment system and
normally are arranged where water will flow first through one tank and then directly into
another. This is called a “series” configuration. The first tank in the series (Primary
Carbon Tank) is referred to as the “worker” tank and second is called the “polisher.”
Knowing the flow arrangement of your carbon tanks will help you understand how and
where to test them.
The amount of carbon in your tanks must be adequate to allow the chlorine to be absorb-
ed in the amount of time the water is flowing through it. The water must be exposed to
the carbon for 5 minutes in each tank, for a total of 10 minutes for both the worker and
polisher. This residence time is known as Empty Bed Contact Time, or EBCT. It is
calculated using the formula EBCT=V/Q, where V= the Volume of Carbon (in cubic
feet) and Q= the water flow rate, in cubic feet per minute. To calculate the volume of
carbon needed, use the formula V= (Q * EBCT) / 7.48 (this is the number of gallons in
one cubic foot of water).
For example, if you know that you have a flow rate of 10 Gallons per Minute (GPM), and
you want an EBCT of 5 minutes, your calculation would be:
V = (Q * EBCT) / 7.48
V = (10 * 5) / 7.48
V = 6.69
You need a 6.69 cubic foot carbon tank for each working and polishing tank
To calculate your EBCT from a known carbon tank volume and flow rate (assume a 6
cubic foot tank and a 12 GPM flow rate), your calculation would be:
Monitoring Your Dialysis Water Treatment System - June 2005 6
Northwest Renal Network - CMS Contract #500-03-NW16EBCT = V/Q
EBCT = 6 / (12/7.48)
EBCT = 6 / 1.6
EBCT = 3.75 minutes per 6 cubic foot tank
The objective of your chlorine/chloramine testing is to verify that chlorine has been
removed from the water entering the RO. Your sample should be taken at the point where
the water leaves the first tank (worker) and before entering the second (polisher). If the
results show any chlorine leaving the first tank, a second sample should be taken
immediately after the water leaves the second tank. If there is chlorine leaving the second
tank, dialysis should be discontinued in the facility. If there is no breakthrough, the
chlorine level should continue to be monitored after the second tank on an hourly basis
until the primary tank is replaced. This is because you no longer have redundant
protection.
It is very important that the water system be in full operation for at least 15 to 20 minutes
before you take your first test. If you take your sample as soon as you start up the system,
you will be testing water that has been sitting in the tank overnight, and it will not give
you a representative sample of the carbon tank’s capability at normal flow rates.
There are various ways to test water for chlorine/chloramine but the most widely used are
colorimeters, color comparators, and test strips. Because the results of this test (and
others) are determined by comparing colors, it is important that the person performing
them has passed a color blindness test.
The limit for chlorine is 0.5 PPM, and the limit for chloramine is 0.1 PPM. There is no
method to test directly for chloramine, so you must perform two separate tests: one for
Total Chlorine, and one for Free Chlorine. The chloramine level is the difference between
the two tests.
Example:
Your Measured Total Chlorine is 1.2 PPM
Your Measured Free Chlorine is 0.8 PPM
1.2 - 0.8 = 0.4 PPM
Therefore your Chloramine Level is 0.4 PPM
It is acceptable, according to the AAMI, to just test for total chlorine so long as the test is
of appropriate sensitivity and the result does not exceed 0.1 PPM. The rationale being if
you have a zero reading for total chlorine then there is no chloramine present.
Most commonly, chlorine/chloramine testing is done before each patient shift. In most
clinics, it would be difficult to find times during the day when there are no patients on the
dialysis machine, so one strategy is to test before the first patient treatment at the
beginning of the day, again at 9:00 am or 10:00 am, followed by a third and last test
between 2:00 pm and 5:00 pm depending on your patient schedule. You will probably
Monitoring Your Dialysis Water Treatment System - June 2005 7
Northwest Renal Network - CMS Contract #500-03-NW16find that the best plan would specify exact times rather than a time frame, approximately
every four hours. If any of your tests indicates the presence of chlorine/chloramine, you
must immediately notify the person responsible for maintaining the water treatment
system.
Pre and post pressures must also be monitored on the carbon tanks to assure consistent
flow of water. If the carbon is fouled by particulate matter, the pressure drop will
increase, indicating a need to backflush the tank to remove the particulates.
On larger tanks in particular, it is important to periodically backflush the tank to prevent
channeling, which causes the water to flow quickly through established channels
reducing the expected EBCT.
Carbon Tank Summary
What to monitor: Chlorine and chloramine levels after the worker tank before
each patient shift, pressure drop across each tank, backflush timer. EBCT
calculated and at the minimum 10 minutes for both tanks.
What to look for: Chlorine levels within AAMI standards (0.5 PPM chlorine, 0.1
PPM chloramine), pressure drop change of 10 PSI or greater, backflush timer set
to activate when facility is not in operation.
Monitoring the Reverse Osmosis (RO) Device:
The primary concerns in monitoring your RO for
quality are discussed below in their own sections
on Chemical Contamination and Microbiological
Monitoring. However, it is important to monitor the
operation of the RO system to maintain its
efficiency. Every RO will have its own specific
parameters that indicate whether it is operating
correctly.
Water pressure is measured in several places.
Incoming water pressure needs to be adequate to
maintain flow through the RO, generally 30-40
PSI. Pre and post pressure should be monitored on
any incorporated depth filter as well. There is
usually a safety switch that shuts down the RO if
the pressure is too low to prevent damage to the RO
pump. The pump pressure is monitored, as this
pressure is what pushes water through the membrane, and is generally 200-250 PSI. The
reject pressure is usually 50-75 PSI less than the pump pressure. The pressure of the
product water is also monitored, and it will vary greatly depending on whether it is a
direct or indirect (holding tank) system.
Monitoring Your Dialysis Water Treatment System - June 2005 8
Northwest Renal Network - CMS Contract #500-03-NW16Water flow is also measured in several places using flow meters. Product flow indicates
the amount of purified water that is getting through the membrane. Waste flow indicates
the amount of concentrated water being flushed down the drain. Direct systems often
measure the amount of product water recirculated through the system, and being blended
with the incoming water.
The amount of dissolved solids is monitored in the incoming and product water, and is
discussed in detail in the Monitoring Chemical Contamination section.
Reverse Osmosis Summary
What to monitor: Water pressure and flow at various locations throughout the
system.
What to look for: Pressure and flow in an RO system are inter-related. For
example, if you reduce the RO pump pressure, you will have a decrease in
product water flow, and an increase in waste water flow. If the product water flow
drops without a change in pump pressure, the RO membrane may be getting
plugged up. A change in the delta pressure between the pump and reject pressures
can indicate fouled membranes. It is therefore very important to establish
appropriate baseline values for all pressures and flows, and then investigate any
deviations. Use a trend analysis so that even minor changes can be seen over time.
Monitoring the De-Ionization (DI) System:
The primary concerns in monitoring your
D I Exchange Process DI for quality are discussed below in the
Sodium Chloride
sections on Chemical Contamination and
Na+ Cl-
Na+
Microbiological Monitoring. However, it is
Cl-
H+ OH-
OH-
important to monitor the pressures of the DI
H+
H+
OH- system to maintain its efficiency.
H+ OH- OH-
H+ OH-
Water pressure should be monitored before
Cation Resin and after each DI tank you are using.
Anion Resin
Beads with H O Beads with
2
Baseline pressure drops should be
Hydrogen Ions Hydroxyl Ions
Pure Water
established when the system is operating
correctly. Changes of 10 PSI or greater
indicate that the tanks are becoming plugged with particulate matter, or potentially the
resin is breaking down, and restricting the flow of water.
Flow rates in DI systems are determined by product water usage. They do not generate a
waste stream like an RO. If a holding tank is used, the flow velocity in the distribution
loop should be a minimum of 3 ft/sec.
DI System Summary
What to monitor: Pressure before and after each tank.
What to look for: A change in pressure of 10 PSI or more from baseline.
Monitoring Your Dialysis Water Treatment System - June 2005 9
Northwest Renal Network - CMS Contract #500-03-NW16Chemical Contamination Monitoring the Feed Water: A chemical analysis of your feed water should be performed periodically so that you are aware of the chemical composition, and assure that the water treatment system is designed to be able to reduce those contaminants to levels identified by AAMI. The list of contaminants and the appropriate methodology for analysis is listed below in Table 1. The feed water analysis should be taken from the water before it enters any part of the water treatment system. It can be taken from a sink near the water treatment room so long as it has not been treated in any way. If your back-up water plan is to use softened, dechlorinated water, or DI water in the event of an RO failure, you must also test this water. Testing should be performed for pH, endotoxin and bacteria on water from this back up plan as well. The samples should be sent to a qualified lab that has the capability of analyzing them by the correct methodology and to the levels specified by AAMI. It is strongly suggested that the feed water be analyzed at least four times a year so that you know any seasonal variations, which are often present. There are no standards for contaminant levels in feed water. The results of the feed water analysis can be used to predict product water contamination by simply multiplying the individual results by the RO’s percent rejection. A trend analysis should be performed to show trends over time. It is very important that you maintain communication with the municipality that supplies water to your facility. Let them know who you are, and how important water quality is to your patients’ health. They will inform you of any changes that occur, whether they are planned or accidental. Monitoring the Product Water: Your product water should be analyzed periodically to confirm that the water you are using for dialysis meets AAMI standards for chemical contamination. The sample should be sent to a qualified lab that has the capability of analyzing them by the correct methodology and to the levels specified by AAMI. Though the regulations state water is to be tested every 12 months, you are required to meet the AAMI Standards at all times. It is therefore strongly recommended that you test your product water at least quarterly. Samples for product water chemical analysis should be drawn from a sample port immediately after the RO or DI system. When reviewing the results you should do two things. First, make sure that there are no contaminant levels that exceed AAMI standards. Then you should compare the results with past testing results and do a trend analysis to determine if any levels are increasing. This will give you advance knowledge about a potential degradation of your water treatment system, or changes in the supply water. Monitoring Your Dialysis Water Treatment System - June 2005 10 Northwest Renal Network - CMS Contract #500-03-NW16
Table 1: AAMI Chemical Contaminant Standards
Contaminant         Maximum                                   Test Methodology
                    Concentration mg/L
                    (Unless otherwise
                    noted)
Calcium             2 (0.1 mEq/L)                             EDTA Titrimetric Method, or
                                                              Atomic Absorption (direct aspiration), or
                                                              Ion Specific Electrode
Magnesium                 4 (0.3 mEq/L)                       Atomic Absorption (direct aspiration)
Potassium                 8 (0.2 mEq/L)                       Atomic Absorption (direct aspiration), or
                                                              Flame Photometric Method, or
                                                              Ion Specific Electrode

Sodium                    70 (3.0 mEq/L)                      Atomic Absorption (direct aspiration), or
                                                              Flame Photometric Method, or
                                                              Ion Specific Electrode

Antimony                  0.006                               Atomic Absorption (platform)
Arsenic                   0.005                               Atomic Absorption (gaseous hydride)
Barium                    0.10                                Atomic Absorption (electrothermal)
Beryllium                 0.0004                              Atomic Absorption (platform)
Cadmium                   0.001                               Atomic Absorption (electrothermal)
Chromium                  0.014                               Atomic Absorption (electrothermal)
Lead                      0.005                               Atomic Absorption (electrothermal)
Mercury                   0.0002                              Flameless Cold Vapor Technique (Atomic
                                                              Absorption)
Selenium                  0.09                                Atomic Absorption (gaseous hydride), or
                                                              Atomic Absorption (electrothermal)
Silver                    0.005                               Atomic Absorption (electrothermal)
Aluminum                  0.01                                Atomic Absorption (electrothermal)
Chloramines               0.10                                DPD Ferrous Titrimetric Method, or
                                                              DPD Colorimetric Method
Total chlorine            0.50                                DPD Ferrous Titrimetric Method, or
                                                              DPD Colorimetric Method
Copper                    0.10                                Atomic Absorption (direct aspiration), or
                                                              Neocuproine Method
Fluoride                  0.20                                Ion Selective Electrode Method, or
                                                              SPADNS Method
Nitrate (as N)            2.00                                Cadmium Reduction Method
Sulfate                   100.00                              Turbidimetric Method
Thallium                  0.002                               Atomic Absorption (platform)
Zinc                      0.10                                Atomic Absorption (direct aspiration), or
                                                              Dithizone Method
NOTE: The physician has the ultimate responsibility for ensuring the quality of
water used for dialysis.

Additional Note: The above note in the AAMI Standards has been interpreted by some
facilities to mean that the physician, or more specifically the Medical Director, has the
leeway to deviate from these standards. Please understand that from the perspective of
AAMI and regulatory agencies, this note indicates that the Medical Director is
responsible for assuring that these standards are met, as stated, at all times. If the
standards are not met, it is this person who will be cited as the negligent party.

Monitoring Your Dialysis Water Treatment System - June 2005                                               11
Northwest Renal Network - CMS Contract #500-03-NW16
Continuous Monitoring of Chemical Contamination:
An indirect method must be employed to continuously monitor the
chemical quality of the water. This is achieved by monitoring
conductivity in RO systems and resistivity in DI systems.
In an RO system, conductivity is generally measured before (input) and
after (output) the water passes through the RO membrane. Conductivity indicates the
level of Total Dissolved Solids (TDS) in the water in terms of Parts per Million (PPM).
By using the “percent rejection” formula {1-(output conductivity / input conductivity)}*
100, you can determine the percentage of a given solute that is removed by the RO
membrane. The conductivity monitor should be temperature compensated to give a
consistent conductivity reading.
Example: Input conductivity is 100 PPM, and Output conductivity is 8 PPM.
Enter into the formula: {1-(8/100)}*100
Equals (1-0.08)*100
Equals 0.92*100
Therefore you have a 92% rejection of total dissolved solids.
Note: Conductivity of raw and RO water is actually measured in Micro Siemens.
This measurement is equivalent to PPM, and is usually stated as PPM on the RO
water quality monitor.
In a Deionization System, water quality is monitored differently. Because the water from
a DI is more pure than RO water, the conductivity is too low to monitor accurately. For
this reason, we monitor resistance to the flow of electricity, which is the inverse of
conductivity. Percent rejection is not monitored, just the final product water. The
acceptable limit of resistivity is greater than 1 megohm/cm resistance. It is very important
that you understand the monitor on your particular DI system, as they can be variable.
Usually, the indicators are simply LED’s that indicate water quality.
There was an incident in Chicago several years ago where a DI system was installed
during a remodel. The DI monitor had a single indicator light that burned amber when the
water was OK (greater than 1 megohm/cm), and went out if the water quality dropped.
When this DI tank exhausted, a new one was put in that had a dual light indicator. It
burned green when the water was OK, and turned amber when the quality dropped. A
technician returned from vacation after the tank exchange, and had no idea that there was
a different monitoring system. He checked the monitor, and when it was amber, assumed
that all was well. This resulted in several patient deaths due to fluoride contamination.
A secondary method of monitoring DI is pH. Often when a DI tank is exhausted, the pH
will drop. This is not always the case depending on the contaminants in the raw water, so
pH can never be used as the primary means of monitoring a DI system, and resistivity
monitoring must be used.
Monitoring Your Dialysis Water Treatment System - June 2005 12
Northwest Renal Network - CMS Contract #500-03-NW16Chemical Contamination Summary:
What to monitor:
Analysis of raw and treated water for chemical contaminants outlined
in the AAMI table. The standards state that these should be tested
annually, but the Network’s Committee recommends that they be done
quarterly.
Product water must be indirectly monitored continuously using either
conductivity for RO water, or resistivity for DI water. These monitors
must have an alarm in the treatment room that alerts you if the water
quality degrades.
What to look for:
Any contaminant results that exceed AAMI standards. A trend analysis
should be done to see if any contaminant levels are increasing.
Any changes in your indirect, continuous monitor that would indicate
product water quality were below AAMI standards. The percent
rejection alarm on an RO depends on your incoming water analysis.
For DI the alarm point is 1 Meg Ohm of resistance.
Monitoring Microbiological Contamination:
Microbiological contamination of water is a serious health concern for patients on
dialysis. High levels of bacteria and/or endotoxin can harm patients by causing pyrogenic
reactions or even systemic infections if a dialyzer membrane ruptures. If the bacterial
contamination is severe enough, there can be a release of toxins that can adversely affect
dialysis patients. It is essential that dialysis facilities monitor both bacteria and endotoxin
levels in the water used for dialysis and dialyzer reprocessing.
Monitoring Your Dialysis Water Treatment System - June 2005 13
Northwest Renal Network - CMS Contract #500-03-NW16Bacterial Standard for Water Used to Prepare Dialysis Fluid and Reprocess Hemodialyzers The maximum level of bacteria in water used to prepare dialysis fluid and reprocess hemodialyzers must not exceed the AAMI standard of 200 colony forming units (CFU). The AAMI action level is 50 CFU for bacteria in water used to prepare dialysis fluid. The Network Water Treatment Monitoring Committee recommends an action level of 25 CFU for monitoring RO machine membrane effectiveness as a bacteria barrier, because if you have that much bacteria passing through your RO membrane, it is likely to proliferate rapidly in your system. An action level is defined as a point when measures must be taken to correct the potential source to remain in compliance with AAMI standards. Endotoxin Standard for Water Used to Prepare Dialysis Fluid and Reprocess Hemodialyzers The maximum level of endotoxin in water used to prepare dialysis fluid and reprocess hemodialyzers must not exceed the AAMI standards of 2 Endotoxin Units per Milliliter (EU/ml). The action level of endotoxin in water used to prepare dialysis fluid is 1 EU/ml. Frequency of Testing for Bacteria and Endotoxin levels Testing should be performed monthly. If standards are exceeded, testing should be performed weekly until the problem is resolved. Sample Collection: The sample ports used to collect the samples must be rinsed for at least one minute at normal pressure and flow rate before drawing the samples. Samples should be collected using a “clean catch” technique to minimize potential contamination of the sample, leading to false positive results. Sample ports should not be disinfected. If a facility insists on disinfecting the ports, alcohol should be used and allowed to completely dry before the sample is drawn. Bleach or other disinfectants should not be used. Sample collection sites: The sample should be taken from the product water distribution piping at the following locations: Site 1: At the point where the water leaves the RO machine, before it enters the holding tank (Indirect System), or before it goes to the treatment room to provide water for dialysis machines (Direct System). Monitoring Your Dialysis Water Treatment System - June 2005 14 Northwest Renal Network - CMS Contract #500-03-NW16
Site 2: If an RO water holding tank is present, a sample should be taken at the point
where the water leaves the tank.

Site 3: At the end of the return line of the RO water distribution loop, whether it is
returning to the RO or a water holding tank. If a bacteria filter is installed anywhere in the
system, a sample is to be drawn from a sample port both pre and post filter.

Site 4: At the point where water enters into the dialyzer reprocessing system, whether it
is a manual or automated system. (Note: If a sample port is not present one should be
installed.)

Site 5: At a point where water enters equipment used to prepare bicarbonate and acid
concentrate. (Note: If a sample port is not present one should be installed.)

Site 6: At the point where the dialysis machine is hooked up to the product water loop. If
a dialysis machine is consistently attached to that location, you may culture the machine
instead of the water outlet.

Site 7: If your facility uses softened, dechlorinated water as a backup water plan, it is
necessary to perform cultures and a Limulus Amebocyte Lysate (LAL) test on this water,
because the RO is the primary source of bacterial protection for the patients.

        Note: Though this document deals with water treatment, it is very important to
culture your dialysis machines as well. The new limit for bacteria (ANSI/AAMI RD52
2004) in dialysate is 200 CFU’s/ml. Two of your machines should be cultured monthly,
or enough that all of them are cultured at least annually. The water line into the machine
should be suspected if you ever get positive results, as this line is often overlooked in
disinfection procedures.

Important: If a DI system is being used to prepare dialysis fluid, the samples are to be
drawn at a point between the DI outlet and the bacteria filter and from the water valve at
the furthest point on the distribution water line from the DI system.

Testing Methodology
Samples for bacteriological testing should be processed within 1-2 hours or refrigerated
and processed within 24 hours. The AAMI standard recommends culturing samples of
0.5 to 1.0 cc for 48 hours at 35 C, using tryptic soy agar as the culture medium. Filter
membrane devices such as the Millipore paddles are acceptable, but require a solid QA
program that includes sending duplicate samples to a lab annually. Techniques that
should absolutely be avoided are the calibrated loop, and blood or chocolate agar. This is
because calibrated loops have too small a sample size (either 0.01 or 0.001 cc), and the
blood and chocolate agars are too nutrient rich for water borne bacteria, which would
cause them to die rather than multiply. The testing of endotoxin is performed by the LAL
test.

Monitoring Your Dialysis Water Treatment System - June 2005                                15
Northwest Renal Network - CMS Contract #500-03-NW16
When Test Results Exceed the Action Level:
In the event test results are above the action level, there should be a review of the
following procedures as the first step to isolate the potential problem:
Level of bacteria exiting the RO machine.
Product water distribution system disinfection procedures.
Examination of the distribution piping system for dead spots that may contribute
to bacterial contamination including possible contamination of bacteria filters if
they are installed in the distribution system.
Corrective action should be undertaken in the area of the suspected cause for exceeding
the action level. Corrective action may include:
Cleaning and disinfection of RO machine membranes.
Disinfection of the product water distribution system, including the entire loop.
The installation of an endotoxin filter system in the RO water distribution system
and/or increasing the frequency of disinfection of existing bacteria filter(s).
Make sure that the water hose on the machine is being disinfected (This is often
overlooked in facilities when the machines and RO loop are disinfected
separately).
Microbiological Monitoring Summary
What to monitor: Bacterial cultures and LAL tests from a representative portion
of your product water delivery system.
What to look for: Bacterial culture results that exceed the action level of 50
CFU’s/ml. LAL results that exceed the 1 EU/ml action level. A trend analysis
should be done to determine if microbiological contamination is increasing from
previous testing results.
Monitoring Product Water Flow Rates:
Under certain conditions, bacteria in water systems can attach themselves
to the walls of the pipe, and form a layer of biofilm. This hazard can be
minimized by the friction of rapidly moving the water through the pipes.
A flow velocity of 3 ft/second is the minimum recommendation in order
to reduce bacteriological problems. The rate of flow and the size of the
pipes in use will determine the flow velocity. A flow meter should be
placed on the return loop after the last point of use and before the storage tank.
The following formula can be used to calculate flow velocity in the water system loop
when the return flow from the loop is known. It can also be used to calculate the flow
rate required, based on the diameter of pipe in use.
V = Q/A, where:
V = flow velocity in feet/sec
Q = flow rate in feet³/sec
A = cross sectional area of distribution pipe in feet²
Monitoring Your Dialysis Water Treatment System - June 2005 16
Northwest Renal Network - CMS Contract #500-03-NW16In order to use the formula, the flow rate must be converted to cubic feet per second.
This is done by dividing the Gallons per Minute (GPM) by 60 and then dividing that
number by 7.48, which is the number of gallons of water contained in one cubic foot.
(The same result can be achieved by multiplying the gallons per second by 0.1337)
Example: What is the flow velocity of the return flow through a 1-inch pipe at 6.5 GPM
rate?
Step one: Convert GPM to ft³/sec
Formula: GPM/60 (seconds in a minute) / 7.48 (gallons of water in one
cubic foot)
First: 6.5 GPM / 60sec = .10833 gallons per second
Then: 0.10833 / 7.48 = 0.0145
Therefore, 6.5 gallons / min = 0.0145 ft³/sec
The next step is to calculate the cross sectional area of the pipe. Essentially, this means
we need to calculate the area of a flat circle the size of the internal diameter of the piping.
The area of a circle is calculated using the formula A = pi X r², where A = Area, pi =
3.14, and r = radius (which is ½ of the diameter).
We will assume a 1-inch diameter pipe is being used. To convert diameter in inches to
radius in feet: Divide the diameter by 2 to get the radius in inches, and then divide this
number by 12 to convert into feet.
Step two: Calculate the cross sectional area of the pipe.
Formula: Area = pi(r²)
First: Find the Radius (r). r =1/2, r = 0.5 inch
Second: Convert the r from inches to feet. 0.5 / 12 = 0.0417
Third: Square the Radius. r² = 0.0417² = .00174
Fourth: Multiply by pi. 0.00174 X 3.14 = .00546
Therefore, the Area of a 1-inch pipe is 0.00546 ft²
Step three: Calculate the flow velocity: Once you know the area, the numbers can be
plugged into the original formula, V = Q / A.
Velocity = Q (0.0174 ft³/sec) / A (0.00546 ft²) = 2.657 feet/sec
In this case the flow velocity is less than 3 feet per second, and doesn’t
meet AAMI Standards. If this pipe were to have an internal diameter of ¾
inch, this calculation would result in a flow rate of 4.72 feet per second.
Please be aware that internal diameter of pipes is often slightly smaller
than stated. For example, the actual internal diameter of a 1-inch pipe is
about 0.95 inches.
Monitoring Your Dialysis Water Treatment System - June 2005 17
Northwest Renal Network - CMS Contract #500-03-NW16Flow rate monitoring summary
What to monitor: Flow rate at the end of your distribution loop, whether it is
returning to a tank or the RO system.
What to look for: You need to perform the calculations on you specific system to
determine the flow velocity of your pipes. After determining the minimum flow
rate needed to maintain a 3 ft/sec flow velocity, assure that your end of loop flow
always meets the required amount.
Table 2: Flow Velocity Chart
Pipe Size Flow Rate Flow Velocity
Inches (ID) in GPM feet / sec
1 6 2.452
1 6.5 2.657
1 7 2.861
1 7.5 3.065
1 8 3.270
1 8.5 3.474
1 9 3.679
1 9.5 3.883
1 10 4.087
0.75 5 3.633
0.75 5.5 3.997
0.75 6 4.360
0.75 6.5 4.723
0.75 7 5.086
0.75 7.5 5.450
0.5 5.5 8.992
0.5 6 9.810
0.5 6.5 10.627
0.5 7 11.445
0.5 7.5 12.262
Monitoring the Drain System:
There are some important things to consider in maintaining the drain lines in the dialysis
facilities.
The first is the requirement for a minimum 1-inch air gap between the equipment drain
line and the building drain pipes. This air gap prevents the possibility of sewage being
drawn into the machine, or direct contact with the drain line, in the event the sewer gets
backed up.
Second, dialysis drains can attract fruit flies, which create infection control issues within
the unit. If this occurs, some have reported that periodically pouring or straight household
bleach or a commercial gel product down the drains will resolve the problem.
Monitoring Your Dialysis Water Treatment System - June 2005 18
Northwest Renal Network - CMS Contract #500-03-NW16Drain system summary:
What to monitor: Periodically monitor your drain line placement. Monitor for
fruit flies in the unit
What to look for: A minimum 1-inch air gap at all connections to the drain
piping, absence of fruit flies
Monitoring of Disinfectants:
Water treatment systems and dialysis machines need to be disinfected periodically.
Chemicals such as bleach (chlorine), peracetic acid/hydrogen peroxide mixtures, and
formaldehyde are commonly used for this purpose. Whenever you use these or other
chemicals in the dialysis facility to disinfect your equipment, it is necessary to test the
concentrations. You should test the concentration of the solution you are using for
potency, to assure that you have an adequate concentration to achieve disinfection of the
system. After the disinfection procedure is complete and the system is rinsed, you must
test for the absence of that chemical in the system.
The test you use must be appropriate for the chemical you are using. Below is a list of
tests that are sometimes used in dialysis facilities that are not of the appropriate
sensitivity to assure that you meet AAMI standards.
Table 3: Inappropriate Disinfectant Tests
Test Method (Chemical) Sensitivity AAMI Standard
Starch Iodide Paper (Chlorine) 8-10 PPM 0.5 PPM
Starch Iodide Paper (Residual Peroxide) 25 PPM 3.0 PPM
Starch Iodide Paper (Peracetic acid potency) Tests strongly Should be negative
positive at 100 if below 500 PPM
PPM
Clinitest Tablets® (Formaldehyde) 80-160 PPM 5 PPM (3 PPM in
California)
Clinitest Strips® (Formaldehyde) Does not react at 5 PPM (3 PPM in
all California)
Hema-Stix® (Chlorine) 3-5 PPM 0.5 PPM
Documentation:
As the old saying goes, “If it isn’t documented, it wasn’t done.” This holds as true for
water treatment documentation as it does for clinical documentation. Log sheets should
be used to document each parameter of the treatment system. You must also document
the time, date and results of each quality test that you perform, such as chlorine testing,
hardness, etc. Every entry should be signed or initialed so that the person performing the
testing is known. There should be no blank spaces on the logsheet.
Monitoring Your Dialysis Water Treatment System - June 2005 19
Northwest Renal Network - CMS Contract #500-03-NW16Frequently Cited water Treatment Standards:
Below is a list of water treatment related standards that are most frequently cited during a
survey by regulatory agencies:
Water system disinfection: “The dates of disinfection and the dates and results of tests for
residual disinfectant should be recorded in the equipment maintenance record
accompanied by the signature or other unique means of identification of the person
performing the procedure."
Though this condition comes from the reuse section of the regulations, it is
required that equipment disinfection be performed and appropriately documented
when it is needed in all facilities.
Physical Environment: “Water used for dialysis purposes must be analyzed periodically
and treated as necessary to maintain a continuous water supply that is biologically and
chemically compatible with acceptable dialysis techniques.”
The most frequent circumstance cited under this regulation is the lack of
documentation that a facility responded appropriately to action levels of bacteria.
Maximum level of Chemical Contaminants: “The water used to prepare dialysate shall
not contain chemical contaminants at concentrations in excess of those in Table 2” (of the
AAMI standards).
The most common citation is regarding chlorine/chloramine testing. Common
errors include lack of documentation that it was tested at the specified frequency,
drawing the sample from the wrong place, and occasionally use of inappropriate
testing methodology.
Another issue that is sometimes cited is the backup water plan. The water for the
backup plan must meet AAMI standards and must be tested quarterly to ensure
compliance. This must include chemical contaminants, cultures and endotoxins.
Aluminum, copper, and/or fluoride are often high in softened, dechlorinated
water.
The Medical Director is responsible for “assuring adequate monitoring of the patient and
the dialysis process…”
The Medical Director is responsible for the quality of the water. There needs to be
documentation that the Medical Director is involved in monitoring the water
quality. This can be done through Continuous Quality Improvement (CQI)
meeting minutes, which indicate that s/he was in attendance. Many facilities have
the Medical Director initial the testing results to indicate that they have reviewed
Monitoring Your Dialysis Water Treatment System - June 2005 20
Northwest Renal Network - CMS Contract #500-03-NW16them. Any time the water treatment system is out of compliance, the Medical
Director can be cited for not assuring that it was in compliance.
Documentation: “Technical logs will meet the same documentation standards as the
medical records, including proper correction of errors.”
All spaces on log sheets should be filled in. If initials are put on logs to identify
the staff person, a signature list should be readily available to identify the users of
initials. Errors must be corrected by crossing out with a single line and the staff
initials written near the correction. The original entry should be decipherable.
Closing Thoughts
Thank you for taking the time to read this document. The Network believes that we have
provided some valuable information that will help you keep your patients safe. In
virtually every instance in which patients have come to harm from water treatment
systems in dialysis, there has been a lapse in effective monitoring. This document has
provided you with some tools, but it is up to each facility and each technician to use
them.
A good training program is very important. Technicians involved in monitoring the water
treatment system should have a good understanding of each component and how it works.
They should understand why each part of the system is important. They need to know
what parameters to document, and what the appropriate range is for each of them. They
need to know how to respond if there is ever a reading that is out of range.
It is also important to develop and follow good Continuous Quality Improvement
principles to “monitor your monitoring.” This assures that your monitoring program is
being adhered to by all staff in a consistent manner, and keeps the physicians and
administration informed of water treatment issues. It should also be designed to help
ensure regulatory compliance.
The last page of this document is a summary table that can serve as a quick reference guide
to the recommendations in this document. Please feel free to copy and distribute it as you
please. The Northwest Renal Network will post additional useful information on our
website, www.nwrenalnetwork.org. We would appreciate your contributions! If you have a
monitoring logsheet that you would like to share with other facilities, or any other
suggestions that you think would help patients in the Northwest, please let us know.
Northwest Renal Network’s Mission:
To promote optimal dialysis and transplant care for kidney
patients in Alaska, Idaho, Montana, Oregon and
Washington.
Monitoring Your Dialysis Water Treatment System - June 2005 21
Northwest Renal Network - CMS Contract #500-03-NW16Water Treatment Monitoring Summary
Component What to monitor What to look for
RP Device Pressure drop across the A pressure drop change of 10 PSI
device from baseline
Blending Valve Water temperature Appropriate water temperature,
minimal temperature fluxuation
Booster Pump Water pressure Pump turning on and off at the
appropriate pressures
Acid Feed Pump pH post feed pump pH should be between 7.0 and 8.0
Depth Filtration Pressure drop across the Pressure drop of 10 PSI or more
device. from normal operating pressures
when fresh.
Water Softener Post softener hardness, Hardness not exceeding 1 GPG
amount of salt in the brine (17.24 PPM), adequate amount of
tank. salt with no salt bridge.
Carbon Tank Chlorine and chloramine Chlorine levels within AAMI
levels after the worker tank standards (0.5 PPM chlorine, 0.1
before each patient shift PPM chloramine).
Reverse Osmosis Water pressure and flow at Changes from normal operating
Machine various locations throughout flows and pressures
Operating the system.
Parameters
DI Operating Pressure before and after Pressure drop of 10 PSI or more
Parameters each tank from normal operating pressures
when installed.
RO Water Quality Product water conductivity, Percent rejection greater than
percent rejection, periodic 80%, water analysis results within
water analysis AAMI standards
DI Water Quality Product water resistivity, Resistivity greater than 1 Meg
periodic water analysis Ohm, water analysis within
AAMI standards
Bacteria and Water Cultures and LAL Culture results less than the action
Endotoxin in RO, level of 50 CFU’s/ml, LAL less
Holding Tank and than the action level of 1 EU/ml
Product
Distribution Loop
Product Water Flow at the end of the loop Flow rate adequate to maintain a
Flow Velocity velocity of greater than 3 ft/sec
Monitoring Your Dialysis Water Treatment System - June 2005 22
Northwest Renal Network - CMS Contract #500-03-NW16You can also read