Development of a Building Occupant Survey System with 3D Spatial Information - MDPI
←
→
Page content transcription
If your browser does not render page correctly, please read the page content below
sustainability

Article
Development of a Building Occupant Survey System
with 3D Spatial Information
Jong-Won Lee 1,2 , Deuk-Woo Kim 2 , Seung-Eon Lee 2 and Jae-Weon Jeong 3, *
 1    Department of Architectural Engineering, College of Engineering, Hanyang University, Seoul 04763, Korea;
      jongwonlee@kict.re.kr
 2    Korea Institute of Civil Engineering and Building Technology, 283 Goyang-daero, Daehwa-dong, Ilsanseo-gu,
      Goyang-si 10223, Gyeonggi-do, Korea; deukwookim@kict.re.kr (D.-W.K.); selee2@kict.re.kr (S.-E.L.)
 3    Department of Architectural Engineering, Hanyang University, 222, Wangsimni-ro, Seongdong-gu,
      Seoul 04763, Korea
 *    Correspondence: jjwarc@hanyang.ac.kr; Tel.: +82-2-2291-9609

 Received: 27 October 2020; Accepted: 15 November 2020; Published: 27 November 2020

 Abstract: This paper summarizes the recent post-occupancy evaluation (POE) method studies and
 latest literature reviews. According to the research trends, data visualization of an occupant’s
 feedback is an important perspective and surveys through POE methods have provided a quick and
 cost-effective approach for gathering and analyzing an occupant’s feedback. Therefore, the objective
 of this study is to establish a web-based building occupant survey system that incorporates new
 approaches based on a geographic information system (GIS) tool and open-source spatial information.
 This paper reports the following to provide the detailed system framework: (1) development
 requirements from literature reviews; (2) integration of collected data and 3D (three dimensional)
 spatial information; (3) system processes and user-friendly functions; and (4) pilot test and data
 visualization. The difference between the proposed platform and existing online survey systems is
 that in the former the survey responses are linked to the 3D spatial information of the buildings on
 a map. Thus, the results provide more intuitive insights for building managers and occupants to
 identify specific performance issues related to the building.

 Keywords: building occupant survey system; post-occupancy evaluation (POE); indoor environmental
 quality (IEQ); occupant satisfaction; data visualization; geographic information system (GIS); open data;
 information integration

1. Introduction
     Post-occupancy evaluation (POE) is a comprehensive method of assessing buildings that have
been occupied for some time in order to evaluate the building’s actual performance and help resolve
operational issues, eventually enabling the building to attain a higher level of efficiency [1,2]. POE helps
obtain a building user’s feedback on the operational performance of the building, including the energy
performance, indoor environmental quality (IEQ), occupant satisfaction, and productivity [3–8].
Pinder et al. (2003) emphasized that building occupants, as the end users of buildings, can provide
insights into the building performance. Effective POE methods must be equipped with practices that
include interrelated responses of occupants who reside in the buildings [9–12].
     There are diverse POE methods to gain detailed and specific user feedback. Specifically, surveys and
interviews of occupants are typically incorporated into a POE framework [7,13]. Interviews are a good
method for in-depth discussions and insights into an occupant’s perception of the environment;
however, these approaches tend to be labor-intensive and difficult to examine. Although an in-depth

Sustainability 2020, 12, 9943; doi:10.3390/su12239943                        www.mdpi.com/journal/sustainability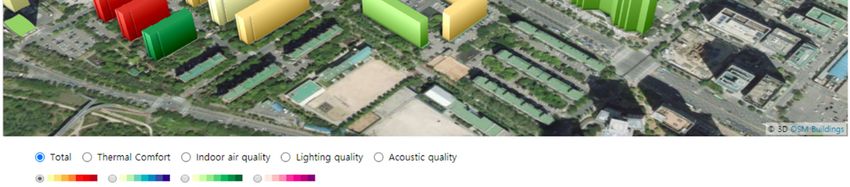
Sustainability 2020, 12, 9943                                                                        2 of 16

review is not feasible, surveys provide a quick and cost-effective method for gathering and analyzing
occupants’ feedback [14].
      Therefore, in POEs, building occupant surveys have generally been conducted as an important
evaluation tool to evaluate occupant satisfaction [7,15–17].
      The distribution of surveys conventionally involves labor-intensive delivery of paper-based
materials. As the conventional paper-based survey method requires researchers or surveyors to directly
visit the occupants of a building, the investigation time and costs are significant, particularly when there
are many occupants. In other words, paper-based surveys can be conducted only in a limited number
of buildings, which restricts the generalization and distribution of POE studies [7]. Furthermore, in the
event of a pandemic, such as COVID-19 (referring to the coronavirus disease that originated in 2019),
field surveys would need to be suspended, and alternative survey approaches would be required.
      To overcome the drawbacks of a paper-based survey, computer software for web-based surveys
has been developed since the 2000s [18,19]. For example, the Center for the Built Environment (CBE)
of the University of California, Berkeley has developed an occupant satisfaction survey, which is the
most widely used web-based questionnaire and reporting tool [14,19–21]. Other internationally used
survey tools include the Building Use Studies Ltd.’s PROBE (Post-occupancy Review of Buildings
and their Engineering) in the UK, Overall Liking Score, and Building Occupants Survey System
Australia [7,22–26]. New digital web-based tools, such as SurveyMonkey™, Qualtrics™, and Google
Forms™, have alleviated the technological obstacles related to the use of online surveys in obtaining
and analyzing occupant feedback [27–29]. In addition, optimized mobile devices are gradually being
deployed to evaluate occupant responses [30–34]. Today, researchers only need to send an invitation
email, and participants can complete the survey on smartphones [35–37].
      In recent POE studies, visualizing the data aggregated from surveys has gained attention.
In particular, geographic information system (GIS) technology has been employed in POE studies
as a powerful visualization tool [38–42]. GIS applications provide intuitive survey results with a
large array of statistical graphs on the map. In other words, a GIS-based spatial analysis in POE
studies can help better understand and identify patterns of the spatial distributions of occupant
satisfaction and dissatisfaction [43]. However, the GIS is specifically oriented to 2D (two dimensional)
systems (mapping, optimal routing), whereas architectures, such as buildings, are mainly three
dimensional [44–46].
      Building information modeling (BIM) has been employed alongside GIS technology as a spatial
information tool using a 3D computer-aided design (3D CAD). Ning and London (2010) and Porwal
and Hewage (2013) reported that the use of BIM will only increase in the near future, particularly for
POE, given the current state of BIM and its contribution to architecture, engineering, and construction
(AEC) industries [47,48]. However, BIM adoption in POE studies is still insufficient and has faced
significant drawbacks [49–51]. First, it is difficult to apply it to old and small buildings that do
not possess CAD floor plan files that are based on the BIM model. Second, the considerable time
required to generate a BIM model and the high cost of BIM software and high processing requirements
significantly limit the speed and cost-effectiveness of the survey. Thus, in this context, simple combined
open-source 3D spatial information is preferred over the BIM approach. Open sources are cost-effective
and customizable [52,53]. Therefore, it is necessary to base the framework development research of the
occupant survey system on open sources.
      Furthermore, in this study, two significant new literature reviews on POE have been analyzed to
find the directions for a future POE system and for a data visualization perspective. Li et al. (2018)
conducted a comprehensive and critical review of 146 POE projects published since 2010. Five directions
for future POE studies were reported:

1.     From one-off to continuing;
2.     From high-level to detailed;
3.     From researchers-oriented to owners/occupants-oriented;
4.     From academia to industry;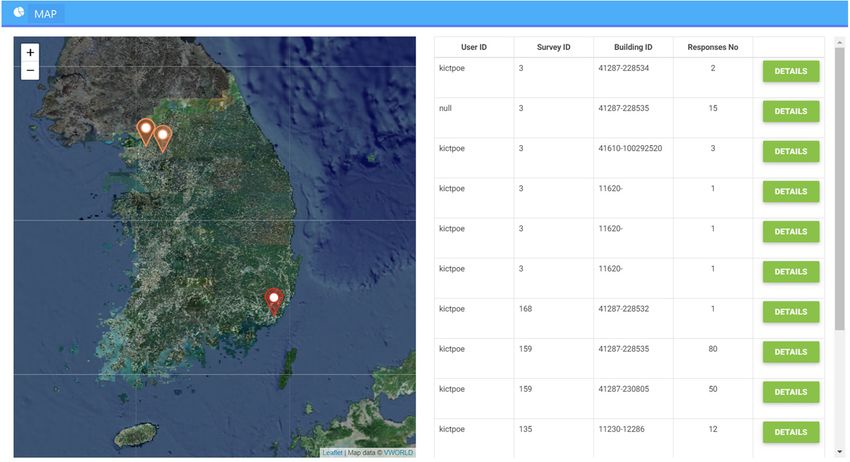
Sustainability 2020, 12, 9943                                                                        3 of 16

5.     From independent to integrated.

      Leitner et al. (2020) also established a systematic literature review of 55 papers published from
2013 to 2017 [54]. They concluded that there cannot be a single response or a perfect solution in the
elaboration of POEs. Thus, a single-size-fits-all POE approach may not be sufficient or even feasible [55].
In other words, it is necessary to design a flexible survey system that can be developed and customized
by users and developers.
      Solving the issues reported in the two literature reviews on POE is important to provide directions
for developing new systems. However, in contrast to the development of a global POE web-based
tool, POE studies in Korea have conducted one-off surveys without an occupant survey system model
that shows a comprehensive understanding of occupant’ responses [56–58]. A more advanced, new,
online survey system that can reflect the insights gained from many studies is required to gather
and analyze occupant responses cost-effectively. To be specific, a framework for building occupant
survey system that reflects these considerations, as well as connected to a comprehensive academic
perspective and the point of view of practitioners, needs to be developed.
      Therefore, this paper aims to fill this knowledge gap by developing a new system on the basis of the
country’s context as a general framework for use in other countries. It provides a better understanding
of the open source development for an occupant survey system. To be specific, the objective of this study
is to establish a web-based building occupant survey system that incorporates these characteristics and
is based on a GIS tool and open-source spatial information. The proposed system in this study aims to
include significant design characteristics as follows:

1.    The ability to conduct replicable and repeated occupant surveys in the same building. A sustainable
      POE with aggregated data could help identify the reasons for dissatisfaction that otherwise
      cannot be fully explained the first time. In this regard, a new system is required to design an
      integrated database.
2.    The ability to decipher the meaning of survey responses from broad aspects to in-depth details.
      For instance, the average satisfaction level of the occupants can be analyzed from the entire
      building level to detailed end-user patterns.
3.    The ability to practically develop the actual system to reflect the owner/occupant-oriented
      perspectives as well as the researcher-oriented perspective.
4.    The findings of the POE are often displayed in the form of technical figures and charts in a
      report or paper. Nonprofessionals, such as building owners and occupants, should be able to
      understand the building’s performance from the figures and charts. Multidimensional displays
      can improve the understanding of spatial distributions [42]. In this regard, GIS tools could be a
      great solution to visualize the occupant feedback and display the spatial analysis of the building
      on maps. Thus, it makes it easier to link diverse stakeholders from academia to industry. In other
      words, the industry as well as academic researchers can play an important role in driving the
      development and implementation of POE through data visualization.
5.    The new comprehensive system, involving related stakeholders, helps POE activity to be integrated
      into a cost-efficient building performance evaluation scheme.
6.    To enhance the flexibility of survey options, such as criteria, items, and categories, an easily
      changeable survey module with various open sources should be developed and integrated into
      the survey tool.

     This paper reports the following aspects: (1) integration of open data; (2) visualization of collected
data and 3D spatial information; and (3) pilot test.

2. Development of an Open-Source-Based Online Platform, K-BOSS
    We call the proposed system the Korean Building Occupant Survey System (K-BOSS). In Korea,
surveys for POE research are limited to temporary measurements and evaluations [58]. Therefore, it is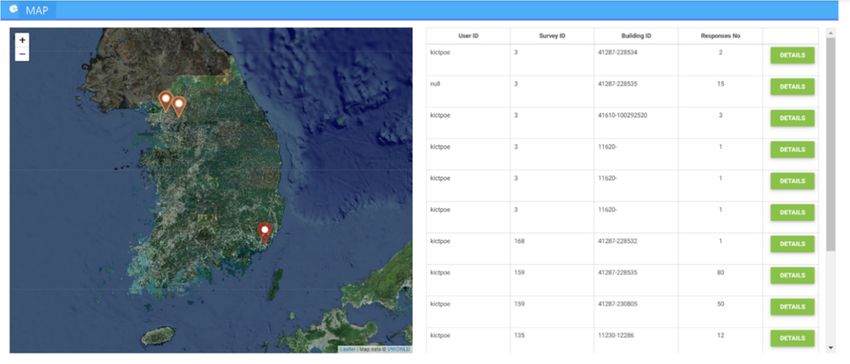
Sustainability 2020, 12, 9943                                                                                   4 of 16

necessary to discuss a new system that can systematically link, accumulate, and manage the data
collected from the occupants of each building. In this paper, we introduce the K-BOSS, including data,
added functions, survey process, and visualization.

2.1. Integration of Open Data from the Korean Government
     The primary reason for utilizing open-source libraries and public data (open data) from the Korean
government was to reduce the costs of development and data collection. Furthermore, public data
from government agencies provide high reliability and availability with annual updates. The road
name address building application programming interface (API) provided by the Spatial Information
Industry Promotion Institute’s V-World website and the GIS building-integrated information provided
by the National Spatial Data Infrastructure Portal both represent building information. For each
building address, if a bonding box is sent as a parameter in the latitude and longitude coordinates,
the information related to the buildings belonging to the corresponding area is returned to the system.
However, we checked which building information was more accurate and stable with the related
government agencies and decided to use the GIS building-integrated information only. The open data
used in the system are as follows in Table 1.

                                  Table 1. Used open data list in the system.

           Organization                          Data                                   Description
                                                                        When a user enters and searches an address
                                                                              in the system, a list of addresses
                                  Address and Location searching APIs
                                                                        corresponding to the search term is displayed
   Spatial Information Industry                                                         on the screen.
      Promotion Institute’s                                             The background map image is in the form of
         V-World website                   Background Map
                                                                                           a tile map
                                   Road Name Address Building API        Building information provided by V-World;
                                                                            The system searches for the building
       National Spatial Data                                                  information selected by the user.
       Infrastructure Portal      GIS building-integrated information      The polygon shape of each building is
                                                                           obtained, so it is displayed on the map.

     The map program used in the system was built using an open source library called Leaflet.
When developing a map function in a web system, it is possible to use other map services, such as
Google Maps; however, the purpose of the system is to achieve a low cost and high-efficiency
development using an open source map library. Leaflet [59] and Openlayers [60] are the most
commonly used open source map libraries. Leaflet was chosen due to the larger open source
community and expandability for additional functions.
     To represent buildings on a map in a polygonal form, it is necessary to use a function to draw
lines on the map in this Leaflet library with a list of latitude and longitude coordinates in the EPSG
(European Petroleum Survey Group): 4326 coordinate system. However, the GIS building-integrated
information API provided by the National Spatial Data Infrastructure Portal offers polygon data
of buildings with a list of latitude and longitude coordinates in the EPSG:5174 coordinate system.
Therefore, it is necessary to convert the list of latitude and longitude coordinates provided in the
EPSG:5174 coordinate system to the EPSG:4326 coordinate system to be adopted in the Leaflet library.
An open-source library called Proj4js [61] is used for this coordinate conversion, and the code for the
coordinate conversion is as follows.

2.2. Spatial Information Collection
      The difference between this platform and existing online survey systems is that the survey
information is linked to the shape and spatial information of the buildings. Thus, the collected data
can be visualized in three dimensions to determine any problems in the space (x, y, z), as shown
in Figure 1. To perform a 3D visualization, we collected the latitude (x), longitude (y), and height
(z) information, and mapped the survey results. A user can directly click the [x, y] latitude and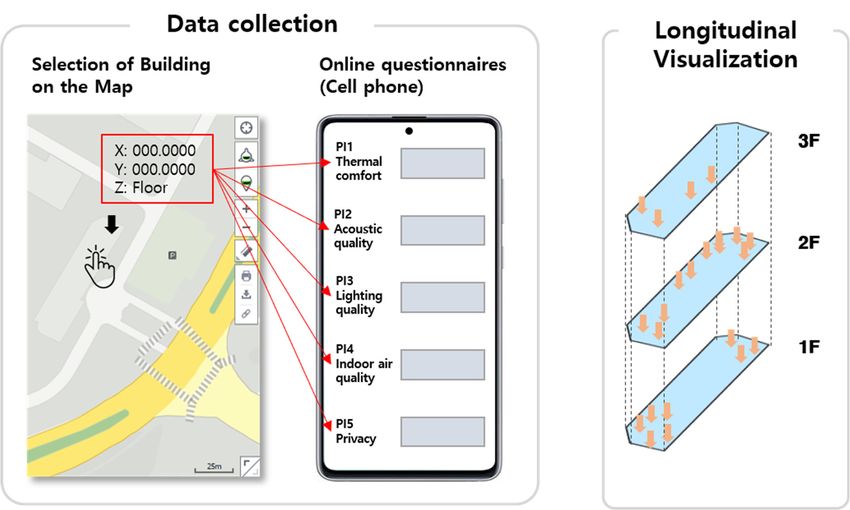
Sustainability 2020,
Sustainability 12, 12,
2020, 9943
x FOR PEER
x FOR REVIEW
PEER REVIEW 55of
of 16 16
5 of
information,
information, andandmapped
mapped thethesurvey
survey results. A user
results. A user can directly
can directlyclick thethe
click [x,[x,
y] y]
latitude
latitude and longitude
and longitude
longitude
points ononpoints
the map ontothe map ato2D
record record a 2Dafter
location, location,
which after which
thethe
user canthedirectly
user can directly
enter thetheenter the
height [z][z]
points the map to record a 2D location, after which user can directly enter height
height [z] information.
information. The interior The
of interior
the of the
building wasbuilding
visualized wasusing
visualized
the using theAPI
Indoor3D Indoor3D
open API open
source. The
information. The interior of the building was visualized using the Indoor3D API open source. The
source. The
feedback feedback
provided byprovided
thethe by theisoccupants
occupants displayed isindisplayed
multilevel incolors
multilevel
such colors
as red, such as red,
yellow, and yellow,
green.
feedback provided by occupants is displayed in multilevel colors such as red, yellow, and green.
and green.
ForFor
example, For example,
occupant occupant
satisfaction satisfaction
is displayed is displayed
in in
redred
if the in red
occupantsif the occupants
areare
notnot are
satisfied, not satisfied,
yellow if the
example, occupant satisfaction is displayed if the occupants satisfied, yellow if the
yellow if the
satisfaction satisfaction is normal, and green if the occupants are satisfied. While other existing
satisfactionis isnormal,
normal,and andgreen
greenif ifthetheoccupants
occupantsarearesatisfied.
satisfied.WhileWhileother
otherexisting
existingstudies
studies
studies conventionally
conventionally display display information
information through through
primary primary
methods methods
(mainly (mainly
graphs graphs
or or or floor
floor plans),
plans), this
conventionally display information through primary methods (mainly graphs floor plans), this
this study
study displays
displays results
results in ain3Da 3D space
space to to enhance
enhance thethe spatialintuitiveness
spatial intuitivenessfor forthe
theuser,
user, as
as shown
shown in in
study displays results in a 3D space to enhance the spatial intuitiveness for the user, as shown in
Figure 2.
Figure 2. 2.
Figure
Figure
Figure 1.1.Conceptual
Figure Conceptual
1. Conceptual model: data
model:
model: data collection
data in theinlatitude
collection
collection thethe
in latitude
latitude
[x], [x],[x],
longitude longitude
longitude
[y], [y],[y],
and height and
[z]andheight [z][z]
height
coordinates
coordinates
coordinates with online
with questionnaire
online [S]
questionnaire (left).
[S] Visualization
(left). Visualization of the
of collected
the collected
with online questionnaire [S] (left). Visualization of the collected information (right). information
information (right).
(right).
Figure 2. Visualization
Figure of results:
2. Visualization conventional
of results: conventional proposed
vs.vs.
proposed method
proposed (illustrative
method view).
(illustrative view).
2.3. System Working Process and Functions
2.3.2.3.
System Working
System Process
Working andand
Process Functions
Functions
The developed system consists of three functions: a survey creation function, a survey conduction
TheThedeveloped
developedsystem
systemconsists
consistsof ofthree
threefunctions:
functions:a asurvey
surveycreation
creationfunction,
function,a asurvey
survey
function, and a visualization function. Figure 3 shows a schematic of the main components.
conduction function, and a visualization function. Figure 3 shows a schematic
conduction function, and a visualization function. Figure 3 shows a schematic of the main of the main
components.
components.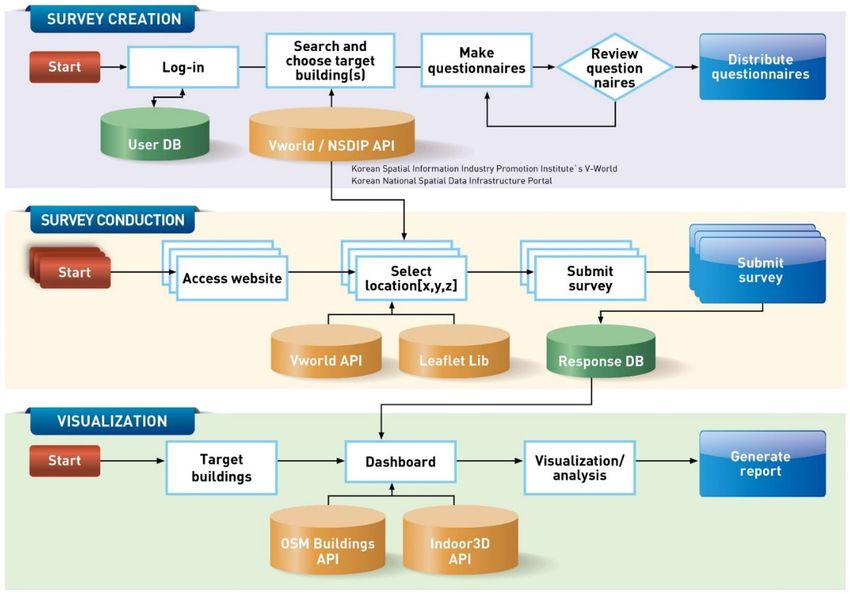
number in the survey and “Building ID” means the number of the state, city, and town and
      unique building number. Additionally, “Responses No” means the number of responses and
      “Details” shows the details of survey results. Furthermore, the dashboard displays the state of
      the surveyed buildings nationwide on a web-based GIS map and allows the entire list of
Sustainability
      buildings      12, be
               2020, to  9943downloaded to Excel. Building ID on the dashboard means building register
                                                                                                 6 of 16
      code in the GIS building-integrated information.

         Figure
         Figure 3.
                3. Operational
                   Operational process
                               process of
                                       of the
                                          the system:
                                              system: survey
                                                       surveycreation,
                                                              creation, conduction,
                                                                        conduction, and
                                                                                    and visualization.
                                                                                        visualization.

•   Survey creation function. This function is accessed by survey designers (researchers,
    facility managers, building owners, etc.). After logging in, the surveyor selects the building to
    be surveyed and then creates and distributes the questionnaires. The building to be surveyed
    is selected from the GIS building-integrated information provided by the National Spatial Data
    Infrastructure Portal. The process of creating the questionnaires is similar to other survey
    schemes; the main difference is that this system requires the respondents to choose their location
    in the building in terms of geospatial information (latitude [x], longitude [y], and height [z]).
    Furthermore, the survey can be customized for various purposes using open-source libraries.
•   Survey conduction function. This function is accessed by the survey respondents. A respondent
    accesses the distributed survey on the webpage and confirms the location and shape polygon of
    the building to be surveyed. First, the respondents type and choose the address of the building
    that they have occupied. Second, they choose their occupied location in the building by inputting
    the 3D spatial information [x, y, z] in the shape polygon of the building. After this process,
    the occupant satisfaction survey of their location commences. The final responses and location
    information completed and submitted by the respondents are saved in the database.
•   Visualization function. This function is accessed by the surveyor and respondents. To create a
    3D visualization of the collected dataset, a free editable map, OpenStreetMap (OSM), and OSM
    Buildings (3D building geometry data based on OSM), and API are used for the online map.
    In addition, the Indoor3D API is used for the 3D space. OSM Buildings and Indoor3D are open
    sources that provide a form that can be viewed directly in a web browser without having to install
    any program to express 3D visualization. The data from the response database are displayed
    in the dashboard, as shown in Figure 4. The dashboard service shows a building from a list
    of buildings on which the survey was conducted and detailed information on the buildings.
    In this figure, “User ID” means the K-BOSS’s user’s ID. “Survey ID means unique identification
    number in the survey and “Building ID” means the number of the state, city, and town and
    unique building number. Additionally, “Responses No” means the number of responses and
    “Details” shows the details of survey results. Furthermore, the dashboard displays the state of the
    surveyed buildings nationwide on a web-based GIS map and allows the entire list of buildings to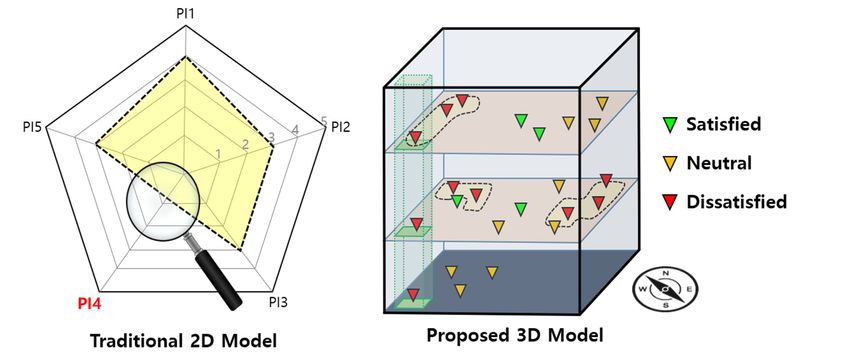
Sustainability 2020, 12, 9943                                                                                7 of 16

      be downloaded to Excel. Building ID on the dashboard means building register code in the GIS
      building-integrated information.

Sustainability 2020, 12, x FOR PEER REVIEW                                                                  7 of 16

                                             Figure 4. Dashboard screen.
                                             Figure 4. Dashboard screen.

2.4. User-Friendly
2.4. User-Friendly Functions
                     Functions of of K-BOSS
                                     K-BOSS
      The first
      The  firstscreen
                 screenofofthis system
                             this systemonon
                                          thethe
                                              website, as shown
                                                  website,       in Figure
                                                           as shown        5, contains
                                                                      in Figure        the following
                                                                                 5, contains          user-friendly
                                                                                              the following   user-
functions:    Q&A   bulletin    board, live chat, document    and  video  clip manual,   mobile  application
friendly functions: Q&A bulletin board, live chat, document and video clip manual, mobile application          link,
interactive
link,        user guide
      interactive         design.
                   user guide    design.

                     Figure 5. First page of Korean Building Occupant Survey System (K-BOSS).
                     Figure 5. First page of Korean Building Occupant Survey System (K-BOSS).

     The functions mentioned above are intended to provide a guide for various stakeholders who
can easily use the system as well as for researchers from an academic perspective. The details are as
follows:
•     Q&A: the Q&A bulletin board is for questions and answers on how to use the system between
      different users and between users and administrators. Anyone can register inquiries and
Sustainability 2020, 12, 9943                                                                       8 of 16

     The functions mentioned above are intended to provide a guide for various stakeholders who
can easily use the system as well as for researchers from an academic perspective. The details are
as follows:

•     Q&A: the Q&A bulletin board is for questions and answers on how to use the system between
      different users and between users and administrators. Anyone can register inquiries and answers
      regardless of membership registration. There is a button on the top right of the system. Questions
      and answers are documented through the Q&A bulletin board for other mid-term users and
      long-term users.
•     Live chat: although the Q&A bulletin board has a history management function in the long
      term, a live chat function is also applied to respond to immediate questions. Clicking the button
      at the lower-right corner of the site opens the chat window and allows users to chat with the
      administrator in real time. Through the live chat, a user can have a one-on-one conversation with
      the administrator in the system. If users leave inquiries in the chat window, administrators can
      view and respond to the chats not only on the web page but also on the mobile app. Anyone can
      enter a live chat without membership. This live chat function is developed as an open source.
•     User manual: an instruction video and a document manual have been added to the first main
      page of the system. The function of selecting the location in a building based on the GIS map
      provided by K-BOSS is a new concept, so users may find it initially difficult to use this function.
      Therefore, three video manuals are provided: “Selecting the location and number of floors in my
      building”, “Checking my building on a GIS satellite map”, and “Registering photo information”
      so that users can conveniently use the system. In addition, the system is used by the building
      managers as well as the occupants, so a manual for the administrators is added.
•     Mobile accessibility: the web-based survey system is not only used on the web but is also linked
      to a mobile application in order to have the expandability to conveniently participate in the survey
      anytime, anywhere. By clicking the messenger icon at the bottom right of the first webpage, a user
      can share the page via a messenger application. Users with whom it is shared can access K-BOSS
      and conduct surveys by clicking on the shared link in the messenger application.
•     Interactive user guide design: the system has an interactive user guide design based on Intro.js,
      an open source that allows web and mobile developers to easily build a step-by-step introduction.
      This open source is small, which is suitable for cost-effective systems. When clicking on the
      question mark in each description, it highlights parts of the system as a guide.

2.5. Survey System Open Source and API Interaction Function
     The K-BOSS was developed on the basis of WordPress, which has the most users in the world as an
open-source content management system. A system for administrators to create, edit, distribute surveys,
and for users to participate in the surveys was developed using WordPress’ plugin. The plugin is an
extension that allows the use of features that WordPress does not provide by default. The plugin can
be developed by the developer and installed on WordPress. The modified source code of the plugin
provides the survey function to search for an address, and then to select an occupant’s location in the
building through a map.
     In addition, the system can provide its own data through API services to other survey systems.
Other survey systems can access the API from K-BOSS and retrieve data from our system. Three types
of data can be provided: user API, building API, and response API. The user API is the information
provided by the respondents who log in to use and respond to the survey, and response API represents
the detailed responses of the occupants who have participated in the surveys. Table 2 lists the details.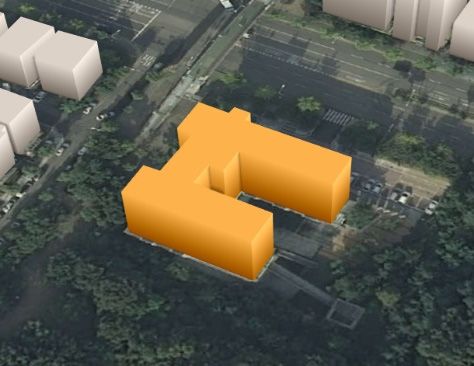
Sustainability 2020, 12, 9943                                                                                         9 of 16

                Table 2. User application programming interface (API) and response API information.

                     USER API                                                RESPONSE API
   Column Name                  Description          Column Name                         Description
         (ID)             (Table Primary Key)            (ID)                        (Table Primary Key)
     user_login                User ID                    m_id                    Survey ID (ID of survey table)
     user_pass              User Password                m_type                Survey form (form of survey table)
     user_name                Username                      ip                   Survey respondent’s IP address
     user_email          User Email Address              details         Survey response history-questions and answers
      user_url         User Homepage Address              info       Survey respondent’s web browser UserAgent information
   user_registered      User Registration Time        created_date                  Survey participation time

     Building API represents the building data retrieved through the Open API from the National
Spatial Data Infrastructure Portal, which is a hub for the spatial information published by the Korean
government. This Open API uses a GIS building-integrated identification number as the primary key.
Among them, the following list in Table 3 is provided through the K-BOSS:

                                              Table 3. Building API information.

                                                        BUILDING API
                 Column Name                                     Description
                GIS_IDNTFC_NO                 GIS building-integrated identification number
                               Vector file structure used to store the location and attribute information of
                    SHAPE
                                                         the points, lines, and faces
                SRC_OBJECTID      Raw Figure ID of the continuous cadastral map defined in open DB
                      PNU                                   Parcel Serial Number
               LD_CPSG_CODE               Administrative district code where the land is located
                    MNNM                   Identification value of the land (first section number)
                     SLNO                Identification value of the land (second section number)
              REGSTR_SE_CODE                                  Special land code
             BULD_PRPOS_CODE                                 Building use code
                 STRCT_CODE                                Building structure code
                       AR                                       Building area
               USE_CONFM_DE                              Building use approval date
                    TOTAR                                      Total floor area
                   PLOT_AR                                        Land area
                       HG                                          Height
                    BTL_RT                                  Building-to-land ratio
                MEASRMT_RT                                     Floor area ratio
              BULD_IDNTFC_NO                      Unique Building Identification number
                  VIOLT_BILD                              Violation of the building
           REFRN_SYSTM_CNTC_NO                          Reference system linkage key
               LAST_UPDT_DT                                     Database date

3. Pilot Test
      To evaluate the visualization in K-BOSS, pilot tests were conducted with developers and researchers.
Diverse and flexible parameters and questionnaires were created for K-BOSS. Specifically, we focused
on the fact that “occupant satisfaction” refers to an occupant’s subjective evaluation of the residential
conditions of a living space. Thus, the evaluations of occupant satisfaction must consider residential
environment factors. Many previous studies have classified residential environment factors in terms of
physical (climate, temperature, humidity), socio-cultural (geography, ethnicity, psychology), and economic
(costs) characteristics [62]. Among these parameters, IEQ, which requires a substantial amount of energy,
was found to have the greatest impact on residential satisfaction [63–66]. Thus, this pilot test prioritizes
the IEQ survey. Regarding the factors affecting the indoor residential environment studied in existing
literature, we identified thermal quality, acoustic quality, lighting quality, and indoor air quality as universal
factors affecting the indoor environment quality for evaluating the building’s performance [2,67–69].
Thus, this pilot test was performed with K-BOSS to collect information on four indoor environment
quality factors. The pilot test was conducted on a seven-point rating scale.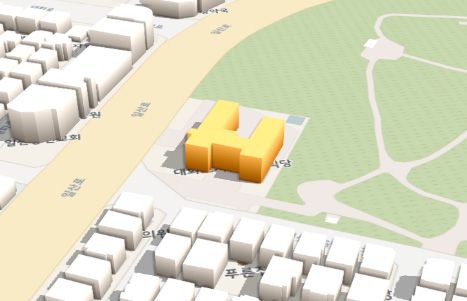
Sustainability 2020, 12, x FOR PEER REVIEW 10 of 16
thermal quality,
Sustainability 2020, 12, acoustic
9943 quality, lighting quality, and indoor air quality as universal factors affecting
10 of 16
the indoor environment quality for evaluating the building’s performance [2,67–69]. Thus, this pilot
test was performed with K-BOSS to collect information on four indoor environment quality factors.
TheThepilot3D
testscreens, shown on
was conducted in aFigure 6a,b, rating
seven-point are visualizations
scale. obtained through the pilot test.
An M-shaped building in Goyang-si, Korea is shown on
The 3D screens, shown in Figure 6a,b, are visualizations obtained through a background map the and
pilotontest.a An
satellite
M-
map.
shaped This building
building is a five-story
in Goyang-si, Korea building,
is shownand on ainformation
backgroundregarding
map and on thea number of floors
satellite map. This is
automatically
building is alinked frombuilding,
five-story the GIS building-integrated
and information regardinginformation. As it is difficult
the number of floorstoisidentify the exact
automatically
floor height, it was assumed that each floor is three meters tall, and the building height
linked from the GIS building-integrated information. As it is difficult to identify the exact floor height, is automatically
expressed on thethat
it was assumed map.eachIn floor
Figure 6c, the
is three occupant
meters satisfaction
tall, and the buildingis expressed using small cubic
height is automatically colors
expressed
byon the map. to
responding InaFigure
survey6c, on the IEQ
occupant
for eachsatisfaction
floor of theis building.
expressed The using small
color red cubic colors
indicates thatby
the
responding to a survey on the IEQ for each floor of the building. The color
resident is extremely dissatisfied with the IEQ factors, orange color indicates somewhat dissatisfied red indicates that the
resident is extremely
satisfaction, and yellow dissatisfied with the IEQ
indicates moderate factors, orange
satisfaction. Sincecolor indicates
the color of thesomewhat
occupantdissatisfied
satisfaction
satisfaction,
level and yellow
for each floor may not indicates moderate
be visible, satisfaction.
the building Since the in
is highlighted color of the occupant
translucent gray. satisfaction
level for each floor may not be visible, the building is highlighted in translucent gray.
(a)
(b) (c)
Figure6.6.Three-dimensional
Figure Three-dimensional spatial
spatialvisualization
visualization(a)(a)
onon
a background map;
a background (b) on
map; (b)aon
satellite map; map;
a satellite (c)
(c)on
onan
anindoor
indoormap.
map.
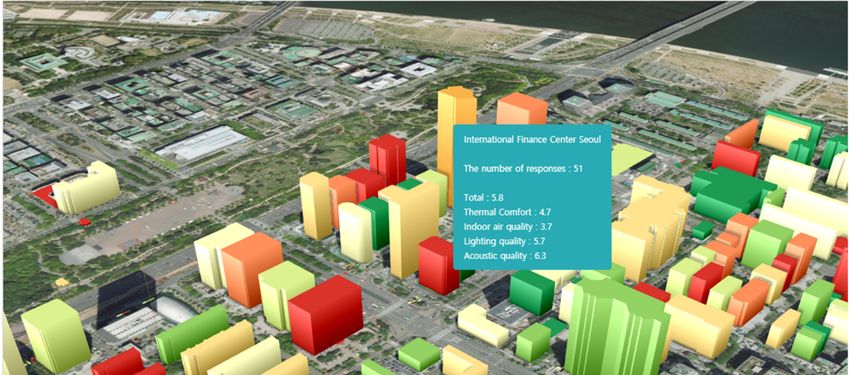
Anotherpilot
Another pilottest
testwas
wasperformed
performed atat the International
InternationalFinance
FinanceCenter
CenterSeoul
Seoulinin
Seoul city,
Seoul Korea,
city, Korea,
with
with 5151responses
responsesfor forthe
theIEQ
IEQfactors
factorsas
as shown
shown inin Figure
Figure 7.
7. All
Allthe
thebuildings
buildingsininthe
themap
mapshow
show thethe
average occupant satisfaction for the IEQ factors. The height of each building
average occupant satisfaction for the IEQ factors. The height of each building was automaticallywas automatically
visualizedfrom
visualized fromOpen
OpenAPI APIasasdescribed
described above.
above. Regarding
Regarding the
theIEQ
IEQfactors,
factors,buildings
buildingswith
witha ahighhigh
occupant satisfaction are colored closer to green, whereas buildings with a low IEQ satisfaction
occupant satisfaction are colored closer to green, whereas buildings with a low IEQ satisfaction are are
indicated
indicated ininred.
red.InInaddition,
addition,aaselection
selection box
box under
under the
the map
map was
wasadded
addedtotoshow
showthe
theaverage
averageofofallall
IEQIEQ
factors and of each of the four factors. For instance, when clicking on the International Finance Center
factors and of each of the four factors. For instance, when clicking on the International Finance Center
Seoul building, the number of responses, 51, appears in a blue box. The average value of the IEQ
Seoul building, the number of responses, 51, appears in a blue box. The average value of the IEQ
factors is expressed as total, and the average value of each of the four IEQ factors is displayed.
factors is expressed as total, and the average value of each of the four IEQ factors is displayed.Sustainability 2020, 12, 9943
x FOR PEER REVIEW 11 of
11 of 16
Sustainability 2020, 12, x FOR PEER REVIEW 11 of 16
Figure 7. Colorful building 3D visualization.
Figure7.7. Colorful
Figure Colorful building
building 3D
3D visualization.
visualization.
Specifically, the indoor visualization of the International Finance Center Seoul is as follows: for
Specifically,the
Specifically, theindoor
indoor visualization
visualizationofofthetheInternational
InternationalFinance
Finance Center Seoul
Center is asisfollows:
Seoul for
as follows:
each floor, when the respondents selected occupant satisfaction for the IEQ factors as an example, the
each floor, when the respondents selected occupant satisfaction for the IEQ factors
for each floor, when the respondents selected occupant satisfaction for the IEQ factors as an example,as an example, the
satisfaction level of the IEQ factors was expressed in color up to the 17th floor. Figure 8 shows the
satisfaction
the satisfaction level
levelof of
thetheIEQ
IEQfactors
factorswas
wasexpressed
expressed inincolor upup
color totothe
the17th
17thfloor.
floor.Figure
Figure8 8shows
showsthethe
average value of the IEQ factors for each floor. Figure 9 shows the satisfaction level on the first and
average value of the IEQ factors for each floor. Figure 9 shows the satisfaction level
average value of the IEQ factors for each floor. Figure 9 shows the satisfaction level on the first and on the first and
17th
17thfloors
floorsin color and the average value of
of each IEQ factor
factor for each
each floor
floorin inthe
thesmall
smallboxboxononthe
the
17th floors in in color
color andandthethe average
average value
value of eacheach
IEQIEQ
factor for for
each floor in the small box on the right.
right.
right.
Figure 8. Building indoor visualization.
Figure
Figure 8. Building
8. Building indoor
indoor visualization.
visualization.Sustainability 2020, 12, 9943 12 of 16
Sustainability 2020, 12, x FOR PEER REVIEW 12 of 16
Figure9.9.International
Figure InternationalFinance
Finance Center
Center Seoul
Seoul indoor
indoorvisualization:
visualization:(a)
(a)first
firstfloor,
floor,(b)
(b)17th floor.
17th floor.
4. 4.Discussion
Discussion
Thedifference
The differencebetween
betweenthis thisplatform
platform and the existing
existing online
onlinesurvey
surveysystems
systemsisisthat the
that thesurvey
survey
information is linked to the shapes
information is linked to the shapes on the on the map and the spatial information of the buildings provided
the spatial information of the buildings provided
byby thethe government.Since
government. Sincethethesystem
systemisislinked
linkedininthe
theAPI
APIformat,
format,thethemap
mapandandbuilding
buildinginformation
information of
of the system are automatically updated when the data provided by the
the system are automatically updated when the data provided by the government are periodically government are periodically
updated.This
updated. Thisisisdifferent
differentfromfromother
other survey
survey systems
systems that
thatonly
onlyhave
haveaadatabase
databaseofofoccupant
occupant feedback.
feedback.
In addition, since this system emphasizes data visualization using GIS and
In addition, since this system emphasizes data visualization using GIS and 3D spatial information, 3D spatial information, it
helps to intuitively view information on occupant satisfaction in the
it helps to intuitively view information on occupant satisfaction in the buildings and on the map.buildings and on the map.
Specifically, while only the overall occupant satisfaction could be known for each building or floor in
Specifically, while only the overall occupant satisfaction could be known for each building or floor in
other existing systems, this system provides a service that helps analyze specific satisfaction levels
other existing systems, this system provides a service that helps analyze specific satisfaction levels for
for each occupied location by identifying the occupant’s x- and y-coordinate information.
each occupied location by identifying the occupant’s x- and y-coordinate information. Furthermore,
Furthermore, while other systems with a 2D-based planar maps provide 2D information, our system
while other systems with a 2D-based planar maps provide 2D information, our system provides 3D
provides 3D information, so that both horizontal and vertical information of the building can be
information, so that both horizontal and vertical information of the building can be intuitively known.
intuitively known. For example, if an occupant is dissatisfied with the noise problem on the
For example, if an occupant is dissatisfied with the noise problem on the northwest side of the building
northwest side of the building in each floor, it helps to conclude that there is a noise problem in the
innorthwest
each floor,direction.
it helps to conclude that there is a noise problem in the northwest direction.
This
This study alsoconducted
study also conducted a test
a pilot pilotandtest and cost-effective
showed showed cost-effective data Light
data visualization. visualization.
open-
Light open-source libraries can help quickly load diverse functions
source libraries can help quickly load diverse functions such as rotation and zoom. Since this such as rotation and zoom.
system
Since this system is flexible and changeable regarding the creation of new questionnaires
is flexible and changeable regarding the creation of new questionnaires of occupant satisfaction, the of occupant
satisfaction,
IEQ factorsthe canIEQ factors can be
be customized on customized
a 5-point or on a 5-point
7-point scaleor 7-point
along withscale along
colors. A 3Dwith colors. was
building A 3D
building
created with latitude and longitude coordinates similar to the polygon coordinate data of the of
was created with latitude and longitude coordinates similar to the polygon coordinate data
the building.
building. Accordingly,
Accordingly, it it
is is possible
possible toto provide
provide the
the user
user with
with various
various types
types ofof visualization
visualization results
results
that
thatcancanbebeswitched
switched between
betweentwo twodimensions
dimensionsand andthree
threedimensions.
dimensions.InInotherotherwords,
words,aabuilding
buildingcancanbe
automatically
be automatically created withwith
created onlyonly
polygonal
polygonal latitude andand
latitude longitude
longitude coordinates.
coordinates.
5. 5.Conclusions
Conclusions
The
Thepaper
papersummarized
summarized andand analyzed
analyzed the recent
recent POE
POE studies
studiesininview
viewofofthe
theimportance
importance andand
capabilities
capabilitiesofofa anew
newoccupant
occupantsurvey
survey system based
based on
onGIS
GIStools
toolsand
andopen-source
open-source spatial
spatial information.
information.
Furthermore,
Furthermore, directions
directions for future
for future POE research
POE research reportedreported
in recentinliterature
recent literature
reviews were reviews were
incorporated
inincorporated
the occupant in the occupant
survey survey
system with system with
the following six the following
categories: (1)six categories:
from one-off to(1) from one-off
continuing, to
(2) from
continuing, (2) from high-level to detailed, (3) from researchers-oriented to owners/occupants-Sustainability 2020, 12, 9943 13 of 16
high-level to detailed, (3) from researchers-oriented to owners/occupants-oriented, (4) from academia
to industry, (5) from independent to integrated, (6) design of a flexible survey system.
It is important to develop the Korean Building Occupant Survey System. Compared to the heavy
visualization system using BIM [40–43], this quick and cost-effective building occupant survey system
is expected to significantly reduce time and costs associated with similar systems. Most importantly,
this paper provides detailed used data and a framework development process on how to connect
3D spatial information, so that other developers can follow and use open sources such as OSM and
Indoor3D that are available in other countries.
In addition, the collected survey responses provide more intuitive insights for the owner and
occupants of the building with data visualization through a web-based survey system. In this
study, pilot tests were performed to confirm how 3D data visualization can be well displayed and
how well it can assist visual inspection intuitively. Therefore, with the 3D visualization function,
building managers and owners can check the building’s environmental performance in a short
time. Similarly, human resources personnel who wish to conduct a survey on the indoor environment
satisfaction of employees can check the employees’ feedback for their IEQ. From a long-term perspective,
it is expected that policymakers and planners can compare low and high building performance by
comparing neighborhoods, as shown in Figure 7, and thus the results of the system can be evidence for
helping propose regulations on building performance improvement [70].
However, studies on specific literature analysis and factor selection for the IEQ were not
conducted. Thus, it is necessary to conduct research on IEQ factors. In addition, we were unable
to suggest a direction for analyzing occupant satisfaction and the visualization displayed vertically.
Thus, future studies are needed to conduct a case study of occupants in an actual building to suggest a
direction for statistical analysis with 3D visualization.
Author Contributions: Conceptualization, formal analysis, writing—original draft preparation, J.-W.L.;
project administration, funding acquisition, S.-E.L.; conceptualization, writing—review and editing, D.-W.K.;
writing—review and editing, supervision, J.-W.J. All authors have read and agreed to the published version of
the manuscript.
Funding: This research was funded by the Major Project of the Korea Institute of Civil Engineering and Building
Technology (KICT) (grant number 20200287-001) and (grant number 20190144-001).
Acknowledgments: The paper has been substantially updated with the fruitful discussions and analysis from
the conference paper, “Design of online platform and visualization system based on three-dimensional spatial
information for occupant satisfaction with indoor environment quality” (DOI: 10.1088/1757-899X/609/4/042037).
Conflicts of Interest: The authors declare no conflict of interest.
References
1. Corgnati, S.; da Silva, M.G.; Ansaldi, R.; Asadi, E.; Costa, J.; Filippi, M.; Kaczmarcczyk, J.; Melikov, A.;
Olesen, B.; Popiolek, Z. REHVA-Indoor Climate Quality Assessment; Guidebook No.14; REHVA: Brussels,
Belgium, 2011.
2. Frontczak, M.; Schiavon, S.; Goins, J.; Arens, E.A.; Zhang, H.; Wargocki, P. Quantitative relationships between
occupant satisfaction and satisfaction aspects of indoor environmental quality and building design. Indoor Air
2012, 22, 119–131. [CrossRef] [PubMed]
3. Hay, R.; Samuel, F.; Watson, K.J.; Bradbury, S. Post-occupancy evaluation in architecture: Experiences and
perspectives from UK practice. Build. Res. Inf. 2018, 46, 698–710. [CrossRef]
4. Bordass, B.; Cohen, R.; Standeven, M.; Leaman, A. Assessing building performance in use 2:
Technical performance of the Probe buildings. Build. Res. Inf. 2001, 29, 103–113. [CrossRef]
5. Bordass, B.; Cohen, R.; Standeven, M.; Leaman, A. Assessing building performance in use 3:
Energy performance of the Probe buildings. Build. Res. Inf. 2001, 29, 114–128. [CrossRef]
6. Bordass, B.; Leaman, A. Making feedback and post-occupancy evaluation routine 1: A portfolio of feedback
techniques. Build. Res. Inf. 2005, 33, 347–352. [CrossRef]
7. Li, P.; Froese, T.M.; Brager, G. Post-occupancy evaluation: State-of-the-art analysis and state-of-the-practice
review. Build. Environ. 2018, 133, 187–202. [CrossRef]Sustainability 2020, 12, 9943 14 of 16
8. Duarte Roa, C.; Schiavon, S.; Parkinson, T. Targeted Occupant Surveys: A Novel Method to Effectively
Relate Occupant Feedback with Environmental Conditions. CBE Report. June 2020. Available online:
https://escholarship.org/uc/item/9sj1c34p (accessed on 25 November 2020).
9. Pinder, J.; Price, I.F.; Wilkinson, S.J.; Demack, S. A method for evaluating workplace utility. Prop. Manag.
2003, 21, 218–229. [CrossRef]
10. Cole, R.J.; Robinson, J.; Brown, Z.; Shea, M. Re-contextualizing the notion of comfort. Build. Res. Inf.
2008, 36, 323–336. [CrossRef]
11. Janda, K.B. Buildings don’t use energy: People do. Archit. Sci. Rev. 2011, 54, 15–22. [CrossRef]
12. Lowe, R.; Chiu, L.F.; Oreszczyn, T. Socio-technical case study method in building performance evaluation.
Build. Res. Inf. 2018, 46, 469–484. [CrossRef]
13. Preiser, W.F.; Hardy, A.E.; Schramm, U. From linear delivery process to life cycle phases: The validity of the
concept of building performance evaluation. In Building Performance Evaluation; Springer: Berlin, Germany,
2018; pp. 3–18.
14. Graham, L.T.; Parkinson, T.; Schiavon, S. Where Do We Go Now? Lessons Learned Form 20 Years of
CBE’s Occupants Survey. 2020. Available online: https://escholarship.org/uc/item/8k20v82j (accessed on
25 November 2020).
15. Clements-Croome, D. (Ed.) Post-occupancy evaluation. In Intelligent Buildings: An Introduction; Routledge:
Abingdon, UK, 2014.
16. Humphreys, M.A. Field studies of thermal comfort compared and applied. Build. Serv. Eng. 1976, 44, 5–27.
17. Tang, H.; Ding, Y.; Singer, B.C. Post-occupancy evaluation of indoor environmental quality in ten
nonresidential buildings in Chongqing, China. J. Build. Eng. 2020. [CrossRef]
18. Newsham, G.R.; Tiller, D.K. A field study of office thermal comfort using questionnaire software.
ASHRAE Trans. 1997, 103, 3–17.
19. Zagreus, L.; Huizenga, C.; Arens, E.; Lehrer, D. Listening to the occupants: A web-based indoor environmental
quality survey. Indoor Air 2004, 14, 65–74. [CrossRef] [PubMed]
20. CBE. Occupant Indoor Environmental Quality (IEQ) Survey and Building Benchmarking.
2020. Available online: https://cbe.berkeley.edu/research/occupant-survey-and-building-benchmarking/
(accessed on 25 November 2020).
21. CBE. Occupant Survey Toolkit. Berkeley, CA: Center for the Built Environment. 2020. Available online:
https://cbe.berkeley.edu/resources/occupant-survey/ (accessed on 25 November 2020).
22. Cohen, R.; Standeven, M.; Bordass, B.; Leaman, A. Assessing building performance in use 1: The Probe
process. Build. Res. Inf. 2001, 29, 85–102. [CrossRef]
23. Levermore, G.J. Occupants’ assessments of indoor environments: Questionnaire and rating score method.
Build. Serv. Eng. Res. Technol. 1994, 15, 113–118. [CrossRef]
24. Candido, C.; Kim, J.; De Dear, R.; Thomas, L. BOSSA: A multidimensional post-occupancy evaluation tool.
Build. Res. Inf. 2016, 44, 214–228. [CrossRef]
25. Dykes, C.; Baird, G. A review of questionnaire-based methods used for assessing and benchmarking indoor
environmental quality. Intell. Build. Int. 2013, 5, 135–149. [CrossRef]
26. Candido, C.; Dear, R.; Thomas, L.; Kim, J.; Parkinson, T. Introducing BOSSA: The Building Occupants Survey
System Australia’; Ecolibrium: Melbourne, Australia, 2013.
27. Finley, R. SurveyMonkey; SurveyMonkey: San Mateo, CA, USA, 2019.
28. Qualtrics, L.L.C. Qualtrics: Online Survey Software & Insight Platform; Qualtrics Labs, Inc.: Provo, UT, USA, 2014.
29. Google. Google Forms: Free Online Surveys for Personal Use; Google: Mountain View, CA, USA, 2019.
Available online: https://www.google.com/forms/about/ (accessed on 25 November 2020).
30. Parkinson, T.; Candido, C.; de Dear, R. ‘Comfort Chimp’: A MultiPlatform IEQ Questionnaire Development
Environment. In Proceedings of the 11th REHVA World Congress and 8th International Conference on
IAQVEC, Prague, Czech Republic, 16–19 June 2013.
31. Parkinson, T.; Parkinson, A.; de Dear, R. Continuous IEQ monitoring system: Performance specifications
and thermal comfort classification. Build. Environ. 2019, 149, 241–252. [CrossRef]
32. Parkinson, T.; Parkinson, A.; de Dear, R. Introducing the SAMBA indoor environmental quality monitoring
system. Living Learn 2015, 1139–1148.
33. de Dear, R.; Kim, J.; Parkinson, T. Residential adaptive comfort in a humid sub- tropical climate—Sydney
Australia. Energy Build 2018, 158, 1296–1305. [CrossRef]Sustainability 2020, 12, 9943 15 of 16
34. Nian, F.Z.; Wang, K.; Zhao, Q.C. Research on indoor environmental comfort based on complaints. Int. J.
Innov. Comp. Inf. Control 2017, 13, 1323–1333.
35. Geng, Y.; Ji, W.; Wang, Z.; Lin, B.; Zhu, Y. A review of operating performance in green buildings: Energy use,
indoor environmental quality and occupant satisfaction. Energy Build. 2019, 183, 500–514. [CrossRef]
36. O’Brien, W.; Schweiker, M.; Day, J.K. Get the picture? Lessons learned from a smartphone-based
post-occupancy evaluation. Energy Res. Soc. Sci. 2019, 56, 101224. [CrossRef]
37. Day, J.K.; Ruiz, S.; O’Brien, W.; Schweiker, M. Seeing is believing: An innovative approach to post-occupancy
evaluation. Energy Effic. 2020. [CrossRef]
38. Xia, J. Visualizing Occupancy of Library Study Space with GIS Maps; New Library World: Cambridge, UK, 2005.
39. Göçer, Ö.; Hua, Y.; Göçer, K. Completing the missing link in building design process: Enhancing
post-occupancy evaluation method for effective feedback for building performance. Build. Environ.
2015, 89, 14–27. [CrossRef]
40. Göçer, Ö.; Hua, Y.; Göçer, K. A BIM-GIS integrated pre-retrofit model for building data mapping. Build. Simul.
2016, 9, 513–527. [CrossRef]
41. Göçer, Ö.; Göçer, K.; Karahan, E.E.; Oygür, I.İ. Exploring mobility & workplace choice in a flexible office
through post-occupancy evaluation. Ergonomics 2018, 61, 226–242.
42. Göçer, Ö.; Göçer, K.; Başol, A.M.; Kıraç, M.F.; Özbil, A.; Bakovic, M.; Siddiqui, F.P.; Özcan, B. Introduction of
a spatio-temporal mapping based POE method for outdoor spaces: Suburban university campus as a case
study. Build. Environ. 2018, 145, 125–139.
43. Hua, Y.; Göçer, Ö.; Göçer, K. Spatial mapping of occupant satisfaction and indoor environment quality in a
LEED platinum campus building. Build. Environ. 2014, 79, 124–137. [CrossRef]
44. Chrisman, N.R. Exploring Geographic Information Systems; Wiley: New York, NY, USA, 1997.
45. Demers, M.N. Fundamentals of Geographic Information Systems; Wiley: New York, NY, USA, 1997.
46. Nichol, J.E. Monitoring Singapore’s microclimate. Geo-Info-System 1993, 3, 51–55.
47. Ning, G.; London, K. Understanding and facilitating BIM adoption in the AEC industry. Autom. Constr.
2010, 19, 988–999.
48. Porwal, A.; Hewage, K.N. Building information modeling (BIM) partnering framework for public construction
projects. Autom. Constr. 2013, 31, 204–214. [CrossRef]
49. Ozturk, Z.; Arayici, Y.; Coates, P. Post Occupancy Evaluation (POE) in Residential Buildings Utilizing BIM
and Sensing Devices: Salord Energy House Example, Tuesday 24 Jan e Thursday 26 Jan, 2012; The Lowry:
Greater Manchester, UK, 2012.
50. Motawa, I.; Corrigan, W.; Architects, W.S. Sustainable BIM-Driven Post-Occupancy Evaluation for Buildings;
CIC Start Feasibility Study: Glasgow, Scotland, 2012; pp. 1–12.
51. Motawa, I.; Carter, K. Sustainable BIM-based evaluation of buildings. Procedia Soc. Behav. Sci. 2013, 74, 419–428.
[CrossRef]
52. West, J.; Dedrick, J. Open source standardization: The rise of Linux in the network era. Know. Technol. Policy
2001, 14, 88–112.
53. West, J. How open is open enough: Melding proprietary and open source platform strategies. Res. Policy
2003, 32, 1259–1285. [CrossRef]
54. Sanchez Leitner, D.; Christine Sotsek, N.; de Paula Lacerda Santos, A. Postoccupancy evaluation in buildings:
Systematic literature review. J. Perform. Constr. Facil. 2020, 34, 03119002. [CrossRef]
55. Leaman, A.; Bordass, B. Are users more tolerant of ‘green’ buildings? Build. Res. Inf. 2007, 35, 662–673.
[CrossRef]
56. Kim, H.G.; Kim, S.S. Occupants’ Awareness of and Satisfaction with Green Building Technologies in a
Certified Office Building. Sustainability 2020, 12, 2109. [CrossRef]
57. Lee, J.; Shepley, M. Analysis of human factors in a building environmental assessment system in Korea:
Resident perception and the G-SEED for MF scores. Build. Environ. 2018, 142, 388–397. [CrossRef]
58. Jong-Won, L.; Deuk-Woo, K.; Seung-Eon, L. Research on comparison and analysis of online occupant
satisfaction survey system focusing on post-occupancy evaluation. J. Korean Inst. Archit. Sustain. Environ.
Build. Syst. 2019, 13, 580–589.
59. Leaflet—A JavaScript Library for Interactive Maps. Available online: https://leafletjs.com (accessed on
21 October 2020).
60. OpenLayers—Welcome. Available online: https://openlayers.org (accessed on 21 October 2020).You can also read