Reliability Outlook An adequacy assessment of Ontario's electricity system - From January 2020 to December 2024
←
→
Page content transcription
If your browser does not render page correctly, please read the page content below
Reliability Outlook
An adequacy assessment of Ontario’s
electricity system

FROM JANUARY 2020 TO DECEMBER 2024
Executive Summary
Ensuring Ontarians have the electricity they need, when they need it, is at the heart of the Independent
Electricity System Operator’s mandate. Maintaining a reliable system over the short- and long-term depends
on comprehensive system planning that assesses whether the system has enough resources to reliably serve
forecast demand, and evaluates the grid’s ability to operate reliably over a broad range of system conditions,
including extreme weather and facility or resource unavailability.

The results of our reliability assessments drive decision-making, whether short term – as in when to schedule
outages – or, over the long term, which allows developers and investors to respond to the needs and price
signals, and invest accordingly. The latter is addressed in the IESO’s upcoming Annual Planning Outlook
(APO), which provides a comprehensive demand forecast, capacity and energy adequacy assessment, as well
as an outlook on transmission planning over a 20-year horizon.

If the APO looks at big-picture adequacy requirements for investment and asset management, the Reliability
Outlook zeroes in on the near and mid-term – what will be needed for real and near-time operations when
reliability may come into question, and when market participants will need to be prepared to adjust plans
when necessary. Each issue of the quarterly Reliability Outlook looks at four scenarios for the upcoming 18-
month period: normal weather, firm resource (only includes those currently in service); normal weather,
planned resource (includes those that are scheduled to come into service during the planning period);
extreme weather, firm resource; and extreme weather, planned resource.

Twice a year, in summer and winter, this report complements the 18-month outlook with an extended view
that takes into account the following 42 months, providing broader (but less certain) insights over a five-year
horizon.

The IESO’s outage management policy is designed to ensure Ontario has enough reserve on hand to maintain
reliability during extreme weather conditions and the conservative firm scenario, assuming up to 2,000
megawatts (MW) of import availability.

Scheduling outages to support reliability
In this 18-month forecast, reliability concerns could arise during the summers of 2020 and 2021. However, by
proactively managing outages and with plans for new generation coming online, these concerns can be
mitigated. Looking ahead over the broader five-year forecast, where greater uncertainty exists around
weather and outage planning, the potential for increased reliability concerns emerges over the summers, from
2022 to 2024.

Independent Electricity System Operator | Public                                                                 1
Summer continues to be the season when both the firm and planned scenarios point to potential reliability
concerns in extreme weather conditions. For these reasons, the IESO recommends that, wherever possible,
outages be scheduled outside the summer months.
Periods to Watch: Near term Periods to Watch: Longer term
June 2020: four weeks June 2021: five weeks
July 2020: three weeks 2022: June to September
August 2020: two weeks 2023: June to September
September 2020: one week 2024: June to September
Overview of the 18-month forecast
Ontario’s economic growth expected to increase demand
Starting in 2020, energy demand – which has remained fairly flat since the recession – is anticipated to
increase gradually, owing to projected population growth and economic indicators (low Canadian dollar,
strong U.S. economy) that support the province’s export-oriented, energy-intensive manufacturing sector.
That said, these may be counterbalanced by risks related to ongoing trade tensions, climate impacts and
global economic uncertainty. If these risks do not materialize, Ontario’s increasing economic output is
expected to drive peak demand up slightly over the 18 months to June 2021. The downward pressure is
expected to ease from energy-efficiency programs, growing contributions from DERs and the Industrial
Conservation Initiative (ICI).
Reduced summer peaks expected to rise again
Combined, the effects of the ICI and the growth of solar-powered distributed energy resources have resulted
in summer peaks that are lower in magnitude, and occur later in the day. As solar capacity is plateauing and
energy-efficiency savings beyond 2020 are uncertain, peaks are forecast to rise again over the 18 months
from January 2020 to June 2021.
The forecast sees sufficient generation supply for winter 2020, as well as winter 2020/21. While risks may
arise in the heat of summer 2020 and the early part of summer 2021, they should be mitigated by outage
rescheduling. Over the next 18 months, approximately 1,500 MW of new generation are planned to come into
service, while only 38 MW of generation will reach the end of its contract life.
Addressing reserve requirements
When reserves fall below required levels, the IESO may be required to reject some generator maintenance
outage requests if extreme weather conditions materialize.
Independent Electricity System Operator | Public 2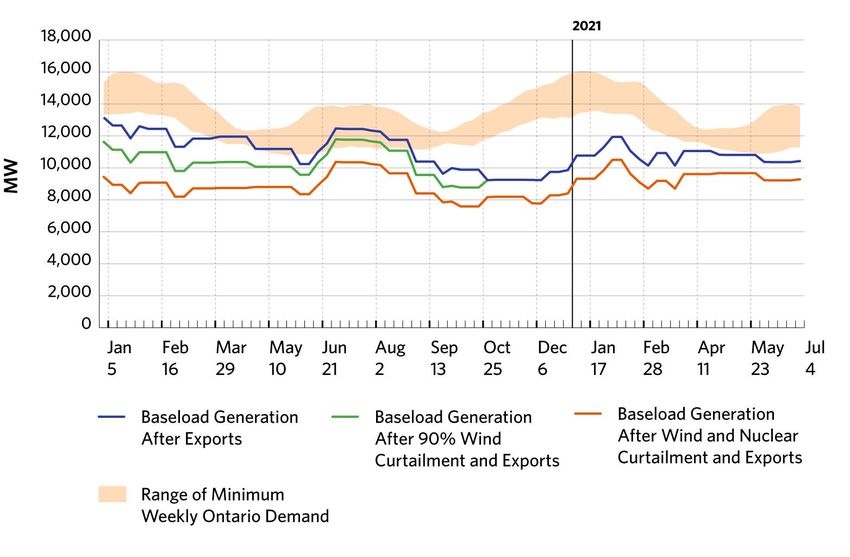
The reserve is lower than the requirement, without reliance on imports, for a total of 16 weeks in 2020 and
eight weeks in the first half of 2021, with potential shortfalls forecast for four weeks in June 2020, three
weeks in July 2020, two weeks in August 2020, one week in September 2020 and five weeks in June 2021.

Tools to help meet that demand include the IESO’s demand-response auction, which provides a transparent
and cost-effective way to select the most competitive providers of demand response, while ensuring that all
providers are held to the same performance obligations. The December 2019 demand-response auction
secured capacity to help ensure the reliability of the system during the first 18 months of this Outlook, for
summer 2020 (858.7 MW) and winter 2020/21 (919.3 MW).

As for energy adequacy, Ontario is expected to have sufficient supply to meet its energy forecast throughout
2020 for the firm scenario with normal weather, without needing to rely on imports. A small energy need may
arise in June 2021 and require the rescheduling of some planned outages to meet capacity adequacy
requirements, which should also help to ensure energy adequacy.

Careful transmission coordination

Ontario’s transmission system is expected to continue to reliably supply province-wide demand, while
experiencing normal contingencies defined by planning criteria for the next 18 months. However, some
combinations of transmission and/or generation outages can create operating challenges.

For example, careful coordination of transmission and generation outages will be required though the second
quarter of 2021, as Hydro One continues to replace aging infrastructure at the Bruce 230 kilovolt (kV)
switchyard. The flow out of Bruce may be impacted from February to November 2020, and a planned two-
week outage starting April 20, 2020 will reduce transfer capability into the West zone.

Significant growth in the greenhouse sector may lead to challenges in the Southwest zone, as new load
connections are made and required transmission reinforcements are being implemented. The IESO is using
proactive strategies to meet the anticipated need including an LED incentive for greenhouses in Windsor-
Essex and Chatham-Kent, and the IESO’s Grid Innovation Fund, which is providing $2.5 million in funding to
projects focused on reducing electricity demand from indoor agriculture facilities during local and bulk system
peak periods.

Operational challenges due to high voltages in eastern Ontario and the Greater Toronto Area will continue to
occur during low-demand periods.

Beyond 18 months: July 2021 to December 2024

Thanks, in part, to the province’s diverse supply mix, Ontario is in a strong position with sufficient resources
to meet its needs under most circumstances, provided the majority of existing resources remain available over
the 42-month horizon.

Independent Electricity System Operator | Public                                                                   3
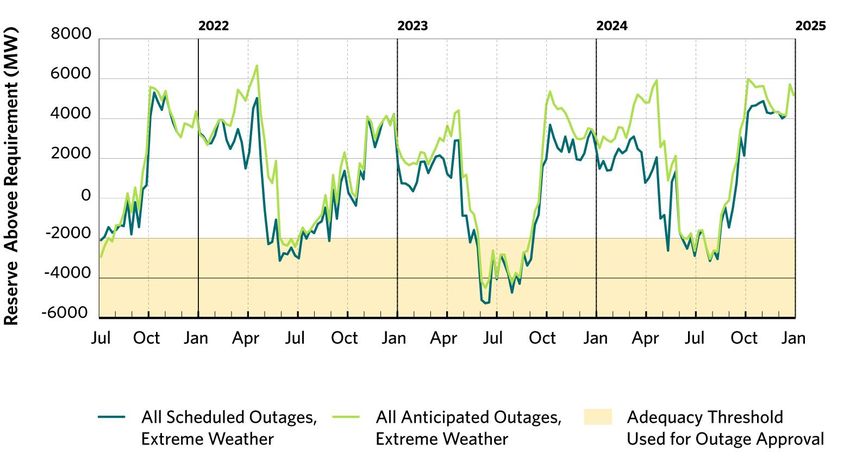
Based on the longer-term outage plans submitted by generation and transmission owners, the five-year
outlook takes into account nuclear retirements and refurbishments, and facilities reaching the end of their
contract terms, considering potential delays in generation projects and the extreme weather scenario.

Uncertainties in electricity forecasting are compounded by time. For planning purposes, the scenarios
modelled over the five-year horizon could vary depending on economic and demographic conditions,
achievement of energy-efficiency programs, penetration of distributed energy resources, weather conditions,
timing and completion of transmission and resource projects, as well as the scheduling of planned and forced
outages.

Periods of increased reliability risk could emerge in the summers of 2022, 2023 and 2024, with the greatest
risk in the summer of 2023, when nuclear refurbishment activity peaks and reserves fall below the adequacy
threshold. Planning assessments for the months of May and June 2023 show up to seven planned nuclear
outages. Market participants should attempt to avoid outages during this period and be prepared for the
possibility that outages will be rejected. Going forward, capacity auctions will be an important mechanism for
efficiently and competitively acquiring resources to meet Ontario’s capacity needs. In June 2020, the IESO is
launching its first capacity auction – an evolution of the demand-response auction that will be open to
dispatchable generators coming off contract, storage and system-backed imports.

As potential negative reserves during these summers exceed the amount of potential imports that the IESO
may rely upon for resource adequacy, all non-critical or short-duration outages should be rescheduled into
late fall, winter or early spring. Generally, generators are advised to avoid scheduling outages in the summers
throughout the Outlook period, and even beyond.

Also, the transfer capability of the Flow East Toward Toronto (FETT) interface could be reduced significantly
with one or more key transmission elements out of service, particularly when Pickering or Darlington units are
out of service.

Keeping ahead of emerging reliability issues

The information in this Reliability Outlook lend transparency to the IESO’s planning process, using the latest
information to paint the clearest possible picture of upcoming trends, issues and concerns that, in potentially
affecting system reliability, will require ongoing monitoring and careful coordination of outages.

The IESO recognizes that continued system reliability depends on the contributions of all stakeholders.
Engagement is integral to IESO planning processes, ensuring potential reliability concerns are on the radar
and mitigating them long before they grow into issues.

Next year, in addition to introducing a capacity auction that will enable new resource types to compete to
meet system needs, the IESO is launching a resource adequacy engagement that will explore a suite of
procurement tools to ensure Ontario is well positioned to meet current – and future – capacity requirements.

Independent Electricity System Operator | Public                                                                  4
Contents

Executive Summary                                                                                1
1. Introduction                                                                                  8
2. Updates to this Outlook                                                                       9
          Updates to Demand Forecast                                                             9
          Updates to Resources                                                                   9
          Updates to Transmission Outlook                                                        9
          Updates to Operability Outlook                                                         9
3. Demand Forecast for 18-Month Period                                                          10
          Actual Weather and Demand                                                             12
          Forecast Drivers                                                                      16
                 Economic Outlook                                                               16
                 Weather Scenarios                                                              16
                 Demand Measures and Load Modifiers                                             16
4. Resource Adequacy for 18-Month Period                                                        17
          Assessment Assumptions                                                                18
                 Generation Resources                                                           18
                 Generation Capability                                                          19
                 Demand Measures                                                                21
                 Firm Transactions                                                              21
                 Summary of Scenario Assumptions                                                21
          Capacity Adequacy Assessment                                                          22
                 Firm Scenario with Normal and Extreme Weather                                  22
                 Planned Scenario with Normal and Extreme Weather                               23
              Comparison of the Current and Previous Weekly Adequacy Assessments for the Firm
          Normal Weather Scenario                                                               24
          Energy Adequacy Assessment                                                            25
                 Summary of Energy Adequacy Assumptions                                         25
                 Results – Firm Scenario with Normal Weather                                    25
                 Findings and Conclusions                                                       26
5. Transmission Reliability Assessment                                                          29
          Transmission Projects                                                                 29
          Transmission Outages                                                                  29
          Transmission Considerations                                                           29
6. Operability                                                                                  32
          Regulation Needs                                                                      32

Independent Electricity System Operator | Public                                                     5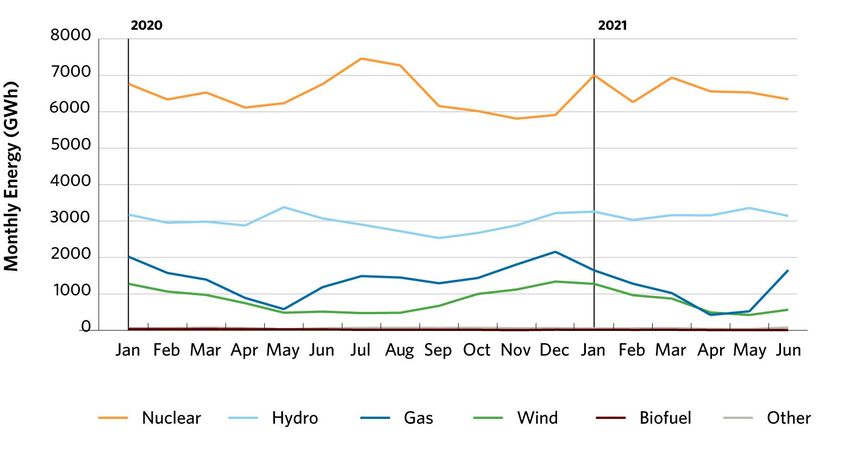
Seasonal Readiness                                                                        32
          Outage Management Concerns                                                                32
          Grid Voltage Control                                                                      32
          Surplus Baseload Generation                                                               33
7. Beyond 18 Months                                                                                 36
          Introduction                                                                              36
                 Interpretation                                                                     36
          Key Findings                                                                              37
          Capacity Adequacy Assessment                                                              37
                 Summary of Scenarios Considered                                                    38
                 Capacity Adequacy Findings                                                         39
          Inputs and Assumptions                                                                    40
                 Demand                                                                             42
                 Changes to installed generation                                                    44
                 Firm Transactions                                                                  45
          Transmission Outlook                                                                      45
                 Outage Impacts                                                                     45
                 Transmission Projects                                                              46
8. Resources Referenced in This Report                                                              47
9. List of Acronyms                                                                                 48

List of Figures
Figure 4-1 | Monthly Wind Capacity Contribution Values                                                20
Figure 4-2 | Monthly Solar Capacity Contribution Values                                               20
Figure 4-3 | Comparison of Normal and Extreme Weather: Firm Scenario Reserve Above Requirement        23
Figure 4-4 | Comparison of Normal and Extreme Weather: Planned Scenario Reserve Above Requirement     24
Figure 4-5 | Comparison of Current and Previous Outlook: Firm Scenario Extreme Weather Reserve Above
Requirement                                                                                          25
Figure 4-6 | Forecast Energy Production by Fuel Type                                                  27
Figure 4-7 | Forecast Monthly Energy Production by Fuel Type                                          27
Figure 6-1 | MWh Curtailments versus Ontario Demand                                                   33
Figure 6-2 | Minimum Ontario Demand and Baseload Generation                                           34
Figure 6-3 | Minimum Ontario Demand and Baseload Generation                                           35
Figure 6-4 | Monthly Off-Peak Wind Capacity Contribution Values                                       35
Figure 7-1 | Reserve Above Requirement for All Anticipated Outages and All Scheduled Outages Scenarios 40

Independent Electricity System Operator | Public                                                         6
List of Tables
Table 3-1 | Historical and Forecast Energy Summary                                         11
Table 3-2 | Forecasted Seasonal Peaks                                                      11
Table 4-1 | Existing Grid-Connected Resource Capacity                                      17
Table 4-2 | Committed Generation Resources Status                                          18
Table 4-3 | Monthly Historical Hydroelectric Median Values for Normal Weather Conditions   19
Table 4-4 | Summary of Available Resources under Normal Weather                            22
Table 4-5 | Summary of Zonal Energy for Firm Scenario Normal Weather                       26
Table 4-6 | Ontario Energy Production by Fuel Type for the Firm Scenario Normal Weather    28
Table 7-1 | Notable Issues or Findings                                                     37
Table 7-2 | Summary of Scenarios                                                           38
Table 7-3 | Summary of Available Resources (MW) at Summer Peak                             39
Table 7-4 | Methodological Differences from the 18-Month Horizon                           41
Table 7-5 | Summary of Forecasted Peaks and Energy                                         42
Table 7-6 | Monthly Energy and Peak Demand Forecast                                        43
Table 7-7 | Committed Generation Resources Status                                          44
Table 7-8 | Generation Facilities with Contracts Expiring during this Outlook Period       45
Table 8-1 | Additional Resources                                                           47

Copyright © 2019 Independent Electricity System Operator. All rights reserved.

Independent Electricity System Operator | Public                                            7
1. Introduction
This Outlook covers 60 months in two distinct periods: the 18 months from January 2020 to June 2021, which
supersedes the Outlook released on September 19, 2019 and is presented in chapters 3 through 6, and the
42-month period from July 2021 to December 2024, presented in chapter 7.
The purpose of the 18-month horizon in the Reliability Outlook is to:
Advise market participants of the resource and transmission reliability of the Ontario electricity system
Assess potentially adverse conditions that might be avoided by adjusting or coordinating maintenance
plans for generation and transmission equipment
Report on initiatives being implemented to improve reliability within this time frame
The 42-month period presented in chapter 7 is intended to support generation and transmission owners with
scheduling and approval of larger and more complex outages, requiring longer lead times, and to inform
changes in resource adequacy beyond 18 months that may make coordinating outages and assessments
more challenging in the future.
This Outlook assesses resource and transmission adequacy based on the stated assumptions, following the
Methodology to Perform the Reliability Outlook. Due to uncertainties associated with various assumptions,
readers are encouraged to use their judgment in considering possible future scenarios.
Additional supporting documents are located on the IESO website.
Security and adequacy assessments are published on the IESO website on a daily basis and progressively
supersede information presented in this report.
For questions or comments on this Outlook, please contact us at 905-403-6900 (toll-free 1-888-448-7777) or
customer.relations@ieso.ca.
Independent Electricity System Operator | Public 8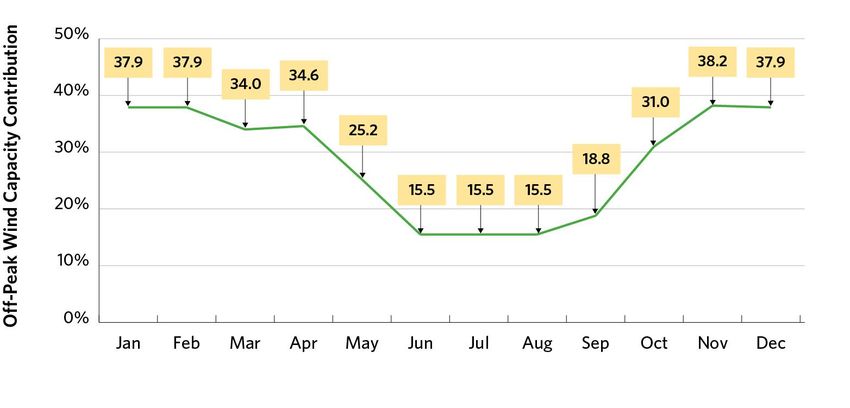
2. Updates to this Outlook
        Updates to Demand Forecast

The demand forecast is based on actual demand, weather and economic data through to the end of
September 2019. The demand forecast has been updated to reflect the most recent economic projections.
Actual weather and demand data for September, October and November 2019 have been included in the
tables.

        Updates to Resources

This Reliability Outlook considers planned generator outages over the 60-month period, submitted by market
participants to the IESO’s outage management system as of November 25, 2019. Market participants are
required annually to submit information to enable the IESO to conduct reliability assessments. This
information, provided to the IESO through Form 1230, was submitted by April 1, 2019.

        Updates to Transmission Outlook

Transmission outage plans that were submitted to the IESO’s outage management system by October 28,
2019, are considered in this Outlook.

        Updates to Operability Outlook

The outlook for surplus baseload generation (SBG) conditions over the next 18 months is based on generator
outage plans submitted by market participants to the IESO’s outage management system as of November 25,
2019.

Independent Electricity System Operator | Public                                                             9
3. Demand Forecast for 18-Month Period
Beginning in 2020, energy demand is expected to increase due to economic expansion and population
growth. Peak demand, which has been facing downward pressure from energy-efficiency programs,
growing embedded generation output and the ICI, is expected to increase slightly over the forecast
period.
The IESO is responsible for forecasting electricity demand on the IESO-controlled grid. This demand forecast
covers the period January 2020 to June 2021 and supersedes the previous forecast released in September
2019. Tables of supporting information are contained in the 2019 Q4 Outlook Tables spreadsheet.
Electricity demand is shaped by a number of factors that can:
Increase the demand for electricity, e.g., population growth, economic expansion and the increased
penetration of end-uses
Reduce the need for grid-supplied electricity, e.g., conservation and embedded generation
Shift demand, e.g., time-of-use rates and the Industrial Conservation Initiative (ICI)
How each of these factors impacts electricity consumption varies by season and time of day – and is reflected
in the demand forecast.
Grid-supplied energy demand has been fairly flat since the 2009 recession with small increases and decreases
year to year. The Outlook projects increasing electricity demand over the forecast horizon, thanks to the
combined impact of economic expansion and demographic growth. A strong U.S. economy and a low dollar
will continue to foster demand growth in the industrial sector. Embedded generation capacity has stopped
growing and energy-efficiency conservation savings are forecast until the end of 2020, eliminating the
downward pressure on electricity demand.
Peak demands are subject to the same forces as energy demand, though the impacts vary. This is true when
comparing energy demand to peak demand, and the summer to winter peaks. Recent history has seen lower
summer peaks, significantly impacted by the growth in embedded-generation capacity and the ICI. The
majority of embedded generation is provided by solar-powered facilities that generate high output during the
traditional summer peak-hour period and limited to no output during the winter peak-hour periods. In
addition to reducing summer peaks, higher embedded solar output has also pushed the peak later in the day.
As before, with the amount of embedded solar capacity plateauing and no energy-efficiency savings forecast
beyond 2020, peaks will show a reversal from recent years and increase over the forecast period.
The following tables show seasonal peaks and annual energy demand over the forecast horizon of the
Outlook.
Independent Electricity System Operator | Public 10Table 3-1 | Historical and Forecast Energy Summary Year Normal Weather Energy (TWh) % Growth in Energy 2006 152.3 -1.86% 2007 151.6 -0.49% 2008 148.9 -1.77% 2009 140.4 -5.72% 2010 142.1 1.23% 2011 141.2 -0.63% 2012 141.3 0.08% 2013 140.5 -0.63% 2014 138.9 -1.14% 2015 136.2 -1.94% 2016 136.2 0.01% 2017 132.3 -2.84% 2018 135.2 2.15% 2019 (Forecast) 134.1 -0.80% 2020 (Forecast) 136.4 1.74% Table 3-2 | Forecasted Seasonal Peaks Season Normal Weather Peak (MW) Extreme Weather Peak (MW) Winter 2019-20 21,185 22,353 Summer 2020 22,194 24,555 Winter 2020-21 21,239 22,533 Independent Electricity System Operator | Public 11
Actual Weather and Demand
Since the last forecast, actual demand and weather data for September, October and November have been
recorded.
September:
September experienced near normal weather during both the average and peak demand temperatures.
The monthly peak occurred on Wednesday, September 11, the second hottest day of the month. The
afternoon high was 28.6 C (at Toronto), the mildest September peak since 2012. The peak was 19,717
MW (19,244 MW weather corrected). A warmer spell during the month didn’t deliver a monthly peak as it
took place over a weekend.
Energy demand for the month was 10.3 TWh (10.3 TWh weather-corrected), which is the lowest
September actual since market opening.
The minimum demand for the month was 10,477 MW and occurred in the early hours of September 29.
This is the lowest September minimum since market opening.
Embedded generation production for the month was 484 GWh, virtually the same as that recorded in
September 2018.
Wholesale customers’ consumption dropped 5.9% compared to September 2018, representing the largest
monthly decline since September 2017. Declines in mining (-5.3%), pulp and paper (-16.3%) and petrol-
chemicals (-27.3%) more than offset gains in the chemicals (14.6%) and iron and steel (5.2%) sectors.
October:
While not warm, the weather for October was milder than typically expected.
The peak for October occurred on the first of the month when daytime highs reached 31.2 C (Toronto).
Peak demand reached 18,329 MW (18,652 MW weather-corrected), the highest for October since 2013.
Energy demand for the month was 10.3 TWh (10.6 TWh weather-corrected), low by historical standards,
due to mild weather for the month.
Minimum demand in October was 10,739 MW, occurred during the early hours of Sunday, October 6, the
second warmest day of the month. The warmer weather led to the dip in demand as October is typically a
month that requires heating.
Embedded generation production for the month was 506 GWh, a 3.8% increase over the previous year.
Higher embedded hydro and wind output accounted for the growth, as solar output was down
significantly (-22.0%).
Independent Electricity System Operator | Public 12 Wholesale customers’ demand fell by 4.4% compared to the previous October, resulting from declines in
pulp and paper, petrochemicals and iron and steel, which offset growth in mining and basic chemicals.
November
The weather for November was colder than normal. The average temperatures for the month rank it as
one of the coldest Novembers in the past 50 years.
November’s peak demand occurred on November 13, the second coldest day of the month. The peak was
19,625 MW (19,001 MW weather-corrected) and was slightly lower than last November’s peak – which
occurred on a significantly colder day.
Energy demand for the month was 11.3 TWh (10.9 TWh weather-corrected) which was very similar to the
month’s experience since 2014.
Minimum demand for the month was 11,711 MW, which is also consistent with the experience of recent
years. The minimum occurred in the early hours of Sunday, November 3 when temperatures were mild.
Embedded generation production for the month was 453 GWh, a 6.8% increase compared to the previous
November. Wind (4.2%) and hydro (34.2%) output were up significantly, offsetting a very large decline
in solar output (-37.7%).
Wholesale customers’ consumption continued the negative trend that began in July. Year-over-year
consumption decreased by 4.8% with mining (-0.2%) and chemicals (3.9%) as the strongest sectors and
refining showing the greatest decline (-20.3%).
Overall, energy demand for the fall months of September, October and November was down 3.9% compared
with the previous fall. After adjusting for the weather, demand for the three months showed a smaller
decrease of 1.3%.
Embedded generation for the three months was up 3.5% over the same time a year ago. The increase was
driven by higher output by wind (24.3%) and hydro (21.5%).
For the three months, wholesale customers’ consumption posted a 5.0% decrease over the same months a
year prior with all major sectors showing declines, except for chemicals which posted a 10.7% increase.
The 2019 Q4 Outlook Tables spreadsheet contains several tables with historical data. They are:
Table 3.3.1 Weekly Weather and Demand History Since Market Opening
Table 3.3.2 Monthly Weather and Demand History Since Market Opening
Table 3.3.3 Monthly Demand Data by Market Participant Role
Independent Electricity System Operator | Public 13Table 3-3 | Weekly Energy and Peak Demand Forecast
Normal Peak Extreme Peak Load Forecast Normal Energy
Week Ending (MW) (MW) Uncertainty (MW) Demand (GWh)
05-Jan-20 19,918 20,913 570 2,766
12-Jan-20 21,185 22,353 547 2,923
19-Jan-20 20,757 21,385 483 2,899
26-Jan-20 20,618 21,568 404 2,899
02-Feb-20 20,637 21,718 734 2,915
09-Feb-20 19,917 21,508 635 2,851
16-Feb-20 19,555 20,902 581 2,783
23-Feb-20 19,310 20,967 501 2,750
01-Mar-20 19,830 21,014 531 2,794
08-Mar-20 19,377 20,150 649 2,726
15-Mar-20 18,274 18,933 611 2,637
22-Mar-20 17,606 18,507 569 2,530
29-Mar-20 17,592 18,560 567 2,538
05-Apr-20 17,323 17,873 471 2,496
12-Apr-20 16,671 17,541 496 2,385
19-Apr-20 16,044 16,204 531 2,367
26-Apr-20 16,236 16,767 721 2,362
03-May-20 17,268 19,567 849 2,344
10-May-20 16,551 19,296 845 2,349
17-May-20 18,057 21,149 1,175 2,370
24-May-20 17,705 21,392 1,330 2,322
31-May-20 18,533 20,855 1,292 2,385
07-Jun-20 19,261 23,379 1,055 2,559
14-Jun-20 20,335 23,772 835 2,576
21-Jun-20 21,401 23,839 754 2,639
28-Jun-20 21,530 23,846 1,016 2,695
05-Jul-20 20,535 23,291 814 2,655
12-Jul-20 22,194 24,555 838 2,759
19-Jul-20 20,743 24,051 1,035 2,629
26-Jul-20 21,290 24,252 841 2,720
02-Aug-20 21,944 24,100 958 2,717
09-Aug-20 21,289 23,693 985 2,683
16-Aug-20 20,532 23,504 1,362 2,665
23-Aug-20 21,375 23,147 1,413 2,711
30-Aug-20 19,979 22,399 1,370 2,560
06-Sep-20 18,388 23,201 680 2,451
13-Sep-20 18,845 20,551 781 2,427
20-Sep-20 17,616 19,795 420 2,432
Independent Electricity System Operator | Public 14Normal Peak Extreme Peak Load Forecast Normal Energy Week Ending (MW) (MW) Uncertainty (MW) Demand (GWh) 27-Sep-20 16,847 18,117 554 2,371 04-Oct-20 17,175 17,204 786 2,417 11-Oct-20 16,806 16,863 507 2,434 18-Oct-20 17,107 17,518 392 2,395 25-Oct-20 17,286 17,783 318 2,477 01-Nov-20 17,545 18,172 416 2,505 08-Nov-20 18,538 18,858 601 2,586 15-Nov-20 18,683 19,396 342 2,606 22-Nov-20 19,233 19,915 607 2,678 29-Nov-20 19,646 21,100 409 2,740 06-Dec-20 19,949 20,956 555 2,767 13-Dec-20 20,341 21,304 690 2,809 20-Dec-20 20,059 21,135 362 2,796 27-Dec-20 18,804 20,651 528 2,753 03-Jan-21 20,243 21,138 528 2,742 10-Jan-21 21,239 22,533 570 2,949 17-Jan-21 20,902 21,827 547 2,921 24-Jan-21 20,760 21,910 483 2,921 31-Jan-21 20,779 22,061 404 2,945 07-Feb-21 20,256 21,644 734 2,872 14-Feb-21 19,890 21,240 635 2,804 21-Feb-21 19,649 21,306 581 2,771 28-Feb-21 20,182 21,367 501 2,823 07-Mar-21 19,742 20,314 531 2,755 14-Mar-21 19,082 19,541 649 2,686 21-Mar-21 17,939 18,636 611 2,562 28-Mar-21 17,926 18,695 569 2,559 04-Apr-21 17,953 18,283 567 2,486 11-Apr-21 17,023 17,894 471 2,437 18-Apr-21 16,559 16,653 496 2,399 25-Apr-21 16,581 16,909 531 2,384 02-May-21 17,613 19,913 721 2,368 09-May-21 16,692 19,640 849 2,371 16-May-21 18,198 21,491 845 2,397 23-May-21 17,845 21,733 1,175 2,396 30-May-21 18,681 21,199 1,330 2,354 06-Jun-21 19,408 23,623 1,292 2,571 13-Jun-21 20,485 23,920 1,055 2,598 20-Jun-21 21,537 23,878 835 2,661 Independent Electricity System Operator | Public 15
Normal Peak     Extreme Peak          Load Forecast         Normal Energy
Week Ending                                 (MW)             (MW)        Uncertainty (MW)        Demand (GWh)

27-Jun-21                                  21,981          23,995                    754                 2,717

04-Jul-21                                  21,922          24,568                  1,016                 2,678

       Forecast Drivers

            Economic Outlook
The economic fundamentals are relatively positive for the Ontario economy. A strong U.S. economy, a low
Canadian dollar and low interest rates are conducive to growth in Ontario’s export-oriented, energy-intensive
manufacturing sector. That said, significant downside risk to the economy remains over the forecast horizon,
with trade tensions, climate impacts and global political uncertainty increasing the risk of disruption to the
world economic situation. If these risks do not materialize, Ontario should see increasing economic output
over the forecast.

Table 3.3.4 of the 2019 Q4 Outlook Tables presents the economic assumptions for the demand forecast.

            Weather Scenarios
The IESO uses weather scenarios to produce demand forecasts. These scenarios include normal and extreme
weather, along with a measure of uncertainty in demand due to weather volatility. This measure is called
Load Forecast Uncertainty.

Table 3.3.5 of the 2019 Q4 Outlook Tables presents the weekly weather data for the forecast period.

            Demand Measures and Load Modifiers
Both demand measures and load modifiers can impact demand but they differ in how they are treated within
the Outlook. Demand measures are not incorporated into the demand forecast and are instead treated as
resources. Load modifiers are incorporated into the demand forecast.

As demand measures are dispatched like generation resources, they are included in the supply mix, and
added back into the history when forecasting demand. Therefore, the impacts of demand measures are not
included in the demand forecast.

Load modifiers include conservation (energy-efficiency programs, codes and standards and fuel switching),
price impacts (time-of-use rates and the ICI), and embedded generation. Each affects demand differently in
terms of level and timing, but together these load modifiers have the net effect of reducing the demand for
grid-supplied electricity. Conservation affects the height of peaks and the energy consumed, prices reduce
demand during peak periods, and the impacts of embedded generation vary by fuel type.

Independent Electricity System Operator | Public                                                                  16
4. Resource Adequacy for 18-Month Period
The IESO expects to have sufficient generation supply for winter 2020, as well as winter 2020/2021.
Potential risks in summer 2020 and the early part of summer 2021 are expected to be mitigated by
outage rescheduling. Over the next 18 months, 1,500 MW of new generation are planned to come into
service, while approximately 38 MW of generation will reach the end of its contract life.
This section assesses the adequacy of resources to meet the forecast demand. Resource adequacy is one of
the reliability considerations used for approving outages. When reserves are below required levels, with
potentially adverse effects on the reliability of the grid, the IESO will reject outage requests based on their
order of precedence. Conversely, when reserves are above required levels, additional outages can be
contemplated, provided other factors – such as local considerations, operability or transmission security – do
not pose a reliability concern. In those cases, the IESO may place an outage at risk, signaling to the facility
owner to consider rescheduling the outage.
The existing installed generation capacity is summarized in Table 4-1. This includes capacity from new
projects that have completed the IESO’s market registration process since the previous Outlook. The forecast
capability at the Outlook peak is based on the firm resource scenario, which includes resources currently
under commercial operation, and takes into account deratings, planned outages and allowance for capability
levels below rated installed capacity.
Table 4-1 | Existing Grid-Connected Resource Capacity
Forecast Capability Forecast Capability
Total Installed at Outlook Peak at Outlook Peak Number Change in Number Change in Installed
Fuel Type Capacity (MW) Normal Weather (MW) [Extreme] (MW) of Stations of Stations Capacity
Nuclear 13,009 11,258 11,258 5 0 0
Hydroelectric 9,065 4,828 4,212 76 0 0
Gas/Oil 10,277 8,439 8,023 31 0 0
Wind 4,486 611 611 39 0 0
Biofuel 295 254 254 7 0 0
Solar 424 58 58 9 0 0
Demand Measures - 554 554 - - -
Firm Imports (+) / - 0 0 - - -
Exports (-) (MW)
Total 37,555 26,004 24,972 167 0 0
Independent Electricity System Operator | Public 17Assessment Assumptions
Generation Resources
All generation resources scheduled to come into service, or to be upgraded or shut down within the Outlook
period are summarized in Table 4-2. This includes generation projects in the IESO’s connection assessment
and approval process (CAA), those under construction, and contracted resources. Details regarding the IESO’s
CAA process and the status of these projects can be found on the Application Status section of the IESO
website.
The estimated effective date column in Table 4-2 indicates when the market registration process is expected
to be complete for each generation resource, based on information available to the IESO as of November 25,
2019. Two scenarios are used to describe project risks:
The planned scenario assumes that all resources scheduled to come into service are available over
the assessment period.
The firm scenario assumes resources are restricted to those that have reached commercial
operation status.
Planned shutdowns or retirements of generators that have a high certainty of occurring are considered for
both scenarios.
Table 4-2 | Committed Generation Resources Status
Capacity Considered
Estimated Firm Planned
Project Name Zone Fuel Type Effective Date Project Status (MW) (MW)
Loyalist Solar East Solar 2019-Q4 Commissioning 0 54
Henvey Inlet Wind Farm Essa Wind 2020-Q1 Commissioning 0 300
Napanee Generating Station East Gas 2020-Q1 Commissioning 0 985
Nation Rise1 East Wind 2020-Q1 Under Development 0 100
Romney Wind Energy Centre West Wind 2020-Q1 Under Development 0 60
Calstock Northeast Biofuel 2020-Q2 Expiring Contract -38 -38
Total -38 1,461
Notes on Table 4-2:
The total may not add up due to rounding and does not include in-service facilities. Project status provides an indication of the
project progress, using the following terminology:
• Under Development – projects in approvals and permitting stages (e.g., environmental assessment, municipal approvals, IESO
connection assessment approvals) and projects under construction.
• Commissioning – projects undergoing commissioning tests with the IESO.
• Commercial Operation – projects that have achieved commercial operation status under the contract criteria, but have not met
all of the IESO’s market registration requirements.
1
The Renewable Energy Approval (REA) for this project was recently revoked and the IESO will continue to monitor
developments on the status of the project.
Independent Electricity System Operator | Public 18• Expiring Contract – contracts that will expire during the Outlook period are included in both scenarios only up to their contract
expiry date. Generators (including non-utility generators) that continue to provide forecast output data are also included in the
planned scenario for the rest of the 18-month period.
Generation Capability
Hydroelectric
A monthly forecast of hydroelectric generation output is calculated based on median historical values of
hydroelectric production and contribution to operating reserve during weekday peak demand hours. Through
this method, routine maintenance and actual forced outages of the generating units are implicitly accounted
for in the historical data (see the first row in Table 4-3). To reflect the impact of hydroelectric outages on the
reserve above requirement (RAR) and allow the assessment of hydroelectric outages as per the outage
approval criteria, the hydroelectric capability is also calculated, without accounting for historical outages (see
the second row of Table 4-3). Table 4-3 uses data from May 2002 to March 2019, which are updated annually
to coincide with the release of the Q2 Outlook.
Table 4-3 | Monthly Historical Hydroelectric Median Values for Normal Weather Conditions
Month Jan Feb Mar Apr May Jun Jul Aug Sep Oct Nov Dec
Historical
Hydroelectric
Median 6,338 6,276 6,102 6,035 6,139 5,958 5,876 5,522 5,273 5,643 5,882 6,336
Contribution
(MW)
Historical
Hydroelectric
Median
Contribution 6,851 6,846 6,609 6,555 6,594 6,465 6,270 6,047 6,104 6,449 6,616 6,846
without
Outages
(MW)
Thermal Generators
Thermal generators’ capacity, planned outages and deratings are based on market participant submissions.
Forced outage rates on demand are calculated by the IESO based on actual operations data. The IESO will
continue to rely on market participant-submitted forced outage rates for comparison purposes.
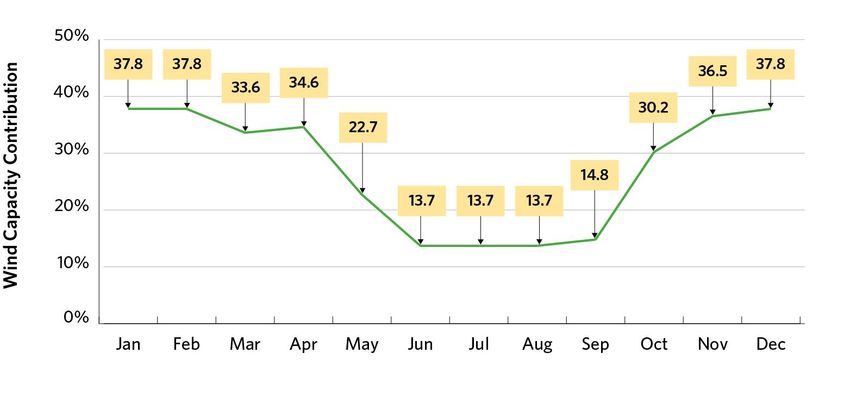
Wind
For wind generation, monthly wind capacity contribution (WCC) values from the weekday peak time are used.
The process for determining wind contribution can be found in the Methodology to Perform the Reliability
Outlook. Figure 4-1 shows the monthly WCC values, which are updated annually with the release of the Q2
Outlook.
Independent Electricity System Operator | Public 19Figure 4-1 | Monthly Wind Capacity Contribution Values
Solar
For solar generation, monthly solar capacity contribution (SCC) values are used from the weekday peak time.
Information on how the solar contribution is calculated can be found in the Methodology to Perform the
Reliability Outlook. Figure 4-2 shows the monthly SCC values, which are updated annually for the release of
the Q2 Outlook.
The grid demand profile has been changing, due to the increasing penetration of embedded solar generation,
which is pushing summer peaks to later in the day. As a result, the contribution from grid-connected solar
resources has declined at the time of peak Ontario demand.
Figure 4-2 | Monthly Solar Capacity Contribution Values
Independent Electricity System Operator | Public 20Demand Measures
Both demand measures and load modifiers can impact demand, but differ in how they are treated within the
Outlook. Demand measures, such as dispatchable loads and demand response procured through an annual
demand-response auction, are not incorporated into the demand forecast and are instead treated as
resources. Load modifiers are incorporated into the demand forecast, as explained in 3.2.3 (Demand
Measures and Load Modifiers). The impacts of activated demand measures are added back into the demand
history prior to forecasting demand for future periods.
Firm Transactions
Capacity-Backed Export
The IESO allows Ontario resources to compete in the capacity auctions held by certain neighbouring
jurisdictions, only if Ontario is adequately supplied. Capacity-backed exports of up to 128 MW installed
capacity were successful in the New York Independent System Operator (NYISO) auctions for delivery
between November 2019 and April 2020.
System-Backed Export
As part of the electricity trade agreement between Ontario and Quebec, Ontario will supply 500 MW of
capacity to Quebec each winter from December to March until 2023. In addition, Ontario will receive up to
2.3 TWh of clean energy annually scheduled economically via Ontario’s real-time markets. The imported
energy will target peak hours to help reduce greenhouse gas emissions in Ontario. The agreement includes
the opportunity to cycle energy.
As part of this capacity exchange agreement, Ontario can call on 500 MW of capacity during summer before
September 2030, based on the province’s needs.
Summary of Scenario Assumptions
To assess future resource adequacy, the IESO must make assumptions about the amount of available
resources. The Outlook considers two scenarios: a firm scenario and a planned scenario.
The starting point for both scenarios is the existing installed resources shown in Table 4-1. The planned
scenario assumes that all resources scheduled to come into service are available over the assessment period.
The firm scenario assumes resources are restricted to those that have reached commercial operation status.
Generator-planned shutdowns or retirements that have a high certainty of occurring are considered for both
scenarios. They also both reflect planned outages submitted by generators. Table 4-4 shows the available
resources that are forecast for the 18 months, under the two scenarios in normal weather conditions, at the
time of the summer and winter peak demands during the Outlook.
Independent Electricity System Operator | Public 21Table 4-4 | Summary of Available Resources under Normal Weather
Winter Peak 2020 Summer Peak 2020 Winter Peak 2021
Firm Planned Firm Planned Firm Planned
Notes Description
Scenario Scenario Scenario Scenario Scenario Scenario
1 Installed Resources (MW) 37,555 37,609 37,555 39,054 37,555 39,054
2 Total Reductions in Resources (MW) 12,678 12,732 12,142 12,652 10,380 10,737
3 Demand Measures (MW) 770 770 554 554 770 770
4 Firm Imports (+) / Exports (-) (MW) -629 -629 0 0 -500 -500
5 Available Resources (MW) 25,018 25,018 25,967 26,956 27,445 28,587
6 Bottling (MW) 2,032 2,032 37 37 420 420
7 Available Resources without Bottling (MW) 27,050 27,050 26,004 26,993 27,865 29,007
Notes on Table 4-4:
1. Installed Resources: The total generation capacity assumed to be installed at the time of the summer and winter peaks.
2. Total Reductions in Resources: The sum of deratings, planned outages, limitations due to transmission constraints and
allowance for capability levels below rated installed capacity.
3. Demand Measures: The amount of demand expected to be available for reduction at the time of peak.
4. Firm Imports/Exports: The amount of expected firm imports and exports at the time of summer and winter peaks.
5. Available Resources: Installed Resources (line 1) minus Total Reductions in Resources (line 2) plus Demand Measures (line 3)
and Firm Imports/Exports (line 4). This differs from the Forecast Capability at System Peak shown in Table 4-1 due to the
impacts of generation bottling (transmission limitations).
6. Available Resources without Bottling: Available resources after they are reduced due to bottling.
Capacity Adequacy Assessment
The capacity adequacy assessment accounts for zonal transmission constraints resulting from planned
transmission outages assessed as of October 28, 2019. The generation planned outages occurring during this
Outlook period have been assessed as of November 25, 2019.
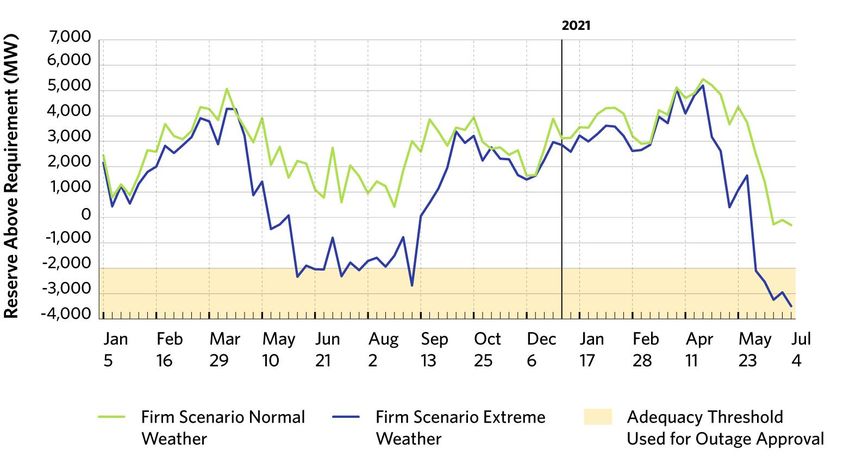
Firm Scenario with Normal and Extreme Weather
The firm scenario incorporates all capacity that had achieved commercial operation status as of November 25,
2019.
Figure 4-3 shows RAR levels, which represent the difference between available resources and required
resources. The latter equals the demand plus required reserve. The reserve requirement in the firm scenario
under normal weather conditions is met throughout the entire Outlook period.
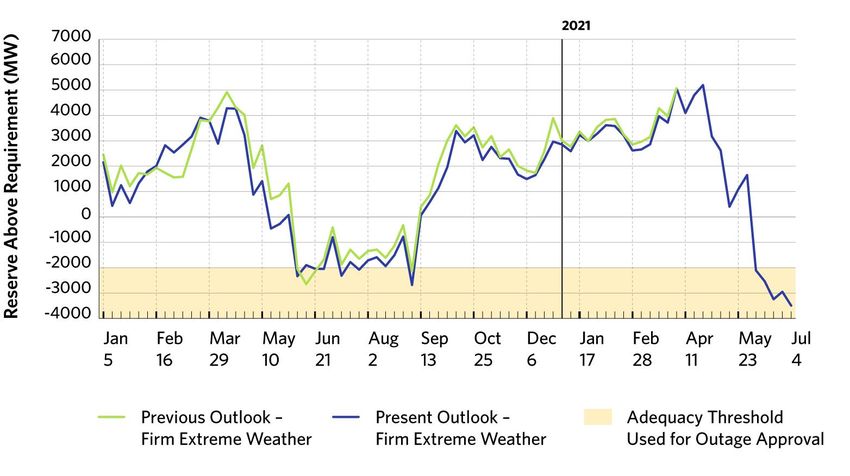
The IESO’s revised outage approval methodology (using the extreme weather scenario with up to 2,000 MW
of imports) has been in effect since May 1, 2019. Under extreme weather conditions, the reserve is lower
than the requirement, without reliance on imports for a total of 16 weeks in 2020 and eight weeks in the first
half of 2021. Under the current outage schedule, the RAR falls below the -2,000 MW threshold for four weeks
Independent Electricity System Operator | Public 22in June 2020, three weeks in July 2020, two weeks in August 2020, and one week in September 2020, as well
as five weeks in June 2021. This potential shortfall is largely attributed to planned generator outages
scheduled during those weeks. If extreme weather conditions materialize, the IESO may reject some
generator maintenance outage requests to ensure that Ontario demand is met during the summer peak
periods.
Figure 4-3 | Comparison of Normal and Extreme Weather: Firm Scenario Reserve Above Requirement
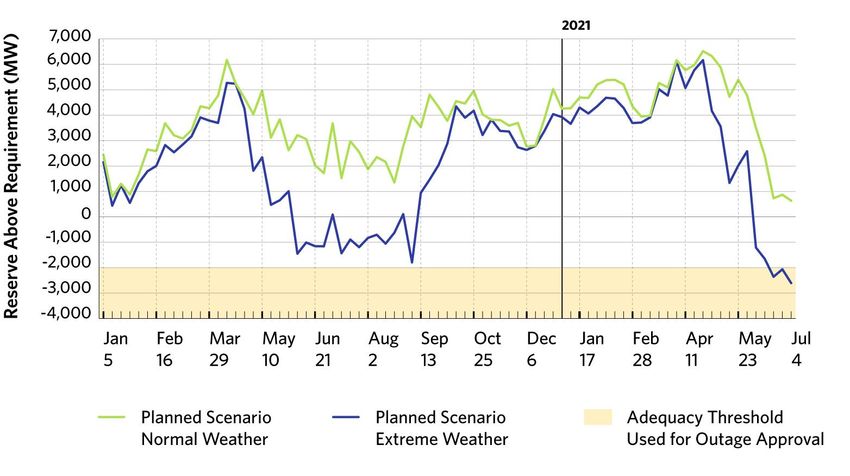
Planned Scenario with Normal and Extreme Weather
The planned scenario incorporates all existing capacity, as well as all capacity coming into service.
Approximately 1,500 MW of generation capacity is expected to connect to Ontario’s grid over this Outlook
period, while 38 MW of generation capacity contracts will expire.
Figure 4-4 shows RAR levels under the planned scenario. As observed, the reserve requirement is being met
throughout the Outlook period under normal weather conditions.
Independent Electricity System Operator | Public 23Figure 4-4 | Comparison of Normal and Extreme Weather: Planned Scenario Reserve Above Requirement
Comparison of the Current and Previous Weekly Adequacy Assessments for the Firm Normal
Weather Scenario
Figure 4-5 compares forecast RAR values in the current Outlook with those in the previous Outlook, which
was published on September 19, 2019. The difference is primarily the result of changes in planned outages
and the expected in-service dates of new resources.
Independent Electricity System Operator | Public 24Figure 4-5 | Comparison of Current and Previous Outlook: Firm Scenario Extreme Weather Reserve Above
Requirement
Resource adequacy assumptions and risks are discussed in detail in the Methodology to Perform the Reliability
Outlook.
Energy Adequacy Assessment
This section assesses energy adequacy to determine whether Ontario has sufficient supply to meet its
forecast energy demands, while highlighting potential adequacy concerns during the Outlook time frame. At
the same time, the assessment estimates the aggregate production by resource category to meet the
projected demand based on assumed resource availability.
Summary of Energy Adequacy Assumptions
The energy adequacy assessment (EAA) uses the same set of assumptions as the capacity assessment, as
outlined in Table 4-1 and Table 4-2, which indicate the total capacity of committed resources and when they
are expected to be available over the next 18 months. The monthly forecast of energy production capability,
based on energy modelling results, is included in the 2019 Q2 Outlook Tables.
For the EAA, only the firm scenario in Table 4-5 with normal weather demand is assessed. The key
assumptions specific to this assessment are described in the Methodology to Perform the Reliability Outlook.
Results – Firm Scenario with Normal Weather
Table 4-5 summarizes the energy simulation results over the next 18 months for the firm scenario with
normal weather demand both for Ontario and for each transmission zone.
Independent Electricity System Operator | Public 25Table 4-5 | Summary of Zonal Energy for Firm Scenario Normal Weather
Zonal Energy Available
Net Demand on Energy on
Inter-Zonal Peak Day Peak Day
Energy of 18-Month of 18-Month
18-Month Energy Demand 18-Month Energy Production Transfer Period Period
Zone TWh Average MW TWh Average MW TWh GWh GWh
Bruce 1.0 79.0 63.2 4,811.0 62.2 1.5 133.3
East 13.7 1,047.0 16.8 1,281.0 3.1 29.4 73.9
Essa 12.4 946.0 4.7 356.0 -7.7 26.0 15.6
Niagara 6.1 466.0 20.8 1,584.0 14.7 14.0 52.1
Northeast 16.0 1,217.0 15.3 1,162.0 -0.7 26.3 33.1
Northwest 6.0 457.0 6.9 524.0 0.9 9.6 16.5
Ottawa 18.6 1,417.0 0.3 24.0 -18.3 37.4 1.4
Southwest 41.6 3,172.0 8.9 682.0 -32.7 90.9 25.2
Toronto 75.1 5,722.0 59.3 4,516.0 -15.8 179.8 152.4
West 20.8 1,585.0 15.3 1,168.0 -5.5 48.5 76.0
Ontario 211.5 16,107.0 211.5 16,107.0 0.0 463.4 579.5
Findings and Conclusions
The EAA results indicate that Ontario is expected to have sufficient supply to meet its energy forecast
throughout 2020 for the firm scenario with normal weather demand, without being expected to rely on
support from external jurisdictions. However, they also indicate the potential for unserved energy in June
2021. Note that the EAA does not consider either new generation resources that are anticipated to be in
service before this time, or the possibility of energy imports. As highlighted in section 4.2, some planned
outages are likely to be shifted during this period to meet capacity adequacy requirements, which should also
help to ensure energy adequacy.
Figure 4-6 forecasts the percentage of Ontario’s energy demand expected to be supplied by each fuel type for
the next 18 months, while Figure 4-7 shows the production by fuel type for each month. Exports out of
Ontario and imports into Ontario are not considered in this assessment. Table 4-6 summarizes these
simulated production results by fuel type, for each year.
Independent Electricity System Operator | Public 26Figure 4-6 | Forecast Energy Production by Fuel Type
Figure 4-7 | Forecast Monthly Energy Production by Fuel Type
Independent Electricity System Operator | Public 27Table 4-6 | Ontario Energy Production by Fuel Type for the Firm Scenario Normal Weather
2020 2021
Total
Fuel Type (Jan 1 - Dec 31) (Jan 1 - June 30)
(GWh)
(Grid Connected) (GWh) (GWh)
Nuclear 77,368 39,639 117,007
Hydro 35,378 19,105 54,482
Gas & Oil 17,279 6,545 23,824
Wind 10,145 4,590 14,735
Bio Fuel 284 70 354
Other (Solar & DR) 734 319 1,052
Total 141,188 70,268 211,455
Independent Electricity System Operator | Public 285. Transmission Reliability Assessment
Ontario’s transmission system is expected to continue to reliably supply province-wide demand, while
experiencing normal contingencies defined by planning criteria for the next 18 months. However, some
combinations of transmission and/or generation outages can create operating challenges.
The IESO assesses transmission adequacy using a methodology based on conformance to established criteria,
including the Ontario Resource and Transmission Assessment Criteria (ORTAC), NERC transmission planning
standard TPL 001-4 and NPCC Directory #1 as applicable. Planned system enhancements and projects, and
known transmission outages are also considered in the studies.
Ontario’s transmission system is expected to continue to reliably supply province-wide demand while
experiencing normal contingencies defined by planning criteria for the next 18 months.
Transmission Projects
This section considers the information transmitters provide with respect to transmission projects that are
planned for completion within the next 18 months. Transmission projects planned for completion beyond this
time frame are considered in section 7.5. The list of transmission projects is provided in Appendix B1.
Transmission Outages
The IESO’s assessment of transmission outage plans is shown in Appendix C, Tables C1 to C11. The
methodology used to assess the transmission outage plans is described in the Methodology to Perform the
Reliability Outlook. This Outlook contains transmission outage plans submitted to the IESO as of October 28,
2019.
Transmission Considerations
The purpose of this section of the report is to highlight projects and outages that may affect the scheduling of
other outages and/or may affect reliability, and categorize these considerations by zone.
Independent Electricity System Operator | Public 29Bruce, Southwest and West Zones Hydro One has begun replacing the aging infrastructure at the Bruce 230 kV switchyard, which requires careful coordination of transmission and generation outages. This project is scheduled to be completed by 2021-Q2. Aging circuit breakers in the Richview 230 kV switchyard are to be replaced in 2020. Hydro One and the IESO will coordinate the outages required to reduce the impact on the FETT transfer capabilities. A series of non-contiguous planned outages will impact the flow out of Bruce from February to November 2020. Planned outages include the following circuits: B601M, B502M, B560V, B561M, N582L, M585M and V586M. A planned two-week outage starting April 20, 2020 will impact circuit B569B, reducing transfer capability into the West zone. Significant growth in the greenhouse sector has led to a number of customer connection requests in the Windsor-Essex region that are expected to exceed the capacity of the existing transmission system in the area. A new switching station at the Leamington Junction is proceeding toward a 2022-Q3 in-service date. Outages may be more challenging to facilitate starting in late 2019, when new load connections are made and required transmission reinforcements are being implemented. Toronto, East and Ottawa Zones Operational challenges due to high voltages in eastern Ontario and the Greater Toronto Area continue to occur during low demand periods. The IESO and Hydro One are currently managing this situation by removing one of the 500 kV circuits in eastern Ontario during those periods. To address this issue on a longer-term basis, two 500 kV line-connected shunt reactors will be installed at Lennox TS with a target in- service date of 2020-Q4 for the first reactor and 2021-Q4 for the second reactor. Northwest, Northeast and Essa Zones In the Kapuskasing area, system reinforcements, including upgrades to circuit H9K and the installation of reactive compensation, are planned for 2020-Q1 and 2021-Q2, respectively. During the construction of these reinforcements, certain outages may be restricted. A number of non-contiguous planned outages, from February 2020 to November 2020, will reduce transfer capability on the North-South Tie. Planned outages include circuits X503E, X504E, and D5H and breakers at Hanmer TS. A two-week outage in September 2020 and a four-week outage in November 2020 will impact transfer capacities between the Essa and Toronto zones. Outages in February and March 2020 will reduce transfer capability into the Northwest zone across the East- West Tie. Significant construction activities for the East West Tie reinforcement project will also occur over the Outlook period, requiring outages to existing transmission facilities in the northwest. Additional information regarding the impacts of this project will be provided in the 2020-Q1 Reliability Outlook. Independent Electricity System Operator | Public 30
Interconnections

The early 2018 failure of the phase angle regulator (PAR) connected to the Ontario-New York 230 kV
interconnection circuit L33P continues to hinder the province’s ability to import electricity from New York
through the New York-St. Lawrence interconnection and from Quebec through the Beauharnois
interconnection. This has required enhanced coordination with affected parties and more focused
management of St. Lawrence area resources in real-time. Careful coordination of transmission and generation
outages will continue to be required in the area. PARs are unique pieces of equipment and replacements are
not readily available. Replacement options for the unit are being investigated jointly with the IESO, Hydro
One, NYISO and the New York Power Authority. The preferred replacement option is a new PAR with a +/-
50-degree angle range, based on the recommendation by the joint New York/Ontario team to Hydro One for
tendering. The return to service date for the L33P PAR is not expected to be earlier than 2021-Q4.

A planned two-and-a-half-week outage starting March 16, 2020 will impact interconnection circuit L51D,
reducing import and export transfer capability between Ontario and Michigan.

Independent Electricity System Operator | Public                                                              31
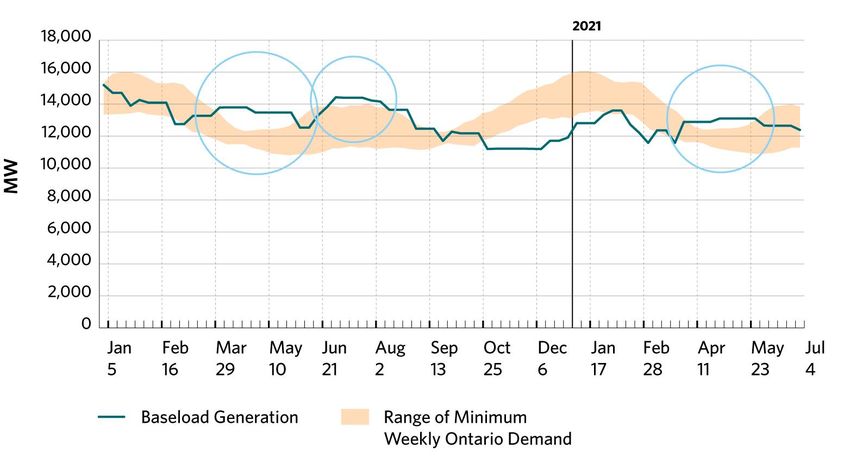
6. Operability

   During the Outlook period, Ontario will continue to experience potential surplus baseload conditions,
   much of which can be managed with existing market mechanisms, such as exports and curtailment of
   variable generation.

This section highlights existing or emerging operability issues that could impact the reliability of Ontario’s
power system.

       Regulation Needs
The IESO recently completed a regulation study to assess Ontario’s short-term regulation needs. The IESO’s
study identified the need for an additional +/-15 MW of regulation service (currently the IESO schedules at
least +/- 100 MW). This results in a regulation capacity need of 35 MW. The IESO will be conducting a
competitive RFP in 2020 to acquire this additional service.

       Seasonal Readiness
The IESO continues to use its existing programs such as unit readiness to test readiness of the generation
fleet for the upcoming winter season. The IESO is also tracking industry developments, utility best practices
and programs implemented by other jurisdictions for winter readiness and, where appropriate, will share the
relevant information with market participants to facilitate development and enhancement of their winter
readiness programs.

       Outage Management Concerns
Market participants are reminded that outage coordination is becoming more challenging given that significant
capital upgrades, such as refurbishment outages and station rebuilds, will occur at the same time as ongoing
routine maintenance. The Reliability Outlook informs market participants about critical periods, giving them
the opportunity to reschedule outages and minimize the risk of outages being revoked by the IESO in the
operating time frame.

       Grid Voltage Control
During low demand periods, including overnight, maintaining system voltages within the prescribed limits in
certain parts of the system can be challenging. Increased supply from distribution-connected resources results
in the displacement of centralized generation facilities, leading to reduced transfers across the transmission
system. Lightly loaded lines are a source of reactive power and result in high system voltages. The IESO and

Independent Electricity System Operator | Public                                                                 32
You can also read


