THE AUSTRALIAN RENEWABLE ENERGY RACE: WHICH STATES ARE WINNING OR LOSING? - Climate ...
←
→
Page content transcription
If your browser does not render page correctly, please read the page content below
THE
AUSTRALIAN
RENEWABLE
ENERGY RACE:
WHICH STATES
ARE WINNING
OR LOSING?

The Climate Council is an independent, crowd-funded organisation
providing quality information on climate change to the Australian public.

Climatecouncil.org.au
Published by the Climate Council of Australia Limited
ISBN:    978-0-9941866-7-6 (print)
         978-0-9941866-6-9 (web)
© Climate Council of Australia Ltd 2014
This work is copyright the Climate Council of Australia Ltd. All material
contained in this work is copyright the Climate Council of Australia Ltd
except where a third party source is indicated.
Climate Council of Australia Ltd copyright material is licensed under
the Creative Commons Attribution 3.0 Australia License. To view a
copy of this license visit http://creativecommons.org.au
You are free to copy, communicate and adapt the Climate Council of
Australia Ltd copyright material so long as you attribute the Climate
Council of Australia Ltd and the authors in the following manner:
The Australian Renewable Energy Race: Which States Are Winning or
Losing? by The Climate Council of Australia

Permission to use third party copyright content in this publication can
be sought from the relevant third party copyright owner/s.
This report is printed on 100% recycled paper.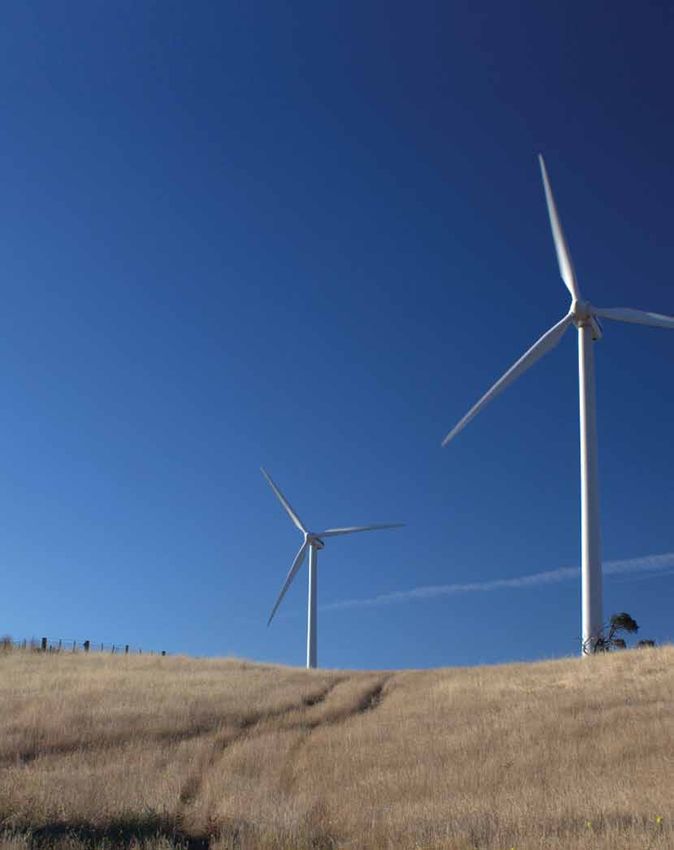
Key findings
     1. Australia’s states and territories       2. South Australia is striding
        have an important leadership                forward leading the Australian
        role to play in tackling climate            states on renewable energy.
        change and growing Australia’s             ›› Due to the policy environment,
        renewable energy industry.                    South Australia is the most
        ›› In the US, state-based actions             desirable market in Australia for
           have been highly effective.                investment. Since 2003, there
           The US is second in the world              has been $5.5 billion invested
           for installed renewable energy             in renewable energy in South
           capacity due to the majority of US         Australia, with nearly half
           states implementing targets and            occurring in regional areas.
           incentives for renewable energy.
                                                   ›› South Australia sources over 36%
        ›› In Australia, the states have              of its electricity from renewable
           historically led the way on                sources and ¼ of SA homes have
           emissions and renewable energy             solar PV panels. South Australia
           policy, influencing national               has installed more large-scale
           action. In 2003, New South                 renewable capacity since 2001
           Wales introduced the world’s first         than any other state.
           mandatory emissions trading
                                                   ›› With effective renewable energy
           scheme. In 2004 and 2006, South
                                                      policies South Australia moved
           Australia and Victoria introduced
                                                      from having little renewable
           state based renewable energy
                                                      energy a decade ago to installing
           targets in response to a low 2%
                                                      the most renewable energy since
           federal target.
                                                      2001 on a total and per capita
        ›› With the Federal government                basis. Having already met its 2020
           seeking to weaken the Renewable            renewable energy target of 33%,
           Energy Target and having                   South Australia has now set a 50%
           abolished carbon pricing,                  2025 target.
           Australian states and territories
                                                   ›› The ACT is also punching above
           have an opportunity to provide
                                                      its weight with effective emissions
           stable investment environments
                                                      reduction targets and a target of
           for renewable energy and revitalise
                                                      90% renewable energy by 2020.
           energy efficiency initiatives.
                                                   ›› Other than South Australia, no
                                                      other Australian state has a current
                                                      target to increase renewable energy.

Climatecouncil.org.au                                                                        Page iii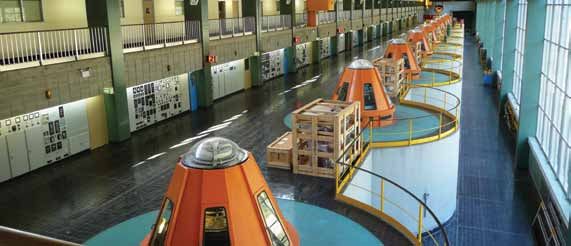
THE AUSTRALIAN RENEWABLE ENERGY RACE: WHICH STATES ARE WINNING OR LOSING?

              3. Victoria and NSW have                      4. Australia has substantial
                 moved from leaders to                         opportunities for renewable
                 laggards in Australia’s                       energy. A lack of clear federal
                 renewable energy race.                        policy has led to a drop in
                ›› In the past NSW had been a leader
                                                               renewable energy investment.
                   introducing the first emissions            ›› Australia is the sunniest country in
                   trading scheme, and Victoria was              the world and one of the windiest.
                   an early implementer of energy                Australia’s potential for renewable
                   efficiency measures.                          energy generation is 500 times
                                                                 greater than current power
                ›› Neither state now has targets
                                                                 generation capacity.
                   to reduce emissions or increase
                   renewable energy.                          ›› Twenty one thousand Australians
                                                                 are already employed in the
                ›› Victoria has excellent wind and solar
                                                                 renewable energy industry and this
                   resources, however, the restrictive
                                                                 could increase to 32,000 in 15 years
                   policy environment makes it the least
                                                                 with a strong and consistent policy
                   favourable investment environment
                                                                 environment.
                   of any Australian state for renewable
                   energy. Victoria has moved to              ›› The Federal government is seeking
                   actively discourage renewable                 to weaken the Renewable Energy
                   energy, so, in contrast to South              Target. Consequently investment
                   Australia, investment in renewable            in renewable energy in 2014 has
                   energy has dried up. Victoria’s               dropped by 70 percent compared
                   restrictive policy environment has            with the previous year.
                   cost the state an estimated $4 billion
                   in lost investment and 3,000 jobs.
                ›› Despite having 57% of the population
                   Victoria and NSW only have 40% of
                   renewable energy jobs.
                ›› Victoria’s electricity comprises only
                   12% of Australia’s new renewable
                   energy capacity and NSW 7%. NSW
                   is last among the states for new per
                   capita investment in renewable
                   energy.
                ›› The recent NSW Government
                   Renewable Energy Action Plan
                   includes 24 actions and 3 goals
                   designed to encourage renewable
                   energy in NSW. This may indicate a
                   welcome shift in NSW’s approach.

 Page iv                                                                  Climatecouncil.org.au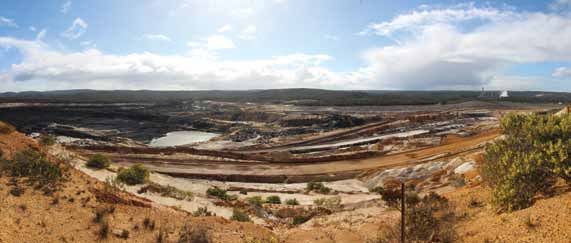
Contents
     Key findings........................................................................................................ iii
     Contents..................................................................................................................1
     Introduction ......................................................................................................... 2
     The importance of sub-national action: an international perspective                                                      2
     Australia’s renewable energy potential		                                                                                 3
     Renewable energy benefits		                                                                                              4

     Policies and Targets: How do the states and territories compare?........ 7
     Emissions		7
     Emissions reduction targets		                                                                                            8
     Renewable energy		                                                                                                       8
     Renewable energy targets		                                                                                             12

     State and territory snapshots......................................................................... 15
     South Australia		                                                                                                      15
     Victoria			                                                                                                            18
     Queensland		23
     Western Australia		                                                                                                    26
     New South Wales		                                                                                                      28
     Tasmania		31
     Australian Capital Territory (ACT) 		                                                                                  34
     Northern Territory		                                                                                                   37

     Australia Now: An opportunity for states and territories
     to take the lead....................................................................................................39
     Abbreviations and acronyms		                                                                                           41

     References...........................................................................................................42
     Image credits ..................................................................................................... 47

Climatecouncil.org.au                                                                                                              Page 1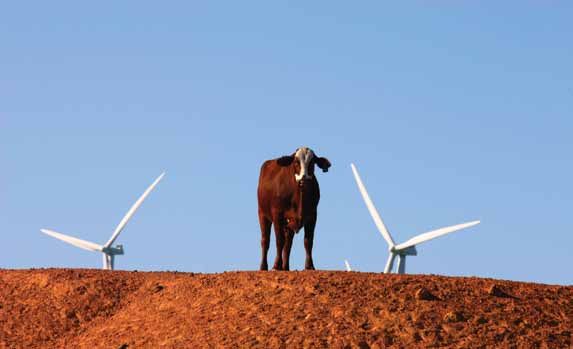
THE AUSTRALIAN RENEWABLE ENERGY RACE: WHICH STATES ARE WINNING OR LOSING?

              Introduction
              This year, much of the focus on                Previous state targets have been removed
              Australia’s climate change and renewable       after federal nationwide carbon pricing and
              energy policy has been directed at the         energy efficiency measures were legislated.
              federal level – given the review of the        With these federal measures now abolished,
              national Renewable Energy Target (RET),        industry, commerce and households in
              repeal of the Carbon Pricing Mechanism,        most states are left with no measures
              and release of a new Energy Green Paper.       to reduce emissions or improve energy
              However, while national action is vital,       efficiency to lower costs. The efficacy of
              the roles and opportunities for Australian     the Emissions Reduction Fund is yet to be
              states and territories to contribute to        established. Furthermore, uncertainty in the
              reducing greenhouse gas emissions and          RET has caused investment in renewable
              expanding renewable energy should not          energy to drop by as much as 70 percent
              be underestimated.                             over the past year. Yet, South Australia
                                                             and the ACT have set ambitious targets
              Internationally, the energy sector
                                                             to cut emissions and increase renewable
              accounts for the largest proportion of
                                                             energy uptake. Positive policy settings in
              greenhouse gas emissions, which are the
                                                             South Australia and the ACT will help these
              main drivers of climate change. Tackling
                                                             regions benefit from the global transition to
              climate change requires large scale
                                                             cleaner energy, leaving the other states and
              changes in the electricity sector and a
                                                             territory lagging behind. Experience from
              tripling of low-carbon energy by 2050.
                                                             overseas also illustrates how it is possible
              Australia’s electricity is largely generated   for state-based actions to stimulate highly
              from coal. Our fleet is ageing and             effective policy measures.
              inefficient, which means that most
              of Australia’s coal stations are much
                                                             The importance of
              more emissions intensive than other
              countries, including the USA and China.
                                                             sub-national action:
              Within the decade, around half of              an international
              Australia’s coal fuelled generation fleet      perspective
              will be over 40 years old. Australia will
              need to plan and install new electricity       Worldwide, state-based actions often lead
              generation to replace ageing generators.       to the development of national policies and
                                                             can be highly effective measures in their
              The Climate Council’s recent report            own right (Box 1).
              Australia’s Electricity Sector: Ageing,
              Inefficient and Unprepared found that          ‘Sub-national’ actions taken by state and
              rapid deployment of renewable power,           local governments often influence the
              like wind and solar, is one of the most        development of national policies:
              effective ways to reduce electricity sector       National governments often observe sub-
              emissions.                                        national level actions and consider using
              This report provides a snapshot of                successful programmes as blueprints
              current targets and policies on emissions         for national policies. China, for example,
              and renewable energy in each of                   is experimenting with carbon trading
              Australia’s states and territories, and also      mechanisms on the local level before
              measures their performance in terms of            potentially launching a nationwide
              emissions, renewable energy capacity              scheme.
              and generation.                                   (REN21 2014, Page 86)

 Page 2                                                                       Climatecouncil.org.au
Box 1: Chinese and US sub-national climate action
Sub-national actions can also be highly effective on their own, even in the
absence of national legislation or policies. The Climate Council’s ‘Lagging
Behind: Australia and the global response to climate change’ (2014a)
highlighted the significance of sub-national action in China and the United
States (US):
›› China is now home to the second largest carbon market in the world -
covering a quarter of a billion people – due to pilot emissions trading
schemes operating in two provinces and five cities.
›› Chinese cities Beijing and Hebei have introduced local clean air action
plans to reduce coal consumption, building on a new National Action Plan
for Air Pollution Prevention and Control.
›› The US remains second in the world for installed renewable energy
capacity - despite lacking a national target - largely due to the majority of
US states implementing targets and incentives for renewable energy.
›› California – one of the world’s largest economies – aims to reduce its
greenhouse gas emissions to 1990 levels by 2020. To achieve this goal, the
state has set a 33 percent renewable energy target for all energy consumed
by 2020 and put a price on carbon to drive down emissions.
›› Texas has constructed extensive new transmission lines connecting
high wind resource areas to consumers in Dallas-Fort Worth, Austin and
Houston, a move which has attracted 7,000 MW of new wind energy
projects and over 8,000 jobs to the state.
›› While there is no national price on carbon in the US, ten US states already
operate their own carbon pricing schemes.
Australia’s renewable renewable energy resources to power
all our electricity needs. AEMO (2013)
energy potential modeled scenarios for providing 100
Australia has some of the best percent of Australia’s electricity from
renewable energy resources in the renewable energy, and found potential
world, particularly in wind and solar renewable generation to be about
(Geoscience Australia and ABARE 2010). 500 times greater than demand in
the National Electricity Market (NEM)
In fact, according to the Australian
(Table 1).
Energy Market Operator (AEMO 2013)
Australia has more than enough
Climatecouncil.org.au Page 3THE AUSTRALIAN RENEWABLE ENERGY RACE: WHICH STATES ARE WINNING OR LOSING?
Australia has more than enough
renewable energy resources to
power all our electricity needs
Table 1: Total renewable energy resource by technology
Resource Maximum installable Maximum recoverable
generation capacity (GW) electricity (TWh/yr)*
Wind – onshore 880 3100
Wind – offshore 660 3100
Solar – concentrating solar 18,500/ 24,100 41,600/71,700
thermal/ photovoltaic
Geothermal 5,140 36,040
Biomass 16 108
Wave 133 275
Total** 25,700/31,300 86,800/116,900
Current NEM (actual installed 50 200
capacity and annual generation,
all technologies)
Notes:
* TWh/yr relates to generation (capacity over time). Table 1 shows that Australia currently uses
200 TWh/yr in the NEM, but the potential (in renewables) is more than 86,000 TWh/yr.
** Current NEM installed capacity is 50 GW, but the potential (in renewables) is more than 25,000 GW
(that is, more than 500 times the current capacity).
Source: AEMO 2013
However despite having world-class are already employed in the renewable
renewable energy resources, particularly energy industry in Australia (Clean
in wind and solar, Australia has a low Energy Council 2014a) and modeling
share of renewable electricity generation by the Climate Institute (2011) estimated
– seventh lowest among 28 member that nearly 32,000 renewable energy jobs
countries of the International Energy (including over 6,800 new permanent
Agency (Australian Energy Regulator jobs) could be created in Australia by
2012). According to Bloomberg New 2030 with strong and consistent climate
Energy Finance, uncertainty over the policies.
RET in Australia has resulted in a 70%
Farmers and landowners in regional
slump in investment in renewable energy
areas who lease their land for wind
over the past year (The Guardian 2014).
turbines also benefit through annual
lease payments which provide a reliable,
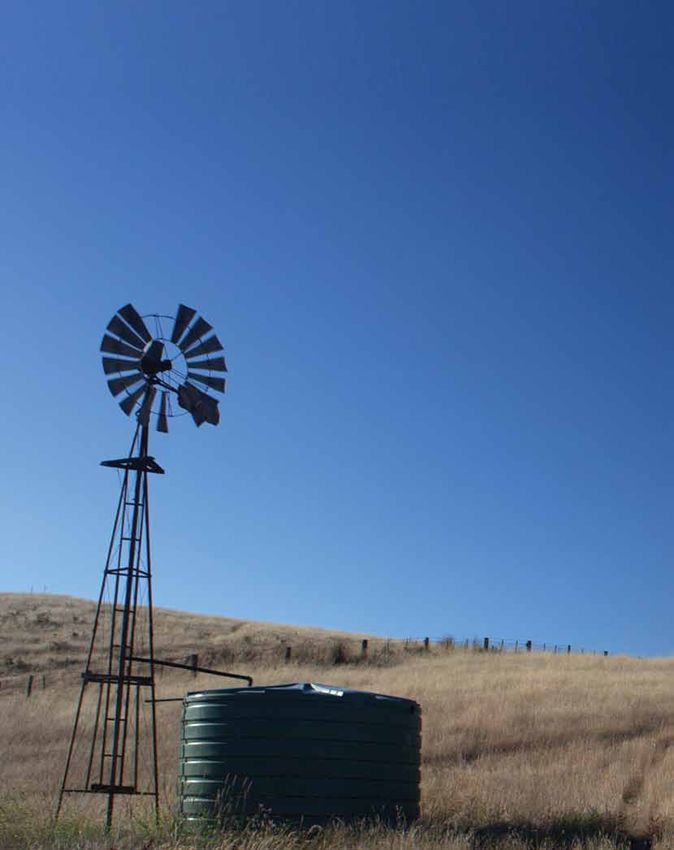
Renewable energy alternative source of income and help to
benefits “drought-proof” farms (Chapman 2013).
Around $16.4 million is paid annually
As well as providing low or no emissions in lease payments for hosting wind
energy, renewables attract investment turbines (Epuron 2014; Clean Energy
and create jobs, particularly in regional Council 2014a).
Australia. Twenty one thousand people
Page 4 Climatecouncil.org.auFigure 1: Australian wind farm and agriculture, Western Australia
Solar and wind provide clean energy study found these cost savings had not
and consequently also have additional been passed on to households and small
benefits of reducing the pollution business due to exemptions for energy
from other energy sources. Coal, the intensive industries, the market power of
dominant fuel for electricity in Australia the large retailers, and the regulation of
produces pollutants that damage human electricity tariffs in some states (Cludius
health through mining, transportation, et al 2014).
combustion and the disposal of waste Electricity from coal is likely to be more
(Epstein et al 2011). In Australia, it is expensive than renewables, if the cost of
estimated that the adverse impacts from retrofitting Carbon Capture and Storage
pollutants produced from coal-fired (CCS) technology is factored in, or if
electricity generation costs A$ 2.6 billion new fossil fuelled stations with CCS are
annually (ATSE 2009). built. Furthermore, even new gas fuelled
The least expensive zero emission option power plants in Australia without CCS
available at scale for deployment today in may become more expensive than new
Australia is wind, closely followed by field renewables now that gas prices are
scale solar PV (Climate Council 2014b). increasing, as gas producers can choose
Over each full year, renewables are to export that gas at much higher LNG
reducing wholesale electricity prices, not export prices (Elliston et al 2014).
only in Australian states where wind and When demand for electricity is high
solar PV penetration is high, but in many (e.g. during heatwaves) renewable
overseas markets (e.g. Denmark, Texas energy generation has helped keep
and Germany) (Sinclair Knight Merz 2013). electricity prices down. For example, in
A University of New South Wales study South Australia and Victoria, during the
analysed wind generation, electricity summer heatwaves in 2014, electricity
demand and price data in the NEM prices were at least 40 percent lower than
between 2011 and 2013 and found wind they would have been otherwise without
reduced the average wholesale electricity the contribution of wind energy (Sinclair
price by 5 to 8 percent. However the Knight Merz 2014).
Climatecouncil.org.au Page 5THE AUSTRALIAN RENEWABLE ENERGY RACE: WHICH STATES ARE WINNING OR LOSING?
Box 2 – Economic benefits of a 50 MW wind farm
Case Study: Economic Benefits of a Wind Farm to the Local Economy
›› Construction of a 50 MW wind farm provides a gross value added of some
$50 million to a state and contributes up to 0.21 percent to gross state
product depending on the size of the state economy.
›› Construction of a 50 MW wind farm is estimated to contribute up to 2.6
per cent to gross regional product depending on the size of the regional
economy.
›› Construction could lead to potential local personal expenditure of $25,000
per person per annum. If, for example, a wind farm had an average
construction workforce of some 35 over a two-year construction period
then the expenditure in the region would be some $875,000 in total per
annum on accommodation, food and other services.
›› The same wind farm could employ between five and six full-time-
equivalent staff for operations and maintenance with a potential ongoing
expenditure of $125,000–150,000 per annum.
›› In addition, a 50 MW wind farm project is likely to provide up to $250,000
in payments to farmers and an ongoing community contribution that could
be some $80,000 per annum for the life of the project.
›› This expenditure is likely to be a minimum as wind farm developers’
policies of sourcing suppliers and services locally as far as possible also
mean that transport, plant hire and materials such as crushed rock, cement,
sand and gravel are likely to be provided from local sources.
Extract from Commissioner for Environmental Sustainability Victoria (2013)
Science Policy People Victoria: State of the Environment
Page 6 Climatecouncil.org.auPolicies and Targets:
How do the states and
territories compare?
Emissions emissions (149 Mt CO2e) (Department
of the Environment 2014).
Climate change is driven by the emission
A fairer basis for comparing state and
of greenhouse gases, from fossil fuels
territory emissions is on a per capita basis
and deforestation, which trap heat at the
(Table 3). Tasmania and South Australia
Earth’s surface heating the oceans, air
have the lowest per capita emissions
and land surfaces (IPCC 2014). It is clear
of the states (15.2 and 18.1 Mt CO2e per
that greenhouse gases must be reduced
person respectively) partly reflecting the
dramatically to effectively tackle climate
higher proportion of renewables in their
change (Climate Commission 2013).
electricity supply (ABS 2012; Department
It is no surprise that states with larger of the Environment 2014). The mining
populations generally have greater total states of Queensland and WA have the
emissions (Table 2). For example, New highest emissions of the states.
South Wales has the largest population
and highest total greenhouse gas
Table 2: Total emissions (Mt CO2-e)
Australia’s emissions = 543.6 Mt CO2-e (in 2012)
Highest Lowest
NSW QLD VIC WA SA NT TAS ACT
149 135 129 76 30 15 8 1
Note: The most up to date data on state and territory emissions is for 2012
Source: Department of the Environment 2014
Table 3: Emissions per person (t CO2-e/cap)
Australian average (2012) = 23.96 t CO2-e
OECD average (2012) = 12.47 t CO2-e
Highest Lowest
NT WA QLD VIC NSW SA TAS ACT
63 31.2 29.5 23.0 20.4 18.1 15.2 3.5
Note: 2012 population statistics are used to accord with the emissions data
Source: ABS 2012; Department of the Environment 2014; OECD StatExtracts 2014
Climatecouncil.org.au Page 7THE AUSTRALIAN RENEWABLE ENERGY RACE: WHICH STATES ARE WINNING OR LOSING?
Emissions reduction than other states and territories, but this is
largely due to hydroelectric schemes built
targets in the 1950s and 60s (Clean Energy Council
Up until recently, all Australian states 2014a; Commonwealth of Australia 2014;
and territories had targets for reducing Table 4).
emissions. Once these “old” renewables are taken out
South Australia and the ACT have of the equation, South Australia clearly
retained their targets and continue to leads the country in installed “new”
work towards reducing emissions: renewable energy capacity with 1,478 MW
of mainly wind power installed since 2001.
›› South Australia aims to reduce
On this measure, Victoria is second (1,285
emissions to 60 percent below
MW) and New South Wales and Tasmania
1990 levels by 2050.
fall back to fifth and sixth place respectively
›› The ACT aims to reduce emissions to (Commonwealth of Australia 2014).
80 percent below 1990 levels by 2050
These numbers highlight the significance
(with an interim target of 40 percent
of renewable energy targets and policy in
by 2020).
South Australia. A little over a decade ago,
Meanwhile, the other states and territory South Australia had very little renewable
have shelved targets and policies for energy capacity to speak of, but is now
reducing emissions (partly in response a leader in renewables after a decade of
to the introduction of a federal emissions increasing targets for renewables and
target): supporting policies.
›› Victoria, Queensland, Western Whereas, Victoria, once a leader in
Australia and the Northern Territory renewable energy has lagged behind.
currently have no emissions reduction Victoria’s restrictive planning rules that
targets or policies in place. actively discourage new wind farm
developments make the state the worst
›› Tasmania has abandoned its 2020
policy environment for renewable energy
emissions reduction goal and
growth. Consequently, investment in
abolished the state’s Climate Action
renewable energy in Victoria has dried
Council, but retains the state’s 2050
up, while South Australia has ramped up
target (set in legislation).
renewable energy uptake.
Renewable energy
New South Wales (5,681 MW), Tasmania
(2,695 MW) and Victoria (2,432 MW) have
greater total renewable energy capacity
The ACT aims to reduce emissions to
80 percent below 1990 levels by 2050
Page 8 Climatecouncil.org.auA little over a decade ago, South
Australia had very little renewable
energy capacity to speak of, but is
now a leader in renewables after
a decade of increasing targets for
renewables and supporting policies
Table 4: Total installed renewable energy capacity (MW)
Australian total = 15,762 MW
Highest Lowest
NSW TAS VIC QLD SA WA ACT NT
5,681 2,695 2,432 2,219 1,735 936 47 16
Source: Clean Energy Council 2014a
Table 5: Large-scale renewable capacity installed since 2001 (MW)
Australian total = 5,062 MW
Highest Lowest
SA VIC QLD WA NSW TAS ACT NT
1,478 1,285 682 642 599 344 26 5
Note: The large-scale renewable capacity data includes wind projects in NSW and Victoria currently under
construction but not yet commissioned and excludes NSW solar PV field scale project under construction.
There appears to be a discrepancy between these figures and Australian Energy Market Operator figures for
Queensland, with significantly more landfill gas capacity being reported in the RET review. The above table
includes 509 MW of landfill gas for Queensland – more than fifteen times NSW’s 33 MW, the next highest
amount (AEMO 2014).
Source: Commonwealth of Australia 2014, based on data provided by the Clean Energy Regulator current at
16 July 2014
Climatecouncil.org.au Page 9THE AUSTRALIAN RENEWABLE ENERGY RACE: WHICH STATES ARE WINNING OR LOSING?
WHICH STATES ARE RENEWABLE ENERGY POWERHOUSES?
1ST SA 0.89 kW/person
2ND TAS 0.67
3RD WA 0.26
4TH VIC 0.23
5TH QLD 0.15
LARGE-SCALE
6TH NSW 0.08 RENEWABLE
CAPACITY
7TH ACT 0.07
INSTALLED SINCE 2001
PER PERSON (KW/CAP)
8TH NT 0.02
Source: ABS 2012; Commonwealth of Australia 2014.
Figure 2: Large-scale renewable energy capacity installed since 2001
per person (kW/cap)
South Australia’s lead over the other energy in electricity generation (Table 6
states and territories becomes more and Figure 3). On this measure Tasmania
striking when renewable capacity is clearly in the lead with 93 percent
additions are considered on a per renewables in its electricity supply. South
person basis (Figure 2). Australia follows on 36 percent with the
other states at 12 percent or lower
Another measure for comparing the
(Clean Energy Council 2014a).
states is the percentage of renewable
Table 6: Electricity generation from renewables %
Highest Lowest
TAS SA VIC WA NSW QLD
93% 36% 12% 11% 7% 6%
Note: Equivalent data on the percentage of renewable energy in ACT or Northern Territory electricity
supply was not available.
Source: Clean Energy Council 2014a
Page 10 Climatecouncil.org.auELECTRICITY GENERATION FROM RENEWABLES IN AUSTRALIA
ELECTRICITY GENERATION FROM RENEWABLES IN AUSTRALIA
1ST TAS 93%
2ND SA 36%
3RD VIC 12%
4TH WA 11% ELECTRICITY
GENERATION
5TH NSW 7%
FROM RENEWABLES
6TH QLD 6%
Source: Clean Energy Council 2014a
Figure 3: Percentage of renewable energy generation in electricity
South Australia leads in terms of 5.1 percent of households, which is
the percentage of households with surprising given the high cost of retail
solar PV – 26 percent - more than electricity, good solar insolation, and
one in four dwellings (Table 7). The often remote high cost alternative
Northern Territory performs worst on electricity supply options.
this measure, with solar PV on only
Table 7: Percentage of dwellings with solar PV
Highest Lowest
SA QLD WA NSW ACT VIC TAS NT
26.1% 24.9% 18.4% 11.8% 11.7% 11.4% 10.4% 5.1%
Source: Australian PV Institute 2014
Climatecouncil.org.au Page 11THE AUSTRALIAN RENEWABLE ENERGY RACE: WHICH STATES ARE WINNING OR LOSING?
Renewable energy In 2013, New South Wales released a
renewable energy action plan to support
targets the state in meeting its share of the
South Australia and the ACT both national RET. The plan includes goals
actively encourage renewable energy to attract investment, build support and
development. expertise.
Since 2004, South Australia has Solar photovoltaic (PV) costs are rapidly
consistently ramped up its targets for falling. Declining prices coupled with
renewable energy: the introduction of the small-scale
component of the national RET, provides
›› initially aiming for renewable energy
an alternative incentive for households
to make up 15 percent of electricity
installing small-scale renewable energy
consumption by 2014
systems. Almost all states and territories
›› then 20 percent renewables in have now substantially reduced or closed
electricity production by 2014 previous feed-in tariff schemes. Most
states and territories now offer less than
›› then 33 percent renewables in
10 cents per kilowatt-hour for solar
electricity production by 2020.
energy fed into the grid or a rate set by
South Australia has recently adopted a the retailer.
50 percent renewable energy target for
The ACT has designed its feed-in tariff
2025 (electricity produced) and it is likely
policy differently to the other states and
the state will meet the new target ahead
territory. The ACT’s feed-in tariffs are
of schedule (RenewEconomy 2014c).
allocated by reverse auction, aiming at
The ACT aims for renewable energy attracting new large-scale wind and solar
to supply 90 percent of electricity projects to the territory at the lowest price.
consumed in the territory by 2020 (ACT
Government 2013; Figure 4). Renewable
energy produced under the national RET
will not count towards the ACT’s target,
which relies solely on local and regional
renewable energy projects.
Victoria now has the worst policy
environment for renewables in
the country
Page 12 Climatecouncil.org.auSouth Australia and the ACT - with
progressive renewable energy
policies and targets - are winning
the Australian renewable energy race
Despite its high quality wind resources It is clear that while other states stifle
and past support for renewable energy advances in renewable energy uptake,
(such as the 10 percent by 2010 Victorian South Australia and the ACT - with
Renewable Energy Target), Victoria now progressive renewable energy policies
has the worst policy environment for and targets - are winning the Australian
renewables in the country. Victoria has renewable energy race.
no targets or policies to attract renewable
energy. It also has planning rules that
actively discourage new wind farm
developments through extensive “no
go” areas and veto right for landowners
within two kilometres of a wind turbine.
Climatecouncil.org.au Page 13THE AUSTRALIAN RENEWABLE ENERGY RACE: WHICH STATES ARE WINNING OR LOSING?
HOW DOES YOUR STATE MEASURE UP
ON RENEWABLES?
NT
No renewable
energy target QLD
Most renewable
Lowest % of
households with ENERGY
solar PV (5.1%) JOBS (6,545)
WA Lowest proportion of
renewables (6%)
NO RENEWABLE Most Solar
ENERGY TARGET
(earlier target of 15% SA
Highest % of
50%
renewable
energy target
PV (1,151 MW)
renewables by 2020
NSW
households by 2025
was scrapped) with solar Largest wind capacity
PV (26.1%) - 1,205 MW (40% of
Australia’s capacity) World first in 2003: mandatory
emissions trading scheme
Largest hydroelectric
capacity (4,562 MW)
VIC
Restrictive planning laws ACT
discourage wind energy 90% renewable energy
Worst policy environment TARGET BY 2020
for renewables in Australia Feed-in tariff scheme to
attract large scale projects
TAS Largest proportion
of renewables (93%)
Lowest feed-in tariff for
roof top solar (5.6c/kWh)
Figure 4: How does your state measure up on renewables?
Source: Data from ABS 2012; ACT Government 2013; Australian PV Institute 2014;
Clean Energy Council 2014a; RenewEconomy 2014b
Page 14 Climatecouncil.org.auState and territory
snapshots
South Australia Renewable energy
In 2013, South Australia had 1,735 MW
of installed renewable energy (Clean
Energy Council 2014a) – mainly
comprising wind and solar PV.
South Australia has installed the most
renewable energy capacity of any state
or territory since 2001 – 1,478 MW
(Commonwealth of Australia 2014).
South Australia leads the country in
wind and solar PV. South Australia has
the most wind farms of any state – and
is home to 40 percent of Australia’s wind
capacity. 28 percent of South Australia’s
electricity demand was supplied by wind
power in 2013 (Clean Energy Council
Emissions
2014b). South Australia has the greatest
South Australia’s emissions have been percentage of households with solar PV
decreasing since around 2007. Emissions – 26 percent (see, for example, Figure 5).
in 2012 were 29.9 MtCO2e representing
5.5 percent of Australia’s total emissions Renewable energy targets
(2012 figures) (ABS 2012; Department of
the Environment 2014). The Strategic Plan also set a target for
renewable energy to make up 33 percent
South Australia’s per capita emissions of South Australia’s electricity production
are the third lowest in Australia at by 2020, with an interim target of 20
18.07 tCO2e per person after the ACT percent by 2014 (Government of South
and Tasmania (ABS 2012; Department of Australia 2011a).
the Environment 2014).
This year, having already met its 33
percent renewable energy target for
Emissions reduction targets
2020, the South Australian Government
South Australia’s Strategic Plan announced a new target for renewable
establishes targets for limiting the energy to make up 50 percent of electricity
state’s greenhouse gas emissions to: production by 2025. It is likely that the
›› 8 percent above 1990 levels by 2012 state will again meet this target ahead of
schedule (RenewEconomy 2014b).
›› 60 percent below 1990 levels by 2050
(Government of South Australia 2011a).
Climatecouncil.org.au Page 15THE AUSTRALIAN RENEWABLE ENERGY RACE: WHICH STATES ARE WINNING OR LOSING?
Renewable energy policy ›› Consulting on a specific limit on
carbon emissions for new electricity
In 2011, South Australia released its
generation.
A Renewable Energy Plan for South
Australia (Government of South Australia ›› Supporting concentrating solar power
2011b) with the aim to make South for heat and electricity in Port Augusta.
Australia the most attractive investment Since 2003, there has been $5.5 billion
destination for renewable energy. The invested in renewable energy in South
plan outlined initiatives such as: Australia, with nearly half occurring in
›› Introducing legislation to provide regional areas. The South Australian
renewable energy developers with Government recently set an aspirational
access to Crown Land areas subject target to attract $10 billion dollars in
to pastoral lease. investment in renewable energy in the
state by 2025 (Renewables SA 2014).
›› Supporting the design and
implementation of a concept model South Australia’s feed-in tariff for small-
for community-owned solar. scale renewable energy is currently set at a
minimum of 6c/kWh (Solar Market 2014).
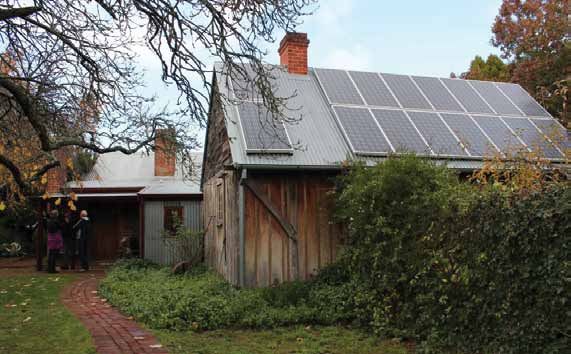
South Australian policy settings
make it a highly desirable location
for renewable energy investment
Figure 5: Solar PV on Hahndorf historic house, South Australia
Page 16 Climatecouncil.org.auThere have been many periods in 2014 South Australia is also home to the
when renewable energy generation in 1 MW Habanero geothermal pilot
South Australia exceeded the total state plant at Innamincka in South Australia
demand. Notably, on Tuesday September (Clean Energy Council 2014d).
30, renewable energy provided more
Morphett Vale is South Australia’s
than 100 percent of the state’s electricity
top solar postcode with 3,968 solar
needs for the working day 9:30 to 6 pm
PV systems installed totaling 10 MW
(RenewEconomy 2014b).
(Australian PV Institute 2014).
On Tuesday September 30,
renewable energy provided more
than 100 percent of SA’s power
Table 8: South Australia – key statistics
Statistic Total Percentage
Population 1.655 7
(million, % of Australian total)
Emissions 29.9 5.5
(MtCO2e, % of Australian total)
Per capita emissions 18.07 /
(tCO2e per person)
New large-scale renewable energy capacity since 2001 1,478 29
(July 2014) (MW, % of Australian total)
Installed renewable energy capacity (December 2013) 1,735 11
(MW, % of Australian total)
Installed wind capacity (December 2013) 1205 /
(MW)
Installed solar PV capacity (December 2013) 533 /
(MW)
Dwellings with solar PV / 26
(%)
Electricity generation from renewables (December 2013) 4345 36
(GWh, % of total generation for state/territory)
Renewable energy jobs 3375 16
(number, % of Australian total)
Note: New large-scale renewable energy capacity reflects additional projects commissioned since
December 2013
Sources: ABS 2012; Australian PV Institute 2014; Clean Energy Council 2014a,b and c;
Commonwealth of Australia 2014; Department of Environment 2014
Climatecouncil.org.au Page 17THE AUSTRALIAN RENEWABLE ENERGY RACE: WHICH STATES ARE WINNING OR LOSING?
Victoria power stations: Hazelwood, Yallourn,
Loy Yang A and Loy Yang B in the
Latrobe Valley, and the Anglesea Power
Station on the Surf Coast (Department
of the Environment and Sustainability
2012; Environment Victoria 2014).
Per capita emissions in Victoria were
29.50 tCO2e per person in 2012 (ABS
2012; Department of the Environment
2014) – fourth highest among the states.
Emissions reduction targets
Victoria does not have an emissions
reduction or a renewable energy target
in place.
Victoria removed its emissions reduction
Emissions
target (previously 20 percent below 2000
At 129.4 MtCO2e (in 2012), Victoria’s levels by 2020) after the introduction
greenhouse gas emissions are the of the national emissions target and
third highest of any state or territory. Carbon Pricing Mechanism (Victorian
Victoria is responsible for 23.8 percent Government 2012a). There have been no
of Australia’s emissions. The majority state initiatives or emissions reduction
of Victoria’s emissions are due to targets proposed following the removal
stationary energy, particularly brown of the national carbon price.
coal (Department of Environment 2014
and ABS 2012). Around ninety percent
of Victoria’s electricity and over fifty
percent of its greenhouse gas emissions
come from five polluting coal-fired
Page 18 Climatecouncil.org.auRenewable energy Renewable energy policy
In 2013, Victoria had 2,432 MW of Victoria currently applies an 8c/kWh
installed renewable energy capacity, feed-in tariff for household renewable
mainly made up of wind, hydroelectric, energy systems less than 100 kilowatts in
and solar PV (Clean Energy Council size. The rate will drop to 6.2 cents from
2014a). Victoria is second after January 2015 (Victorian Government
South Australia for new renewable 2014).
energy capacity installed since 2001
In 2014, the State Government released
(Commonwealth of Australia 2014),
Victoria’s energy statement (2014)
reflecting the success of the previous
focusing on energy affordability, safety
state based targets for renewable
and developing energy resources. The
energy and Victoria’s high quality
policy supports coal (see, for example,
wind resource. On a per capita basis,
Figure 6) continuing as the main source
Victoria is fourth in added renewable
of Victoria’s electricity in the short to
energy capacity and restrictive planning
medium term, with the national RET
rules are discouraging investment in
acting as the main driver of renewables
renewable energy.
in the state.
Victoria has the largest and the third
Hoppers Crossing is Victoria’s top solar
largest wind farms in the country - the
postcode with 4,185 solar PV systems,
420 MW AGL Macarthur Wind Farm and
totalling nearly 10 MW (Australian PV
ACCIONA’s 192 MW Waubra Wind Farm.
Institute 2014).
Victoria is home to the first community-
owned wind project in Australia –
Hepburn Wind Farm.
Renewable energy targets
Victoria’s state-based renewable energy
target (previously set at 20 percent of
energy consumed by 2020) was also
closed after the introduction of the
expanded national RET for 2020
(Climate Change Authority 2012).
Climatecouncil.org.au Page 19THE AUSTRALIAN RENEWABLE ENERGY RACE: WHICH STATES ARE WINNING OR LOSING?
Victoria’s new planning rules have cost
the state an estimated $4 billion in lost
investment and 3,000 jobs
In Victoria, it is now easier to gain planning approval for a new coal mine than a wind
farm (Victorian Environment Defenders Office 2011; Table 9).
Table 9: Victorian planning controls for wind farms, coal mines and
natural gas drilling
Wind farm Coal mine Natural gas drilling
How close can it be to 2km 100m No mandatory buffer
your home without distance
The Minister can
your consent?
override this to make it
closer
Is statutory Yes Maybe Maybe
compensation available
For landowners whose Only if loss or Only if loss or
to nearby landowners?
property lies within damage is a direct, damage is a direct,
1km of a wind turbine. natural or reasonable natural or reasonable
consequence of consequence of
approving a mine approving a mine
licence. licence.
Are there blanket Yes National parks National parks
exclusions for any
In or near national or But the Minister may But the Minister
places?
state parks, Ramsar allow mining in certain may allow mining in
wetlands; in the Yarra cases. certain cases.
Valley, Dandenong
Ranges, Mornington
Peninsula, Bellarine
Peninsula, Macedon
and McHarg Ranges;
within five kilometres
of the high water mark
on the Bass Coast and
the Great Ocean road;
within five kilometres
of regional cities; in
locations identified for
future urban growth.
Source: Environment Defenders Office (Victoria) 2011; Victorian Government 2012b
Page 20 Climatecouncil.org.auFigure 6: Anglesea opencut coal mine
Box 3 – Victoria’s wind energy planning restrictions
The Victorian Government imposes strict planning rules on wind energy,
prohibiting wind farms:
›› With wind turbines proposed within two kilometres of a dwelling without
written consent from the owner of the dwelling.
›› In National and State Parks.
›› In Ramsar wetlands.
›› In the Yarra Valley, Dandenong Ranges, Mornington Peninsula,
Bellarine Peninsula, Macedon and McHarg Ranges.
›› Within five kilometres of the high water mark on the Bass Coast and
the Great Ocean road.
›› Within five kilometres of regional cities.
›› In locations identified for future urban growth.
Source: Victorian Government 2012b.
Victoria’s restrictive planning rules discourage renewable energy investment,
increase energy costs by forcing wind development in areas with poorer wind
resources, and have had flow on negative effects for manufacturers in Victoria
(Commissioner for Environmental Sustainability 2013). Only two small wind
farms have successfully gained planning approval since the new rules were
enacted – Cherry Tree Wind Farm (16 turbines) and Coonooer Bridge
(5 turbines) (SMH 2013).
Victoria’s Commissioner for Environmental Sustainability (2013) reported
Victoria’s new planning rules have cost the state an estimated $4 billion in
lost investment and 3,000 jobs.
Climatecouncil.org.au Page 21THE AUSTRALIAN RENEWABLE ENERGY RACE: WHICH STATES ARE WINNING OR LOSING?
Table 10: Victoria – key statistics
Statistic Total Percentage
Population 5.623 25
(million, % of Australian total)
Emissions 129.4 23.8
(MtCO2e, % of Australian total)
Per capita emissions 23.01 /
(tCO2e per person)
New large-scale renewable energy capacity since 2001 1,285 25
(July 2014) (MW, % of Australian total)
Installed renewable energy capacity 2,432 15
(MW, % of Australian total) (December 2013)
Installed wind capacity (December 2013) 939 /
(MW)
Installed solar PV capacity (December 2013) 625 /
(MW)
Dwellings with solar PV / 11.4
(%)
Electricity generation from renewables (December 2013) 6,433 12
(GWh, % of total generation for state/territory)
Renewable energy jobs 3,700 18
(number, % of Australian total)
Note: New large-scale renewable energy capacity reflects additional projects commissioned since
December 2013
Sources: ABS 2012; Australian PV Institute 2014; Clean Energy Council 2014a,b and c;
Commonwealth of Australia 2014; Department of Environment 2014
Page 22 Climatecouncil.org.auQueensland Emissions reduction targets
Queensland does not currently have
targets for reducing emissions or
expanding renewable energy.
The Queensland government had
previously set the following targets
to limit greenhouse gas emissions:
›› 30 percent below 2000 levels by 2020.
›› 60 percent below 2000 levels by 2050
(Queensland Government 2007).
Following the election of a new
government in March 2012,
Queensland abandoned its
climate change policies and
targets (Jones 2012).
Emissions
Queensland has the second largest total Renewable energy
emissions of any Australian state or
In 2013, Queensland had 2,219 MW
territory at 134.5 MtCO2e (in 2012), and
of installed renewable energy (Clean
emissions have been steadily increasing
Energy Council 2014a). Only 682 MW of
since 1990. In 2012, Queensland’s
renewable capacity has been added since
greenhouse gas emissions represented
2001 (Commonwealth of Australia 2014).
nearly a quarter, 24.7 percent, of
Queensland is fifth in terms of new
Australia’s national emissions with
renewable capacity per capita.
stationary energy and agriculture the
main sources of emissions (ABS 2012; Aptly referred to as the “sunshine state”,
Department of the Environment 2014). almost half of Queensland’s renewable
energy capacity is solar PV and
Queensland’s per capita emissions were
Queensland has the most installed solar PV
the third highest of any state or territory
capacity (1,151 MW; Table 11) of any state
at 29.50 tCO2e per person in 2012 (ABS
or territory. Hydro and biomass are also
2012; Department of the Environment
significant sources of renewable energy.
2014).
›› Queensland has 6,545 people
employed in the renewable energy
industry – the most jobs of any state or
territory (Clean Energy Council 2014a).
Climatecouncil.org.au Page 23THE AUSTRALIAN RENEWABLE ENERGY RACE: WHICH STATES ARE WINNING OR LOSING?
›› However, Queensland has the lowest Queensland’s strategy schedules
percentage of renewables in electricity emissions reduction actions to occur
generation of any of the states, with between 2016 and 2026 with the specific
renewable energy only providing action to: assess Queensland’s ability
6 percent of electricity generated in to contribute to emissions reductions
2013 (Clean Energy Council 2014a). (Department of Energy and Water
Supply 2014).
›› Australia’s largest solar thermal
project, the 44 MW Solar Boost facility Queensland’s state-wide feed-in tariff
is currently under construction in scheme was closed in 2014. Households
Queensland (Clean Energy Council in southeast Queensland installing
2014e). renewable energy systems will now
receive payment for electricity exported
›› Queensland is home to one of two
to the grid at a rate set by the retailer.
operational geothermal plants in
The Queensland Competition Authority
Australia – the 0.12 MW Birdsville
will continue to regulate feed-in tariff
plant (Clean Energy Council 2014e).
rates for regional areas (Ergon Energy
›› Bundaberg is Queensland’s top solar territory) with rates currently set at
postcode with 8,015 solar PV systems 6.5 cents per kWh (Queensland
installed totaling 22.6 MW (Australian Competition Authority 2014). Ergon
PV Institute 2014). Energy has recently announced it will
limit payment of solar feed-in tariffs
Renewable energy policy to systems exporting less than 5kW to
In June 2014, the Queensland the grid (Ergon Energy 2014).
Government released its long-term
strategy for Queensland’s electricity
sector. PowerQ: a 30-year strategy for
Queensland’s electricity sector identifies
emissions reductions as being led at the
international and national level.
Almost half of Queensland’s
renewable energy capacity is solar
PV and Queensland has the most
installed solar PV capacity (1,151 MW)
Page 24 Climatecouncil.org.auTable 11: Queensland – key statistics
Statistic Total Percentage
Population 4.56 20
(million, % of Australian total)
Emissions 134.5 24.7
(MtCO2e, % of Australian total)
Per capita emissions 29.5 /
(tCO2e per person)
New large-scale renewable energy capacity since 2001 682 13
(July 2014) (MW, % of Australian total)
Installed renewable energy capacity (December 2013) 2219 14
(MW, % of Australian total)
Installed wind capacity (December 2013) 12.5 /
(MW)
Installed wind capacity (December 2013) 1,151 /
(MW)
Dwellings with solar PV / 25
(%)
Electricity generation from renewables (December 2013) 3478 6
(GWh, % of total generation for state/territory)
Renewable energy jobs 6545 31
(number, % of Australian total)
Note: The referenced large-scale renewable capacity data includes significantly more landfill gas for
Queensland - 509 MW of landfill gas more than fifteen times NSW’s 33 MW, the next highest amount.
Sources: ABS 2012; Australian PV Institute 2014; Commonwealth of Australia 2014; Clean Energy
Council 2014a,b and c; Department of Environment 2014
Climatecouncil.org.au Page 25THE AUSTRALIAN RENEWABLE ENERGY RACE: WHICH STATES ARE WINNING OR LOSING?
Western Australia 2020 (Western Australian Government
2007). These targets remained ‘active’ in
December 2009 but were subsequently
removed with the release of new energy
and climate change policies in 2011
and 2012 respectively (Department of
Environment and Conservation 2009,
Western Australian Government 2011
and 2012). Western Australia, therefore,
does not have a state-based greenhouse
gas emissions reduction target.
Renewable energy
In 2013, Western Australia had 936 MW
of installed renewable energy capacity
(Clean Energy Council 2013a), with
Emissions 642 MW installed since 2001. Wind and
solar make up the majority of Western
Western Australia’s annual greenhouse
Australia’s renewables (Table 12).
gas emissions were 75.9 MtCO2e
in 2012, representing 14 percent of Western Australia has the second largest
Australia’s emissions. Western Australia’s wind farm in the country – 206 MW
emissions have been growing since 1990 Collgar Wind Farm.
(Department of Environment 2014, ABS Mandurah is the top solar postcode with
2012). 7,362 solar PV systems, totaling 14.5 MW
Western Australia has the second highest (Australian PV Institute 2014). Mandurah
per capita emissions overall (after the residents earn less than the average
Northern Territory) at 31.23 tCO2e per wage in Western Australia, reflecting a
person (Department of Environment nation-wide trend of solar uptake being
2014, ABS 2012). highest in areas with lower than average
incomes (RenewEconomy 2014d).
Emissions reduction targets
Renewable energy targets
Previously, Western Australia had a goal
to reduce greenhouse gas emissions by The state does not have a renewable
60 percent below 2000 levels by 2050, energy target (Western Australian
an aspirational target of 15 percent Government 2011, 2012).
renewables and 60 percent cleaner
energy (gas and renewables) on the
South West Interconnected System by
Page 26 Climatecouncil.org.auRenewable energy policy exported to the grid at a rate set by the
retailer. Synergy customers receive
Western Australia’s feed-in tariff scheme
8.4c/kWh and Horizon Energy customers
was closed in 2011. Households installing
between 10 to 50c/kWh depending on
renewable energy such as solar PV
the location (Solar Market 2014).
systems receive payment for electricity
Table 12: Western Australia – key statistics
Statistic (measure) Total Percentage
Population 2.43 11
(million, % of Australian total)
Emissions 75.9 14
(MtCO2e, % of Australian total)
Per capita emissions 31.23 /
(tCO2e per person)
New large-scale renewable energy capacity since 2001 642 13
(July 2014) (MW, % of Australian total)
Installed renewable energy capacity (December 2013) 936 6
(MW, % of Australian total)
Installed wind capacity (December 2013) 491 /
(MW)
Installed solar PV capacity (December 2013) 398 /
(MW)
Dwellings with solar PV / 18.4
(%)
Electricity generation from renewables (December 2013) 2075 11
(GWh, % of total generation for state/territory)
Renewable energy jobs 1615 8
(number, % of Australian total)
Sources: ABS 2012; Australian PV Institute 2014; Clean Energy Council 2014a,b and c;
Commonwealth of Australia 2014; Department of Environment 2014
Climatecouncil.org.au Page 27THE AUSTRALIAN RENEWABLE ENERGY RACE: WHICH STATES ARE WINNING OR LOSING?
New South Wales Emissions reduction targets
New South Wales does not currently
have targets for reducing emissions or
expanding renewable energy.
The State Government had previously
set targets limiting greenhouse gas
emissions to:
›› 2000 levels by 2025.
›› 60 percent below 2000 levels by 2050
(NSW Greenhouse Office 2005).
New South Wales’ emissions targets were
removed in the process of drafting the
new State Plan NSW 2021 (ABC 2010,
NSW Government 2011).
Emissions
Renewable energy
New South Wales’ annual greenhouse
gas emissions are the largest of any The vast majority of NSW’s renewable
state or territory, at 148.9 MtCO2e and energy capacity is from old hydroelectric
New South Wales is responsible for over facilities such as the Snowy Hydro
a quarter, 27.4 percent of Australia’s Scheme (Figure 7). New South Wales
national emissions (Department of has the highest total installed renewable
Environment 2014 and ABS 2012). energy capacity (Clean Energy Council
2014). In 2013, NSW had 5,681 MW of
Greenhouse gas emissions in the state installed renewable energy. However,
are largely caused by the mining and only 599 MW of this total comes from
burning of fossil fuels, particularly coal. new large scale renewable energy
Emissions in New South Wales have capacity installed since 2001 – placing
been decreasing since around 2007. The New South Wales sixth lowest for
state’s 2012 emissions are 6.1 percent installed renewable capacity per
higher than 1990 levels (Department capita and last among the states
of Environment 2014 and ABS 2012). (Commonwealth of Australia 2014).
Per capita emissions in NSW were
20.43 tCO2e per person in 2012 (Table 13). NSW is home to Australia’s largest solar
thermal plant – the 9.3 MW Liddell facility,
a plant used to pre-heat feedwater for the
Liddell coal-fired power station.
Dubbo is NSW’s top solar postcode with
4,024 solar PV systems installed totaling
8.8 MW (Australian PV Institute 2014).
Page 28 Climatecouncil.org.auFigure 7: Snowy Hydro Scheme, New South Wales
Box 4 – NSW was a world leader in emissions trading
In 2003, New South Wales led the world by introducing the first mandatory
greenhouse gas trading scheme – the Greenhouse Gas Reduction Scheme.
Under the Greenhouse Gas Reduction Scheme, mandatory emissions
abatement targets were set and abatement certificates were available for
activities such as renewable electricity generation, carbon sequestration,
demand reductions or large user abatement.
After operating for nearly a decade, the trading scheme was closed in 2012
when the national Carbon Pricing Mechanism commenced operation. No new
carbon pricing initiatives have been proposed in New South Wales since the
Carbon Pricing Mechanism was revoked.
In 2003, New South Wales led the world
by introducing the first mandatory
greenhouse gas trading scheme – the
Greenhouse Gas Reduction Scheme
Renewable energy policy a “secure, reliable, affordable and clean
energy future for NSW”. Goals in the
In 2013, the NSW Government released
plan include:
the NSW Renewable Energy Action
Plan which outlines 24 actions and 3 1. Attracting renewable energy
goals designed to encourage renewable investment
energy in NSW and support the state to 2. Building community support
meet its share of the national RET. The
NSW Government’s stated vision is for 3. Attracting and growing renewable
energy expertise
Climatecouncil.org.au Page 29THE AUSTRALIAN RENEWABLE ENERGY RACE: WHICH STATES ARE WINNING OR LOSING?
The New South Wales Government has The $743,000 initiative of the South
appointed a Renewable Energy Advocate East Region of Renewable Energy
to support the plan and facilitate Excellence (SERREE ) – a partnership
renewable energy development in formed and funded by the NSW and ACT
the state. governments, Regional Development
Australia agencies and 20 large industry
Feed-in tariffs for rooftop solar in New
groups working in the region – was first
South Wales are currently set at 6.6 cents
conceived in mid-2011 to develop the
per kWh. This is the amount determined
region’s economy through renewables.
by the Independent Pricing and
In November 2014, this renewable energy
Regulatory Tribunal (IPART) as reflecting
industry cluster in the south east NSW-
the value of solar PV without subsidy and
ACT region received $305,000 from the
without increasing the price of electricity
Australian Renewable Energy Agency
in New South Wales (IPART 2013).
(RenewEconomy 2014e).
Table 13: New South Wales – key statistics
Statistic Total Percentage
Population 7.29 32
(million, % of Australian total)
Emissions 148.9 27.4
(MtCO2e, % of Australian total)
Per capita emissions 20.43 /
(tCO2e per person)
New large-scale renewable energy capacity since 2001 599 12
(July 2014) (MW, % of Australian total)
Installed renewable energy capacity (December 2013) 5681 36
(MW, % of Australian total)
Installed wind capacity (December 2013) 282 /
(MW)
Installed solar PV capacity (December 2013) 713 /
(MW)
Dwellings with solar PV / 11.8
(%)
Electricity generation from renewables (December 2013) 4554 7
(GWh, % of total generation for state/territory)
Renewable energy jobs 4410 21
(number, % of Australian total)
Note: New large-scale renewable energy capacity reflects additional projects commissioned since
December 2013, and does not include 209 MW of field scale PV currently under construction.
Sources: ABS 2012; Australian PV Institute 2014; Clean Energy Council 2014a,b and c;
Commonwealth of Australia 2014; Department of Environment 2014
Page 30 Climatecouncil.org.auYou can also read