Impact assessment of the " crédit d'impôt
←
→
Page content transcription
If your browser does not render page correctly, please read the page content below
November 2018

  Impact assessment of the « crédit d'impôt
    pour la transition énergétique (CITE) »

Silvano Domergue, Bruno Vermont, CGDD (office of the
Commissioner General for Sustainable Development)

   Evaluation carried out under the supervision of
               the Green OAT Evaluation Council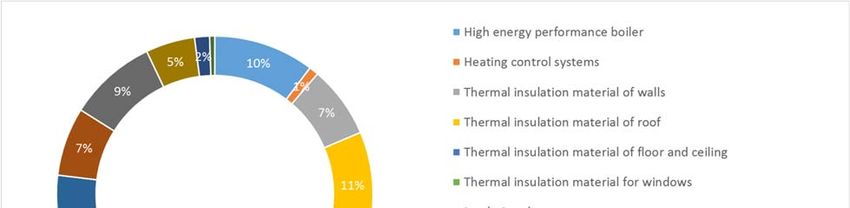
Impact assessment of the « crédit d'impôt pour la
              transition énergétique (CITE) »

                                Non-technical summary

Reminder on the history of the CITE
The French tax credit « Crédit d'Impôt pour la Transition Énergétique (CITE) » (Tax
credit for energy transition) is an income tax credit on housing energy efficiency
expenditures and renewable energy investments. Tenants and owners can claim a tax
credit only for their main home. Eligible equipment and materials must meet minimum
technical criteria regarding energy efficiency. Households receive a tax credit the year
after completion of the dwelling’s renovation. The CITE is the largest green eligible
expenditure in terms of budgetary cost, within the perimeter of green eligible expenditures
defined for the Green OAT.

Recent developments
Since the introduction of CITE in 2014, households can claim a single rate of 30% tax
credit on all eligible renovations. Eligible renovation expenditures are capped at 8,000
euros for a single person and 16,000 euros for a couple. The companies carrying out the
renovation works must comply with a label guaranteeing their qualification for energy
efficiency renovations called the RGE label. As a tax credit, the subsidy is thus perceived
the year after the work expenditures.
In 2016 and 2017, the budgetary cost of the CITE amounted to 1.7 billion euros per year
which is significantly higher than in 2013-2014 since subsidy rates were between 15 and
25% before September 2014. The expenditures (achieved in 2015 and 2016) mainly
concern insulation (73%). Replacement of heating systems and renewable energy
investments represent respectively 11% and 16%.

Evaluation method
There are no detailed micro data on the energy savings concerning the CITE renovation
operations, making it challenging to carry out an evaluation. Energy savings have to be
estimated. Thus the evaluation is based on the use of a simulation model, the Res-IRF
model developed by the “Centre International de Recherche sur l’Environnement et le
Développement” (CIRED) and we use micro ex-post data from surveys in order to get as
close as possible to the actual household behaviours. The model simulates the French
households’ retrofitting decisions and heating systems choices based on renovation costs
and an exogenous energy prices scenario. Its specificity is to try to estimate actual energy
consumptions, taking into account the so called “rebound effect”, i.e. the fact that while
improving the energy efficiency of their dwelling, households also improve their thermal
comfort and consume more than theoretically expected. Therefore, the energy savings
due to the renovation works are not overestimated. They are more probably under-
estimated, due to the omission of some positive effects that are not captured by the model
(for instance, additional energy savings are not taken into account when the energy

                                                                                          2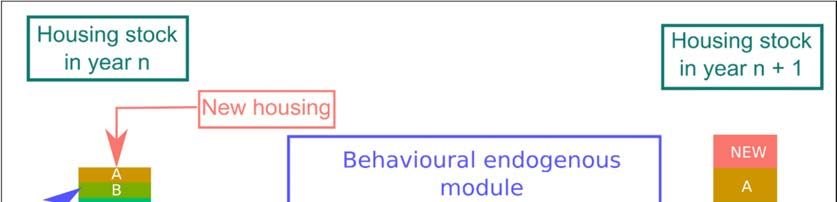
efficiency rating1 of the dwelling does not change). Also, some important impacts are not
considered by the method used, such as joint reduction of air pollution or other
externalities, or national capacity-building for the supply of energy efficient solutions and
awareness of the public on energy savings.
The model is calibrated on the French housing stock and its heating energy consumption
in 2012. The output includes the heating energy consumption and greenhouse gas
emissions of French dwellings between 2012 and 2050.
The model allows us to simulate the impact of public policies on the energy efficiency of
French dwellings by integrating the effect of these policies on households’ choices through
reducing renovation costs (subsidies, loans with reduced interest rate...) and increasing
energy prices (carbon tax). It also integrates the effect of thermal regulations on the new
housing stock.
To assess the effect of the CITE on energy efficiency investment, heating consumption
and GHG emissions, we compare a simulation without the CITE and a simulation with the
CITE during years 2015 and 2016, all other things being equal (it is assumed that other
policies stayed in place). Since benefits from renovation are grasped during many years
after the works, we assess the effects of the CITE over the whole period 2015-2050 for
both scenarios.
Main results
Relevance and effectiveness of the CITE
The CITE presents a high level of relevance with respect to the French
government’s objectives.
The CITE reduces energy consumption and CO2 emissions respectively by about
0.9 TWh and 0.12 MtCO2 per year in 2015 and 2016. This corresponds to 0.3% of
the heating energy consumption and 0.3% of the CO2 emissions of the housing
sector in 2015 and 2016.
These effects last for many years: over the 2015-2050 period, 2.9 MtCO2 and 43
TWh of energy consumption are avoided. The cumulative gain of CO2 emissions
over 2015-2050 triggered by additional 2015 investments corresponds to 7% of the
2015 level of CO2 emissions of the housing sector. Collective gains concerning
pollution externalities represent around 200 €/tCO2, which, if deducted from CO2
abatement cost, lead to a lower abatement cost of 40 €/tCO2.
Cost distribution analysis
The budgetary cost for the CITE is 1.7 billion euros per year for 2015 and 2016.
Second round effects of the CITE on the budget of other policies and taxes have
been neglected.
The cost for households is an additional investment of 3.4 billion euros in 2015-
2016. It enables long run energy bill savings that almost cover the additional cost.
Thanks to the tax credit, investment in energy efficiency is highly profitable for
1 Dwellings
are rated in « energy classes », from A to G, according to their energy efficiency
performance. Energy efficiency improvements can lead to a change in energy class, but
improvements can also occur within the same energy class.
3
households. It allows them to save 2.2 billion euros over the 2015-2050 period.
Additional effect of the CITE
The CITE triggers around 75,000 additional renovations (defined as the shift from
an energy efficiency class to another) per year in 2015 and 2016 which represents
an increase of about 11% of the number of renovations performed.
The CITE triggers an additional amount of 1.7 billion euros of energy efficiency
investments per year in 2015 and 2016 which represents an increase of about 16%
of the amount of energy efficiency investment.
The renovation operations made with the CITE are more ambitious than those
made without the CITE.
The ratio between additional investments in energy efficiency compared to the
situation without the CITE and public expenditures related to the CITE budgetary
cost (leverage effect of the CITE scheme) is a little above 1 for 2015 and 2016.
The CITE improves the energy efficiency of the housing stock. The number of
dwellings with a low energy consumption (A or B) increases by 39,000 at the end
of 2016. The CITE incentive in 2015 and 2016 helps to keep the housing stock on
a more virtuous path since dwellings with a low energy consumption increase by
71,000 by the end of 2050.
The average heating consumption per m² of the housing stock is reduced by 0.6%
in 2050.
Economic efficiency of the CITE
We assess the economic efficiency of the CITE from a societal point of view by
calculating the ratio between net costs of the renovations (investment costs minus
energy bill savings) and social benefits (avoided emissions, energy savings). Long
run effects of the CITE over the 2015-2050 period have been taken into account.
Investments, energy savings and quantities of CO2 avoided are discounted at
4.5%. Furthermore, the households’ increased surplus due to their improved
thermal comfort, and related health effects, is not taken into account.
The abatement cost of CO2 avoided by the investments made in 2015 and 2016
is estimated at 240 euros per ton discounted over 2015-2050. This value is
subject to great sensitivity, varying from 0 to 500 €/tCO2 if investment costs vary
from -20% to +20%. Collective gains concerning pollution externalities represent
around 200 €/tCO2, which, if deducted from CO2 abatement cost, lead to a lower
abatement cost of 40 €/tCO2. This cost has to be compared to the social cost of
carbon trajectory over the same period. It seems reasonable with regards to recent
studies and discussions for the future national strategy for reducing GHG
emissions, which are likely to fix the social cost of carbon at least at around 250
euros per ton of CO2 in 2030.
The abatement cost per MWh saved by the investments made in 2015 and 2016
is estimated at 20 euros.
Sensitivity analysis
The sensitivity analysis shows that the most sensitive parameters in the model are
investment costs and the difference between theoretical (derived from labelling
4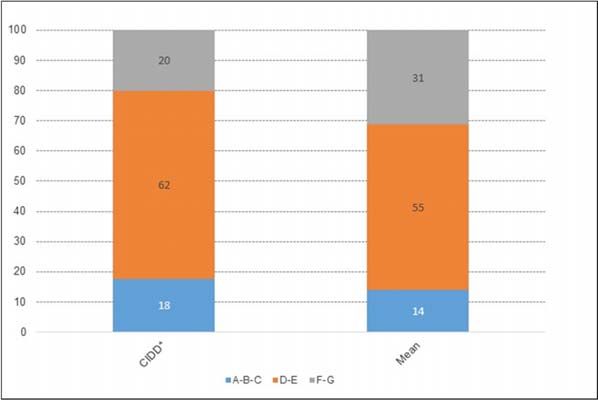
process) and realized energy savings.
For example, the CO2 abatement cost collapses down to negligible values (and
possibly turns negative) if investment costs decrease by 20%. On the contrary, it
would probably double if investment costs increase by 20%.
If we consider “theoretical energy savings” (derived from energy consumption
estimated by labelling process) rather than the refined estimate of “realized”
savings, savings are higher and the abatement cost of CO2 is very strongly
reduced.
The results are less sensitive to energy price scenarios and to the interactions with
other policies. CO2 content for electricity assumption is quite sensitive but not
decisive.
An ad hoc simplified approach provides an order of magnitude of air pollution
reduction and confirms that the social benefit associated is a first order issue. If
taken into account, the CO2 abatement cost would decrease significantly.
Caveat
The model is based on a lot of assumptions, most of which are informed by
observed data.
Results must be taken as order of magnitude.
Conservative approach: the model most probably under-estimates actual benefits
of the CITE and its efficiency.
5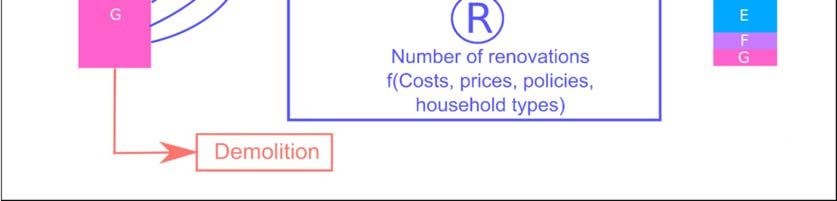
Table of contents

Impact assessment of the « crédit d'impôt pour la transition énergétique (CITE) ».......... 1
1.     Detailed description of the CITE ................................................................................. 7
1.1.         Households’ eligibility ........................................................................................... 7
1.2.         Eligible equipment ................................................................................................ 7
2. Relevance of the CITE with respect to the French government’s objectives
regarding energy efficiency and greenhouse gas emissions ........................................... 10
3.     Discussion about data and the necessity to use a model ........................................ 11
4.     Description of the model and evaluation method...................................................... 13
4.1.         General description ............................................................................................ 13
4.2.         Initial building stock energy performance description ....................................... 14
4.3.         Actual energy consumption calculation and calibration .................................... 16
4.4.         Renovation cost assumption .............................................................................. 17
4.5.         Renovation decision modelling and calibration ................................................. 18
4.6.         CITE calibration .................................................................................................. 19
4.7.         Other assumptions ............................................................................................. 20
4.8.         Evaluation method ............................................................................................. 21
5.     Detailed results .......................................................................................................... 21
5.1.         Relevance and effectiveness of the CITE ......................................................... 22
5.2.         Cost distribution analysis ................................................................................... 23
5.3.         Additional effect of the CITE .............................................................................. 25
5.4.         Economic efficiency of the CITE ........................................................................ 30
5.5.         Sensitivity analysis ............................................................................................. 31
6.     Permanent CITE scenario ......................................................................................... 35
7.     Bibliography ............................................................................................................... 44
8.     Evaluation team and work process ........................................................................... 44
8.1.         Evaluation team competencies and independence ........................................... 44
8.2.         Observation of the referees and answers given ................................................ 45

                                                                                                                                    6
1. Detailed description of the CITE
The « Crédit d'Impôt pour la Transition Énergétique (CITE) » is an income tax credit on
housing energy efficiency expenditures and on some renewable energy investments. The
CITE was designed to support the government’s objectives regarding energy efficiency
and greenhouse gas emissions. Since September 2014, the CITE replaced a previous tax
credit called « tax credit for sustainable development (crédit d'impôt développement
durable - CIDD) » created in 2005.
The CITE is the largest green eligible expenditure in terms of budgetary cost, within the
perimeter of green eligible expenditures defined for the Green OAT.
1.1. Households’ eligibility
Tenants and owners can claim a tax credit only for their main home (i.e. not for their
second home). The dwelling must have been built for more than 2 years.
Households receive the tax credit the year after completion of the dwelling’s renovation.
The tax credit is deducted from the amount of their income tax for the year after the
renovation work. If they don’t pay any income tax, households can get a refund on these
expenditures.
Households have to keep proof of the expenditures paid, as the tax authorities may
request them (invoice from the company that supplied the materials / equipment and
carried out the work).
1.2. Eligible equipment
Eligible equipment and materials must meet minimum technical criteria regarding energy
efficiency. The list of eligible equipment is described in the following table.
The companies carrying out the renovation works must comply with a label guaranteeing
their qualification for energy efficiency renovations called the RGE label. The companies’
staff has to undergo training in order to obtain the RGE label.
The minimum standards are set in absolute level, not in comparison with an average level
of efficiency. They are far more ambitious than the average efficiency of materials sold in
the market. Physical criteria are used to define eligible materials. For example, concerning
insulation works, minimum level for thermal resistance factors are required.Those
standards have been evolving over time, and are more and more stringent.
7Table 1: Eligible expenditures in 20172
Renovation type Eligible equipment
High energy performance boiler
Replacement of heating systems and
Natural gas micro-CHP boiler
heating control systems
heating control systems
Thermal insulation material of walls (floor, ceiling, wall,
roof)
Thermal insulation material for glazed walls (windows,
Insulation French windows, etc.)
Entrance door to the outside
Thermal insulation material
Heating or hot water production equipment (solar or
hydraulic energy)
Renewable energy production equipment Electricity supply system (hydropower or biomass)
Heat pump, other than air / air, whose main purpose is
the production of heat or hot water
Equipment for connection to an urban heat network
Energy performance diagnosis (a single diagnosis per
5-year period for the same dwelling)
Other expenditures
Charging station for electric vehicles
Individual meter for heating and hot water
2Refer to the decree
https://www.legifrance.gouv.fr/affichCodeArticle.do?idArticle=LEGIARTI000023374187&cidTexte
=LEGITEXT000006069576 (in French) for a detailed description of minimum standards for
eligible equipment and materials
81.3. Tax credit rate
In 2016 and 2017, the tax credit rate is set at 30% of the amount of material expenditure.
Labor is excluded from the base used for the calculation of the credit amount. Eligible
renovation expenditures are capped at 16,000 euros for a couple, 8,000 euros for a single
person plus 400 euros per dependent.
Budgetary cost and households’ expenditures in 2016-2017
In 2016 and 2017, the budgetary cost of the CITE amounted to 1.68 and 1.69 billion euros
for 1.5 and 1.66 million of beneficiaries. Due to its longevity and its high rate level, the use
of the tax credit for renovation works is widespread3.
The households’ expenditures for 2016-2017 mainly concern insulation (73%).
Replacement of heating systems and renewable energy investments represent
respectively 11% and 16%. Within thermal insulation, replacement of windows accounted
for a large part, which represent 4.7 billion euros of expenditures (1.4 billion euros of tax
credit), i.e. 52% of the expenditures for insulation and 38% of total eligible expenditures.
Figure 1: Distribution of households’s expenditures in 2016-20174
3 From 2005 to 2014, a previous tax credit for energy efficiency renovations existed : the CIDD :
« Crédit d’impôt développement durable »
4 Source : https://www.impots.gouv.fr/portail/statistiques
92. Relevance of the CITE with respect to the French government’s objectives
regarding energy efficiency and greenhouse gas emissions
The energy consumption of the French housing sector (484TWh) represents, in 2016, 30%
of the total energy consumption. Despite an ambitious energy efficiency policy,
consumption has been hardly stabilized over the past years. The building sector is the
most energy-intensive sector. With regards to GHG emissions, the building sector
accounts for one quarter of national emissions in 2015. A major effort will have to be made
to achieve the long-term objectives that France has set in terms of energy consumption
and reduction of GHG emissions.
In 2015, France passed the energy transition and green growth law (loi relative à la
transition énergétique pour la croissance verte (LTECV)), which is now the main legislation
governing energy efficiency. It sets a number of environmental, economic and social
objectives at the national and sectoral levels:
1. Decrease of final energy consumption by 20% by 2030 and 50% by 2050 compared to
2012. This objective is formulated at the national level (not declined by sector).
2. Decrease of GHG emissions by 40% by 2030 compared to 1990 (not declined by
sector).
3. Renovation of 500,000 homes per year from 2017 onward.
4. Fade out of the most energy-intensive housing by 2025 (buildings with consumption of
more than 330 KWh/m² per year).
5. Renovation of the entire housing stock at the "low energy consumption building" level
by 2050 - a requirement interpreted here as a minimum performance equal to the B label
of the Energy Performance Diagnosis (EPD).
6. A 15% reduction in energy poverty by 2020.
France also set targets for reducing GHG emissions as part of a national strategy called
“Stratégie Nationale Bas Carbone (SNBC)” provided by the LTECV. The first SNBC
decree sets a target of 27% emission reductions by 2028 (compared to 2013) for all
sectors (among which the building sector is set an indicative objective of 54% reduction)
and -75% by 2050 (in comparison with 1990).
France has recently reinforced this objectives with the “Plan Climat” in 2017 which:
‐ targets carbon neutrality for the whole economy in 2050;
‐ defines four key policies to reduce energy consumptions with a focus on reducing
the impacts of the building sector (3 of the 4 priorities are directly targeting the
building sector).
The CITE is one these four policies and the Plan Climat plans to extend it until 2019. It is
one of the main incentives for households to improve the energy efficiency of their homes
and to increase the number of energy efficient renovations in France which is still below
the 500,000 homes per year.
The building sector is identified in the policy objectives as a main contributor to the
reduction of GHG emissions and the promotion of energy efficiency. Due to low
building stock renewal rate, energy retrofitting is a huge stake. Housing accounts
for two third of the building sector. Therefore, the CITE presents a high level of
relevance with respect to the French government’s objectives.
103. Discussion about data and the necessity to use a model
The only observed data available on the renovations carried out with the CITE is the total
household expenditure in eligible renovations by type of renovation. These expenditure
data are aggregated at the national level and they do not allow us to make a direct detailed
computation of the energy savings obtained from the renovations. Indeed, these
renovations have been carried out on a large variety of dwellings and the gain related to
a renovation depends on the energy performance and the state of the housing before the
renovation.
Individual data including household expenditures and housing characteristics, such as
date of construction, surface area, type of dwelling could help refine the analysis by better
approximating the energy gain generated by a renovation. Nevertheless, without
information on energy consumption before and after the completion of the work, the
estimation of the energy gains would remain very approximate. No database currently
regroups all this information in France.
The second data source worth being mentioned (and that is used to calibrate the model),
the Phébus survey, gives the state of the housing stock in 2012 and the energy
consumption per dwelling on a sample of 2389 dwellings. These data also indicate
whether the household received or not a tax credit to carry out a renovation during the five
years preceding 2012. The Phébus data however remain insufficient to carry out an ex-
post assessment of the impacts of the CITE because they do not provide the energy
consumption before the renovation. In addition, the survey concerns 2012 and therefore
the CIDD5, the tax credit that preceded the CITE. This tax credit had a different subsidy
rate and the eligibility criteria were different from those of the CITE. Finally, the survey
only gives the total expenditure for the works carried out on the dwelling during the 5 years
preceding 2012. This amount includes all dwelling improvement works, not only those
which have an impact on energy efficiency. It is therefore difficult to identify the household
expenditure on energy efficient renovations. Nevertheless, the study "Les ménages et la
consommation d’énergie" (CGDD, 2017) uses this survey and shows that housings that
benefited from the CIDD have a better energy performance (after renovation) than the
average (see figure 2).
In France, energy performance of dwellings is rated from A to G according to their
energy consumption per m² for heating, hot water and air conditioning.
To evaluate the impact of the CITE on energy consumption and GHG emissions, we
therefore have to use an alternative approach which uses a model to convert renovation
expenditures in energy savings. The specificity of the model used is to include a
behavioural module that simulates renovation decisions made by households, given
economical parameters such as energy prices and taxes, renovation costs and support
schemes. This model does not represent every renovation gesture eligible for the CITE. It
is based on a more macro view on energy renovation gestures (corresponding to the shift
from an energy efficiency class to another). It is therefore not possible to use the model to
provide gesture specific analysis (example: evaluate if one gesture is more profitable in
terms of energy gain per euro invested).
5 CIDD : « Crédit d’impôt développement durable »
11Figure 2: Distribution (in%) of energy performance classes for dwellings that
benefited from the CIDD (left) and for all dwellings (right).
Source : SOeS, Phébus survey
However, the model is calibrated so that the budget cost of the CITE and global energy
consumption observed in the past are correctly re-simulated. Moreover, the model
integrates dynamic building stock description and is able to estimate the impacts of
policies in the long run (2050) and thus to give a more comprehensive vision of these
impacts. These aspect is crucial because benefits of renovation are properly evaluated
only in the long run.
The side-benefit of this approach is that:
‐ the model enables to identify and to assess the “additional” effect of the CITE
scheme (“what would have been done without the scheme”);
‐ it takes into account the long run effects of policies;
‐ it makes it possible to simulate “forward looking” scenarios, for example what
would be the impact of the CITE if it is maintained after 2016. Such a scenario is
assessed and the results are presented in Appendix.
The lack of data on energy savings concerning the CITE eligible expenditures
makes the evaluation challenging to carry out. Energy savings have to be
estimated. Therefore, the evaluation is based on a simulation model. The model
relies on a simplified description of renovation gestures, but is calibrated using
several statistical data, including energy consumption and CITE budgetary costs
observed in the past. Its dynamic description of the building stock allows the
integration of future benefits of renovation, to evaluate the additional effect of the
CITE and to evaluate more prospective scenarios.
124. Description of the model and evaluation method
This section describes the general framework model. While we detail the heart of the
model and its key assumptions, we do not provide a fully detailed description of the model.
For a more precise description, please refer to the report by the CIRED [Bourgeois and
Giraudet, 2018, forthcoming].
The Res-IRF model, version 3.0, developed by the CIRED enables to simulate the impacts
of public policies on the evolution of the heating consumption and the GHG emissions of
the housing stock in France. Since 2010, it is also used by the French Ministry for an
Ecological and Solidary Transition to evaluate various environmental measures on the
housing stock6.
The model enables to simulate the following policy measures:
‐ the CITE;
‐ Carbon tax on energy;
‐ CEE (certificat d’économie d’énergie – certificate of energy savings) which is a
scheme where energy suppliers are obliged to achieve energy savings for their
customers;
‐ low VAT rate on energy efficiency renovations.
4.1. General description
The dwelling energy efficiency is characterised by a label: there are 7 different energy
classes, from A – most efficient – to G, see table 2). Each class is defined by a range of
“theoretical consumption”, i.e. the theoretical consumption of the dwelling according to its
physical characteristics (insulation, heating system, etc.). Today there are very few A or B
housings, most of them are D and E (see below). From this initial state, the model
simulates the French household’s retrofitting decisions and heating systems choices.
When a dwelling is renovated, its energy class changes.
The investment decisions are made on the basis of the comparison of the total cost of
each choice. Their number and intensity are determined endogenously by the model. The
renovation module constitutes the heart of the model (new construction and demolition
are exogenous). The model calculates each year the number of class changes for each
segment of the housing stock. The level of investment in energy efficiency renovations
depends on the energy prices and the public policies that are activated in the simulation.
Based on the building energy performance, the model then determines real energy
consumption, taking into account the “rebound effect” which reflects the discrepancy
between the theoretical consumption and the real one.
The output of the model gives the heating energy consumption and the greenhouse gas
emissions of the French dwellings between 2012 and 2050 as well as investments in
energy efficiency renovations.
As shown in figure 3, the behavioural module allows us to follow the evolution of the
housing stock energy performance year-by-year and in the long run until 2050. It
calculates each year the number of renovations for each class (which is a function of
investment costs, energy prices, policies and households’ characteristics) and the new
6 See for example : CIRED, CGDD ; « Evaluation des mesures du Grenelle de l’Environnement
sur le parc de logements » ; Etudes et Documents, 2011
13state of the housing stock in the following year.
Figure 3: Housing stock dynamics in the Res-IRF model
4.2. Initial building stock energy performance description
In the model, the initial state of the housing stock in 2012 is given by a French survey
called “Performance de l’Habitat, Équipements, Besoins et Usages de l’énergie
(Phébus) ». This survey gives the housing stock by dwelling type (apartment / house),
main heating energy (electricity, gas, fuel oil, wood), energy efficiency (7 energy
performance classes7) and also gives information on households incomes. The model has
recently been upgraded to represent 5 types of households based on their income
(5 income quintiles). The figure 4 shows the initial distribution of energy performance
classes in the model.
The Phébus survey provides information on the energy class (A to G). It also gives more
precise information by giving the theoretical consumption in KWh/m2 of dwellings. This
information enables to determine the average theoretical consumption in each energy
class (see table 2).
7In France, energy performance of dwellings is rated from A to G according to their energy
consumption per m² for heating, hot water and air conditioning.
14Figure 4: Housing stock energy performance in 2012
Source: Enquête Phébus, Res-IRF model
Table 2: Heating energy consumption (theoretical) by energy performance class in
the model
Energy performance Heating energy
class consumption
(KWh /m²/an)
EP
G 507
F 321
E 216
D 141
C 90
B 59
A 45
Source: Enquête Phébus, Res-IRF model
154.3. Actual energy consumption calculation and calibration
Theoretical consumption is just an assessment of the theoretical energy performance of
the building. When we look at public statistics on theoretical consumption of dwellings and
actual consumption recorded on household bills, we observe a significant difference. This
difference can come from various factors. For example the accuracy of the labelling
process can questioned. Another reason, probably more important, is the so called
“rebound effect” that appears after renovation. While improving the energy efficiency of
their dwelling, households choose to use a part of the gain on the energy bill to improve
their thermal comfort. On one hand, the rebound effect has negative impact on future
benefits expected from housing renovation, because the expected energy savings and
CO2 emissions reduction are reduced. On the other hand, the rebound effect stems from
household surplus maximization. This behaviour brings them additional surplus that has
not been evaluated here.
The model integrates a function which allows to pass from the theoretical consumption of
the dwelling (as given by its energy class) to the actual consumption of the household.
The relationship between the theoretical and the actual energy consumption of the
household used in the model was established by French studies from “EDF R&D »8. It
links the actual and theoretical consumptions as follows:
E I =− 0.191 * l n( B S )+11.05
CA
E I=
CT
p * CT * S
B S= e
I
where EI is the energy use intensity i.e. the ratio between the actual energy consumption
per m² of the household (CA) and the theoretical energy consumption per m² given by the
energy class of the housing (CT). BS is the budget share of the theoretical energy
expenditures of the household (pe the energy price, S the surface of the housing and I the
household’s income).
Figure 4 presents the relationship between the budget share and the energy use intensity.
The marks for each energy performance from A to G are calculated for an average
household living in a dwelling of S = 85 m² with an income of I = 30,000 euros. We use an
energy price of 0.07 euros per KWh which is the average price of gas in France in 2015
for a household. Figure 5 shows that as energy efficient renovation are performed, the
household increases its energy use intensity which will reduce the impact of renovations
on its heating energy consumption.
8Allibe, B., 2015, "Du normatif au réaliste : amélioration de l’évaluation technico-économique du
bénéfice des rénovations énergétiques des logements", La Revue du CGDD, 37-46. Cayla, J.-M.,
D. Osso, 2013, "Does energy efficiency reduce inequalities? Impact of policies in Residential
sector on household budget", Proceedings of the ECEEE Summer Study.
16Figure 5: Relationship between the budget share of the theoretical energy expenses
and the energy use intensity
This relationship is applied to the theoretical consumption of the initial state of the housing
stock in
2012 which is differentiated in the model by energy performance class, heating energy,
dwelling type and household income. It gives the total actual heating consumption by
energy of the housing stock which is then calibrated at the national level on 2013 statistical
data from “Centre d'études et de recherches économiques sur l'énergie (CEREN)”. The
model does not represent the energy consumption of other uses like hot water or electricity
specific uses. However, heating consumption represents 2/3 of the energy consumption
of the housing sector in France (320 Twh in 2016).
In the end, the model enables to take into account real behaviours, not only energy
technical performance of renovation, to determine energy consumptions. It gives a realistic
and careful assessment of the benefits expected from building retrofit.
4.4. Renovation cost assumption
The renovation costs for each energy class changes are fixed according to the two
following principles:
i. The retrofit cost structure complies with the principle of increasing marginal cost.
Typically, the highest the energy class, the higher the cost (per KWh/year saved)
to reach it.
ii. The average investment cost obtained by the model is calibrated so that it is in line
with the results of the French survey called “Observatoire permanent de
l'amélioration énergétique du logement (OPEN)” which gives detailed information
about renovation costs and energy savings in France over the 2012-2014 period.
Therefore, average investment cost obtained by the model for year 2012 is 112
euros per m² which is close to the average renovation cost of 110 euros per m²
reported in the OPEN survey.
Investments costs used in the model are presented in table 3. It indicates for example that
17the cost to retrofit a dwelling from class F to class B Is 286 euros per m². Each class jump
in this table correspond to one or several renovation gestures that are not directly identified
in the model. This report will therefore not provide gesture specific analysis.
Table 3: Investment costs matrix in the model
F E D C B A
G 76 136 200 270 350 441
F 0 63 130 203 286 381
E 0 0 70 146 232 330
D 0 0 0 79 168 270
C 0 0 0 0 93 198
B 0 0 0 0 0 110
This table reports the amount (in euros per m²) a household needs to invest to change the
energy performance class of his dwelling from the class in the first column to the class in
the first line of the table.
The model integrates a representation of technical progress by reducing renovation costs
as the housing stock is renovated. The idea is that costs are reduced over time through
imitation and learning. In the model, investment costs decrease exponentially with the
cumulative amount of renovations so as to simulate a "learning-by-doing" process. The
cost reduction rate for a doubling of renovations is set at 10%.
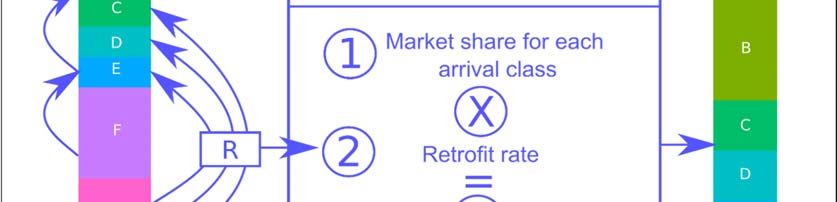
4.5. Renovation decision modelling and calibration
The heart of the model is constituted by a behavioural module that calculates the number
of dwellings that will be retrofitted. To do so, two functions are used:
(1) A function that calculates the market share of each energy efficiency class
improvement
A building retrofit is achieved when the energy efficiency class of the dwelling is improved.
The market share of the gesture “renovating from the class i to the class f”, is given by the
following equation:
where CCV is the levelized total cost for each operation, and v a heterogeneity parameter
that represent the variety of choices.
(2) A retrofit rate function
For each class of energy efficiency, the average cost to renovate to upper classes is
calculated with the previous function. Then, a logistic function defines the renovation rate
18of this class.
These two functions are calibrated9 for year 2012 to fit with the observed figures when
available, or with assumptions if not. In particular for the retrofit rate, data from OPEN
survey and USH10 are used. Renovation costs and energy prices used in the calibration
integrates major public policies that existed in 2012. Indeed, public policies and fiscal
incentives (tax credit, subsidies, carbon tax...) have an impact on the levelized total cost
for each operation, influencing either the investment cost (which is the case for the CITE)
or the energy bill savings (e.g. carbon tax). Therefore, they induce changes in renovation
decisions (see below for the CITE).
4.6. CITE calibration
Concerning the CITE, it applies only on eligible equipment cost, not the total investment
cost mentioned above. Thus, the CITE rate to be implemented in the model cannot be the
real one. It must be calibrated in the model to reproduce as precisely as possible the
observed budgetary cost of the CITE in public statistics.
In 2012, the subsidy rate for the CITE applied in the calibration is 7%. It is the rate for
which the model simulates a total cost of 700 million euros for the tax credit which was the
amount of tax credit11 delivered in 2012 (Source: DGEC). In the same way, from 2013 to
2016, the CITE is calibrated in the model to reproduce as precisely as possible the
observed budgetary cost of the CITE in public statistics.
In 2015 and 2016, the years where we assess the effects of the CITE, the subsidy rate in
the model is fixed to 18%. It is lower than 30% because it takes into account the subsidy
cap and the fact that the subsidy does not cover all expenditures, particularly labor costs.
In 2015, the model simulates a total cost of 1.65 billion euros for the CITE which
corresponds to the current observed budgetary cost of the CITE.
Table 4: Observed and simulated budgetary cost for the CITE
Renovation year (model
2012 2013 2014 2015 2016
year)
Observed public
2013 2014 2015 2016 2017
budgetary cost year
Observed public
budgetary cost (billion 0.7 0.7 0.9 1.7 1.7
euros)
Simulated CITE cost
0.7 0.7 0.8 1.7 1.7
(billion euros)
9 Inthe model, calibration is achieved thanks to an additional investment component added to
total cost corresponding to “unobserved costs” for renovation.
10 Union sociale pour l'habitat (USH) are used to calibrate social housing retrofit rate
11 From 2005 to 2014, a tax credit on renovation works, the CIDD, already existed.
194.7. Other assumptions
We use energy price scenarios currently used in all French public policies assessments
(see table 5).
Table 5: Annual growth rate of energy prices (inclusive of all taxes but carbon tax,
constant euros 2015)
2015-20 2020-30 2030-50 Source
European Commission (EU reference
Gaz 0.84% 4.28% 1.59% scenario 2016)
European Commission (EU reference
Oil 9.96% 4.47% 1.40% scenario 2016)
Electricity 1.10% 1.10% 1.10% DGEC (Scenario AME 2017)
Wood 1.20% 1.20% 1.20% DGEC (Scenario AME 2017)
The prices include the following taxes: CSPE on electricity, TICGN on natural gas, TICPE
on oil. The carbon tax, when activated, is added to energy prices, accordingly to their CO2
content.
Figure 6: Energy prices evolution by heating energy (all taxes included)
To convert energy consumptions in GHG emissions, we use fixed CO2 contents per
energy (see table 6).
20Table 6: CO2 content per energy used to calculate emissions (Source: ADEME)
g of CO2 per KWh
Natural gas 206
Oil 271
Electricity 120
Wood 0
4.8. Evaluation method
In order to study the impact of the CITE on the energy performance of the housing stock,
two scenarios have to be compared:
◦ A "counterfactual or CF" scenario where no CITE is activated in the model
from 2015 onward. All other policies are maintained12.
◦ A test scenario “CF + CI2years” where the CITE is activated in 2015 and 2016
and stopped afterwards. All other policies are maintained.
It is important to note that the effects of the CITE last beyond the years of implementations
of the scheme. Indeed, the benefits from more energy efficient buildings have to be
considered over several decades in terms of energy consumption and CO2 emission
reductions. Moreover, due to a larger number of renovations during those two years (in
the example of the “spot CITE” scenario), the building stock is modified, influencing the
future renovation decision (while marginally). In comparison with the counter-factual
scenario, this renovation acceleration during two years could be followed, when the
support scheme is removed, by a period with a lower renovation rate and less investments
in renovation works.
Table 7: scenario description
2015 2016 2017 2018 ... 2050
CF CITE no no no no no no no
Other policies yes yes yes yes yes yes yes
CF+CI2years CITE yes yes no no no no no
Other policies yes yes yes yes yes yes yes
5. Detailed results
12 The underlying objective here is to make an assessment « all other things being equal ». The
effect of CITE is thus entangled with the effect of other policies which cover the same renovation
works. One may also estimate the impact of CITE by comparing a baseline scenario with no other
policies (“no policy” scenario) to a situation with no policy except the CITE (“no policy +CI”
scenario). Comparing the “no policy” and “no policy + CI” scenarios would therefore give an
approximation most likely an upper value for the effects of CITE without interactions with other
existing policies. Sensitivity tests using this alternative method are included in V.
21This part addresses item by item the requirements listed in the terms of references (ToR).
The indicators suggested by the ToR (part 3) are displayed in each 5 chapters mentioned
in part 2 and addressed here. The chapters’ order has been slightly changed for better
understanding (the “cost distribution effect of the CITE” is tackled in second position
instead of last one, since it is an input to figure out the leverage effect addressed in “the
additional effect of the CITE” chapter). The subsections are organized as follows:
‐ Relevance and effectiveness of the CITE
‐ Cost distribution analysis
‐ Additional effect of the CITE
‐ Economic efficiency of the CITE
‐ Sensitivity analysis
5.1. Relevance and effectiveness of the CITE
The CITE reduces energy consumption and CO2 emissions respectively by about 0.9 TWh
and 0.12 MtCO2 per year in 2015 and 2016. These effects last for several years: over the
2015-2050 period, 2.9 MtCO2 and 43 TWh of energy consumption are avoided when the
CITE is removed in 2017. The cumulative gain of CO2 emissions over 2015-2050 triggered
by additional 2015 investments corresponds to 7% of the 2015 level of CO2 emissions of
the housing sector.
Impact on energy consumption and annual CO2 emissions
We first compare the heating energy consumption and CO2 emissions of the scenarios
“CF” and “CF+CI2years” in table 8. This table reports the annual differences in the
consumption and emission level between the two scenarios.
The CITE reduces energy consumption and GHG emissions in comparison with the
scenario without the CITE. The annual gain in 2015 and 2016 is about 0.9 TWh and 0.12
MtCO2 per year. This corresponds to 0.3% of the heating energy consumption and 0.3%
of the CO2 emissions of the housing sector.
In the years following 2016, the CITE is no longer maintained in the “CF+CI2years”
scenario. Thus, the differences in the consumption and the emission levels between the
two scenarios is gradually reduced over time. This seems to indicate a lower renovation
rate and less investments in renovation works in the “CF+CI2years” scenario after 2016.
As energy prices rise, households spontaneously retrofit their dwellings in the scenario
“CF” and the consumption gap between the two scenarios is reduced. Nevertheless, in
2050, the energy consumption and emissions is still lower in the “CF+CI2years” scenario
where the CITE was maintained only in 2015 and 2016. This indicates that the CITE has
helped keeping the housing stock on a more virtuous path.
Furthermore, over the 2015-2050 period, the cumulative energy savings and GHG
emission reductions generated by the CITE amount to 43.1 TWh and 2.9 MtCO2.
22Table 8: Annual Differences in energy consumption and CO2 emissions between
the CF + CI2years scenario and the CF scenario
Total
2015-
2015 2016 2020 2030 2050 2050
Emissions -0.13 -0.24 -0.17 -0.08 -0.02 -2.90
(MtCO2)
Energy -0.89 -1.76 -1.59 -1.29 -0.80 -43.10
consumption
(Twh)
5.2. Cost distribution analysis
The model is calibrated to simulate a budgetary cost for the CITE of 1.7 billion euros per
year for 2015 and 2016. Effects of the CITE on the budget of other policies and taxes have
been neglected. The cost of the CITE for households is an additional investment of 3.4
billion euros in 2015-2016. It enables long run energy bill savings that almost cover the
additional cost. Thanks to the tax credit, the investment in energy efficiency is highly
profitable for the households. It allows them to save 2.2 billion euros over the 2015-2050
period.
5.2.1. Impact on the State finances
The direct cost for the State is the cost of the CITE. For 2015 and 2016, it is
straightforward as the model was calibrated to reproduce the observed cost of the
CITE in public statistics (around 1.7 billion euros in 2015 and 2017).
Beside the direct costs of the CITE, “second round effects” can impact the State finances.
The cost of other support schemes can be impacted. For example the CITE scheme
interacts with other measures, like the Eco-PTZ. Indeed both schemes are cumulative and
households who benefit the Eco-PTZ benefit the CITE too. Some of the additional
beneficiaries of the CITE will receive the Eco-PTZ. Therefore, the CITE has an impact on
the Eco-PTZ public cost. Rigorously, this effect should be taken into account to figure out
the total impact for the State finances. Given the modest amount of the Eco-PTZ budgetary
cost, this effect has been neglected.
More generally, the scheme has complex impacts on tax revenues. Energy tax revenue is
impacted since the energy consumption is impacted. Indeed, electricity, natural gas and
fuel are taxed at different levels. Moreover, for the two latter, the carbon tax applies. So,
every change in energy consumption modifies the amount of tax revenue. Besides, a raise
in building sector investment has a boosting effect in economic activity, and thus on VAT
revenue. So, tax revenue effects are numerous and can be negative or positive. These
revenue changes have also been neglected.
5.2.2. Impact on households: impact on investment in energy efficiency
23renovation, households’ energy bill and net cost
The CITE encourages households to invest in renovation works. In return, it allows them
to reduce their energy consumption and their energy bill.
In 2015 and 2016, the CITE leads to additional investments of 1.7 billion euros per year
(table 9). This represents an increase of 16% of total investments in renovation in 2016.
The energy bill of the households is reduced by 0.06 billion euros per year in 2015 and
2016.
The period after 2016 is characterized by a lower investment level in the scenario “CF +
CI2years” than in the “CF” scenario which explains why the annual differences are
negative after 2016 in table 9. This is due to the higher performance of the building stock
after two years of CITE with a high level of energy retrofit, which reduces the potential
number of highly profitable renovation remaining.
On the contrary, the energy bill savings last after 2016 and households still save 0.07
billion euros per year in 2050 due to the CITE.
Table 9: Annual impact on investment and energy bill savings between the CF +
CI2years scenario and the CF scenario
2015 2016 2020 2030 2050
Investments (G€) 1.71 1.69 -0.07 -0.07 -0.04
Energy bill 0.06 0.13 0.13 0.11 0.07
savings (G€)
In order to evaluate the impact of the tax credit on households over the period 2015-2050,
we calculate the cumulative additional investments in energy efficiency and the cumulative
energy savings. The households also receive the CITE tax credit for their renovation so
we have to include the cumulative CITE tax credit to calculate the net cost for households.
We use a discount rate of 7% (from the households’ point of view) those cumulative
values.
We also consider that the energy bill savings persist 10 years after 2050. We thus add 10
times the value of these gains in 2050 to the cumulative savings.
Table 10 shows the results of these calculations when the CITE is only maintained until
2016. The values correspond to the differences in investments, tax credit costs, energy
24bill savings and emissions between the CF+CI scenario and the CF scenario.
Table 10: Net cost for the households in the long run
CITE tax Energy bill
Investment credit savings, all taxes
s (billion (billion included (billion
euros) euros) euros)
Net cost without tax credit Net cost
(a) (b) (c) (a)-(c) (a)-(b)-(c)
« CF+CI2year 2.6 (1.6) 3.2 (3.3) 1.6 (3.5) 1.0 (-1.9) -2.2 (-5.2)
s»-CF
NB: Investments, CITE tax credit, energy bill savings are cumulative and discounted
at 7%. The non-discounted values appear in parentheses below the discounted
quantities.
Over the 2015-2050 period, the reduction in the energy bill allows the households to save
1.6 billion euros for a total additional investment of 2.6 billion euros. The net cost for
households without the CITE would therefore not be profitable without the CITE tax credit
that amounts to 3.2 billion euros for the 2015-2050 period. With the CITE tax credit, the
net cost for households is -2.2 billion euros.
5.3. Additional effect of the CITE
The CITE triggers around 75,000 additional renovations per year in 2015 and 2016 which
represents about 1.7 billion euros of energy efficiency investments per year.
Renovation operations are more ambitious with the CITE than those made without the
CITE.
The CITE improves the energy efficiency of the housing stock. Dwellings with a low energy
consumption (A or B) have increased by 39,000 at the end of 2016. The CITE incentive in
2015 and 2016 helps to keep the housing stock on a more virtuous path as dwellings with
a low energy consumption have increased by 71,000 at the end of 2050.
The average heating consumption per m² of the housing stock is reduced by 0.6% in 2050.
The ratio between additional investments in energy efficiency compared to the situation
without the CITE and public expenditures related to the CITE budgetary cost is a bit more
than 1 for 2015 and 2016.
This part focuses on various indicators to evaluate the additional effect of the CITE. This
is possible because the Res-IRF model has a behavioural module that allows us to
simulate the evolution of the housing stock with and without the CITE (counterfactual
scenario).
5.3.1 Number of beneficiaries and numbers of renovations with and without the
scheme
The CITE triggers more investment in renovation works and about 75,000 additional
renovations (understood as a jump from an energy class to another) per year of
implementation, which represents an increase of 11%.
25The period after 2016 is characterized by a slightly lower renovation rate in the “CF +
CI2years” scenario. This is due to the higher performance of the building stock after two
years with a higher retrofit rate, which reduces the potential number of highly profitable
renovation remaining. This explains why the number of renovations is higher in the “CF”
after 2016. Over the 2015-2050 period, the total number of additional renovations is
97,000.
Table 11: Additional number of renovations and investment between the CF +
CI2years scenario and the CF scenario
Total
2015-
2015 2016 2020 2030 2050 2050
Number of 75,000 76,000 -1,000 -2,000 -3,000 97,000
renovations
Investment 1.71 1.69 -0.07 -0.07 -0.04
(billion euros)
5.3.2. Level of performance of renovations with and without the scheme
It is interesting to determine the number of additional renovations but also whether
renovations are more ambitious with the CITE than those done without the CITE. We can
get an idea on the intensity of renovations in both situations by comparing the relative
increase of the number of renovations (11%) and the relative increase of investments
(16%) which is higher. In the model, the more ambitious the renovations are the more
costly they are. It implies that renovations are, in average, more ambitious with the
CITE than those done without the CITE.
5.3.3. “Leverage effect” of the CITE understood as additional private investment
per public euro invested
The ratio between additional investments in energy efficiency compared to the situation
without the CITE and public expenditures related to the CITE budgetary cost, ratio we will
call “leverage effect” of the CITE, is around 1 in 2015 and 2016. This is due the fact that
all the renovation works achieved in the scenario without the tax credit receive the tax
credit as the additional renovation work in the scenario with the tax credit.
Table 12: Additional investment per euro of tax credit, reference = CF scenario
scenario 2015 2016
CF+CI2years 1.04 1.02
The leverage effect for one year is calculated from one single scenario (the one with the
CITE) by comparing, for this year only, two different situations: with and without the CITE
(just this year).
Even if this leverage effect is around 1 or less than 1, this does not mean that the CITE
has no impact on renovation. Indeed, when the CITE is activated in the model, it has three
possible effects:
26 Some households that would not have renovated their homes choose to renovate
it. The leverage effect is far more than 1 for those households. On eligible
equipment, the leverage is 100/30, since the subsidy rate is 30% in the model. But
works may also include non-eligible equipment and labour cost, meaning that total
leverage is higher13.
Some households that would have renovated their homes without the CITE
perform a renovation more ambitious with the CITE than without it. For example,
some households can choose to renovate their home from energy class G to C
while they would have only change from G to D, without the CITE. They receive
the tax credit for the whole amount of the work they would have perform without
the CITE plus the tax credit for the additional investment. The leverage effect for
these households depends on the parameters in the model but is near 1.
Some households that would have renovated their homes without the CITE
perform the same renovation with the CITE. The leverage effect for these
households is zero here. In reality, the CITE may lead to additional benefits not
captured by the model: the fact that, to be eligible, works have to be made by
“RGE” firms, ensures a better quality of the renovation. Moreover, consumer
outreach may improve investment choices (without changing the energy class
reached) and provide incentives for energy savings.
The effect of the CITE on investments depends on the number of households in each of
these three categories. As far as it goes, the output of the simulation have not been
analysed to determine the proportion of the three categories of situation. But previous
results can give a clue on this issue: renovations number increases by 11%, meaning that
there is a significant part of households in the first category. We also know that average
performance of energy retrofit is better with the CITE. This means that there must be
households in the second category that would have done works even without the CITE
but less ambitious ones.
Phébus survey gives interesting insights on this subject. When households are asked if
the CIDD had an impact on their renovation work, 57% answer that they would have
performed the same renovation without the tax credit (table 13). The rest of the households
declares that they would have delayed the renovation, performed less ambitious works,
performed a renovation themselves without using a labeled professional or performed no
work at all.
13 In the model, the subsidy rate is 18% to take into account the fact that works cost not only
includes eligible equipments (see Description of the model part). On this basis, we have a 100/18
leverage effect.
27You can also read