Renewable energy in Austria: Modeling possible - IIOA!
←
→
Page content transcription
If your browser does not render page correctly, please read the page content below
I nternational
                                                                       I nput
                                                                       O utput
                                                                       M eeting on
                                                                       M anaging the
                            Input - Output & Environment               E nvironment

                                    SEVILLE (SPAIN)
                                    July 9 - 11, 2008
                                http://www.upo.es/econ/IIOMME08

                Renewable energy in Austria: Modeling possible
                     development trends until 2020

    Stocker, Andrea a*; Großmann, Anett b; Madlener, Reinhard c; Wolter, Marc Ingo d
    a
        SERI – Sustainable Europe Research Institute, Garnisongasse 7/27, A-1090 Vienna
        Phone: +43 (1) 9690728-18. Fax: +43 (1) 9690728-17. E-mail: andrea@seri.at
        b,d
          Institute of Economic Structures Research, Heinrichstr. 30, D-49080 Osnabrück
        Phone: +49 (541) 40933-18. Fax: +49 (541) 40933-11        Email: info@gws-os.de
c
    Institute for Future Energy Consumer Needs and Behavior (FCN), Faculty of Business
          and Economics / E.ON Energy Research Center, RWTH Aachen University
                         Templergraben 55, 52056 Aachen, Germany
                     Phone: +49-241-80 97 162 Fax: +49-241-80 92 206
                          Email: rmadlener@eonerc.rwth-aachen.de

*Corresponding author

Abstract
This paper reports on the recently completed Austrian research project “Renewable
energy in Austria: Modeling possible development trends until 2020”. The project
investigated possible economic, social and ecological effects of a substantially increased
use of renewable energy sources in Austria. Together with stakeholders and experts,
three different scenarios were defined, specifying possible development trends of
renewable energy in Austria. The scenarios were simulated for the period 2006 - 2020,
using the newly developed integrated environment–energy–economy model “e3.at”.
The model is parameterized econometrically, and integrates an input-output model with
an energy and a material model.
This paper introduces the model “e3.at” and describes the development and the
simulation outcomes of the three scenarios. The modeling results indicate that
increasing the share of renewable energy sources in total energy use is an important but
not sufficient way towards a sustainable energy system in Austria. A substantial
increase in energy efficiency and a reduction of residential energy consumption also
form important cornerstones of a sustainable energy policy.
Keywords: renewable energy, macro-econometric modeling, input-output model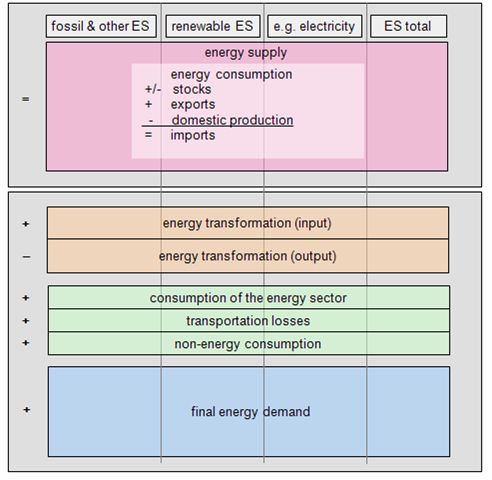
2                                Stocker, A., Großmann, A., Madlener, R., Wolter, M.I.

1   Introduction
Renewable energy plays an important role in Austria for reducing the dependency on
imported fossil fuels and to support the reduction of greenhouse gases. This role will
grow within the next years due to the fact that the current share of renewables of about
20% of the whole energy mix has to increase to 34% by 2020 in order to fulfill EU
targets. In this respect, it is important to estimate and quantify the effects of an
intensified use of renewable energy for the supply of heat and power on the
environment, economy and society.

         The project “Renewable energy in Austria: Modeling possible development
trends until 2020” (Stocker et al., 2008) investigated potential economic, employment
and environmental effects of an increasing use of renewable energy resources for heat
and power generation for the case of Austria. More specifically, the integrated
environment-energy-economy model “e3.at” was used to simulate different renewable
energy technology (RET) scenarios with a focus on renewable energy use in Austria
until 2020.

         In order to analyze the research questions posed, the project comprised two
main blocks: the development of the simulation model “e3.at” which integrates energy,
economic and environmental aspects in one single and consistent modeling framework,
and its application within a participatory scenario modeling process. After the creation
of the simulation model and the development of the scenarios, the scenarios had to be
implemented into the model. The outcome of the scenario simulation is a quantitative
estimation of the effects of the diffusion of different renewable energies and related
technologies.

         The process of scenario modeling (from the development of scenarios to the
dissemination of the modeling results) integrates participative elements. A stakeholder
and expert group of 30 people was formed, actively accompanying the project by means
of bilateral discussions and participation in workshops. In total, four workshops were
held with the objective of presenting and discussing the set-up and functioning of the
simulation model and to elaborate the scenarios. Thanks to these discussions, valuable
inputs and helpful suggestions were received and considered in the project work. Thus,
the research results are not only built upon the work of researchers, but also integrate
knowledge, expertise and preferences of stakeholders.

         The paper introduces the integrated model “e3.at” (chapter 2) and describes the
scenarios (chapter 3). Based on the simulation results (chapter 4) we derive some
conclusions in chapter 5.

2   The Integrated Environment – Energy – Economy Model „e3.at”
In this chapter we will briefly introduce the integrated environment – energy – economy
model e3.at (for a detailed description see Großmann et al., 2008) which was used
within the project to analyze different scenarios aiming at resource use reductions. The
model integrates an input-output model with an energy and a material model in order to

        IIOMME08                                       Seville - July, 9-11 2008
Renewable energy in Austria: Modeling possible development trends until 2020 3
show the manifold relationships between economy and environment. Furthermore,
“e3.at” has a soft link to the world model GINFORS1 to illustrate the effects of
international trade on the Austrian economy. It is an econometric model for Austria
built in the style of the German model PANTA RHEI2. However, the Austrian model is
not a copy of the German model, but rather uses general construction principles that are
also valid for other countries, and is then adapted to Austrian conditions and
circumstances. The general features of the model will be presented in the next sub-
section, followed by a short description of the model structure and components.
2.1 General properties
“e3.at” is a multi-sector model that permits the illustration of structural change and as
such is able to recognize particular burdens on certain industries. This fact is important
for the design of a social reconciliation and supporting measures to offset these burdens.
The transition to a sustainable development can thereby be arranged with consideration
of social and economic compatibility.
The model also illustrates the interdependencies of environment and economy,
which allows not only the analysis of effects on economic growth and employment, but
also on resource use and CO2 emissions. The integration of the environmental and
socio-economic systems with their various linkages and feedbacks is needed to
appropriately assist policy-makers in their decisions for suitable strategies to tackle the
most challenging environmental and socio-economic problems.
The model “e3.at” is based on the philosophy that agents are acting on
imperfect markets under conditions of bounded rationality. The application of
econometric methods facilitates an empirically validated parameterization of the model.
As an empirically validated model it is able to produce reliable baseline forecasts,
which, confronted with environmental and economic targets, allow the calculation of
sustainability gaps.
The construction of the model follows two principles: bottom–up modeling and
full integration—both typical characteristics of the INFORUM philosophy (Almon,
1991). Bottom–up means that all 57 sectors of the Austrian economy are modeled in
great detail. Macroeconomic variables such as GDP, disposable income or the consumer
price index are calculated by explicit aggregation. Full integration implies complex
modeling, which simultaneously depicts inter-industry connections and the generation,
distribution, redistribution, and use of income for the demand of goods. It further
depicts the influence of the economy on the environment, as well as the short-term
effects of the change in use of the environment on economic performance.
1
The GINFORS model is documented in Meyer et al. (2007) and Meyer et al. (2008).
2 PANTA RHEI has been used for many simulations of suggested policies (see for example Meyer,
2001; Meyer and Welfens, 2001; Lutz et al., 2005) as well as for the evaluation of implemented
policies such as the ecological tax reform in Germany (Bach et al., 2002). Furthermore, PANTA
RHEI was a central part of several studies seeking sustainability strategies for Germany
(Spangenberg, 2003; Coenen and Grunwald, 2003; Keimel et al., 2004; Bockermann et al., 2005).
IIOMME08 Seville - July, 9-11 20084 Stocker, A., Großmann, A., Madlener, R., Wolter, M.I.
The disaggregated structure of the model is necessary because the linkage
between the economy and the environment requires a detailed production structure.
With regard to data, time series of input–output tables are consistently linked with time
series of a full system of national accounts (SNA).
2.2 Overview of the model structure
The model “e3.at” illustrates the interdependencies of the energy system, environment
and economy, which not only allows the analysis of effects on economic growth and
employment, but also on resource and energy use, as well as on CO2 emissions. Figure
1 provides a first impression of the structure of the model, which comprises the
following components:
• an economic model, consisting of an input-output model, the system of national
accounts (SNA), and the labor market;
• an energy model, illustrating the relationship between economic development,
energy use and CO2 emissions. It comprises energy demand, transformation and
supply;
• a resource model, allocating the domestic and imported material inputs to those
sectors responsible for the material extraction; and finally
• “e3.at” has a soft link to a world model to illustrate the effects of foreign trade
on the Austrian economy.
The model serves as a basis for quantifying the effects of different scenarios of
a more ambitious use of renewable energy in Austria.
Figure 1
In the following we describe the economic model, the material model and the
energy model, respectively.
2.3 The economic model
The economic model shows a very high degree of endogenization, while tax rates and
labor supply are exogenous. As already said, sectoral exports and import prices are
taken from GINFORS, but they are endogenous to that system. The high degree of
endogenization leads to the advantage of the effects calculated in simulations being
complete.
In addition to the usual interdependencies of the circular flow of income, e3.at
depicts the interdependencies of prices and volumes as well as of prices and wages. The
model is non-linear, due to the many multiplicative connections of variables in
definitions and many behavioral equations estimated in double logarithms.
It is a dynamic model because of the capital stock adjustment and the lags in
behavioral equations. The nonlinearity, combined with the interdependency of the
system requires an iterative solution procedure which is given with the Gauss–Seidel
algorithm. The dynamic structure allows a year-by-year solution for a longer time path.
IIOMME08 Seville - July, 9-11 2008Renewable energy in Austria: Modeling possible development trends until 2020 5
The core of the economic model is an input–output model, which shows the
interdependencies of all industries and is also important for linking the economic model
with the material and energy model. Figure 2 shows the structure of the input-output
model.
Figure 2
Within the input-output model demand determines production. First, the model
specifies the final demand categories at purchasers' prices. Then they are transformed to
final demand categories at basic prices. In particular, this requires the exclusion of net
commodity taxes and the re-distribution of trade and transport margins. Based on the
Leontief-Inverse the gross production at basic prices is then calculated as a function of
final demand.
Yet, the demand is also explained within the system, since all demand variables
depend on relative prices. Prices, in turn, are given by the unit costs of the firms using
the mark-up hypothesis, typical for oligopolistic markets. Profits and unit costs for
every sector are given by definition. Together with the import price of the specific good,
the unit costs determine producer prices, a calculation which is carried out for each of
the demand components (intermediate consumption, gross fixed capital formation, final
consumption expenditures by households and government, exports) and for each of the
57 products. Thus, firms set their prices depending on their costs and the prices of
competing imports. Demand reacts to price signals and in turn determines production as
indicated above.
Obviously, the e3.at model includes both demand and supply elements and is
not only demand-driven like general IO models. Besides the usual interdependencies of
the circular flow of income, the model shows the interdependencies of prices and
volumes as well as those of prices and wages.
The SNA is also part of the model and is consistently linked with the input-
output system. It calculates the aggregate variables and the income redistribution
between government, households, firms and the rest of the world. It covers production,
primary distribution of income, secondary distribution of income, use of income,
change in net worth, and financial accounts. The behavioral equations of this system
explain its expenditures; the revenues are given by definition. The government's budget,
including fiscal policy and the social security system, is endogenously depicted. The
detail of this system allows identifying the expenditures and revenues of the social
security system, so that it can be linked to the labor market and other parts of the model.
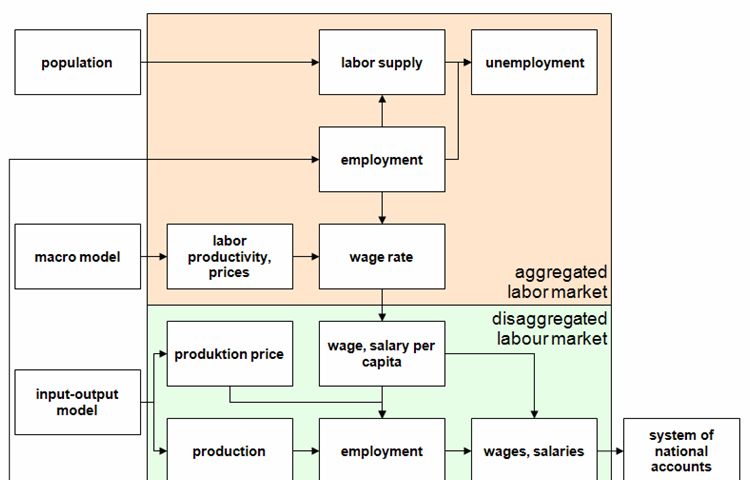
The labor market consists of an aggregated and a disaggregated part. Figure 3
depicts the structure of this model block.
Figure 3
In the aggregated part, the demographic development determines the macro-
economic labor supply. Unemployment is given by definition, subtracting the
aggregated labor demand from the exogenous labor supply.
IIOMME08 Seville - July, 9-11 20086 Stocker, A., Großmann, A., Madlener, R., Wolter, M.I.
In the disaggregated part, for each of the 57 production sectors, the labor
demand is explained by gross production and the real costs of labor per capita in that
sector, as well as by a time trend.
A macro wage rate is calculated in a function, which forecasts the result of the
bargaining process between the unions and the firms: Macroeconomic labor
productivity, the deflator for aggregate consumption and the situation on the labor
market determine the macro wage rate, which in turn explains – besides some sector-
specific variables - the sectoral wage rate. Adding the social security contributions
yields the labor costs per capita.
The data base of the labor model additionally consists of the average weekly
working time, of labor volume as well as of the employees' qualifications. It is assumed
that the structure of employee qualification in each sector remains constant for the
whole simulation period. In order to gain reliable statements, detailed modeling would
be required, which however could not be carried out in the course of this project.
2.4 The material model
The material input model calculates the direct material inputs (DMI) according to the
“Eurostat guide on economy-wide material flow accounts“ (EUROSTAT 2001). The
DMI comprises “the flow of natural resource commodities that enter the industrial
economy for further processing. Included in this category are grains used by a food
processor, petroleum sent to a refinery, metals used by a manufacturer, and logs taken to
a mill” (Adriaanse et al. 1997, p. 8).
As can be seen from Table 1, the material model differentiates 12 material
categories that are part of three material groups (biomass, minerals, and fossil fuels).
The model covers the extraction in Austria as well as those import materials induced in
other countries by Austrian imports. The material data was provided by a EUROSTAT
time series from 1970 to 2001 (EUROSTAT, IFF, 2004).
Table 1
Domestic material extractions (in tons) are linked to the extracting production
sector. The direct physical material imports are driven by the imports in monetary terms
measured in constant prices. It is assumed that the development of material extraction
and of economic variables is proportional.
The modeling of the effects of material savings considers the following process
levels (see Figure 4): At the extraction level (1) no savings are possible. This means that
the production value and extraction of material develop proportionally. The extractor
delivers either to final consumption (2) or to the first process level (3). In both cases
material savings are possible due to increased efficiency. Goods produced by the first
process level are used by the final consumption (4) as well as by other process levels
(5). In summary, there are various interdependencies affecting the material extraction.
Figure 4
If the comparison of the historical development of the production value and
material consumption showed that the production value was higher than material
consumption, an increased material productivity was assumed and the input coefficients
IIOMME08 Seville - July, 9-11 2008Renewable energy in Austria: Modeling possible development trends until 2020 7
(in constant prices) in the baseline scenario were adapted. In addition, it is possible to
change the input coefficients in the scenarios.
The design of the material model allows considering not only the direct
changes of material use but also the indirect ones which take place because of the
various interdependencies between the different sectors. These indirect effects induced
by structural change of the input–output coefficients, and the change of the structure of
final demand, which are both endogenous, are very important for the structure of
physical inputs.
2.5 The energy model
The energy model describes the interrelations between economic developments, energy
consumption and CO2 emissions. On the one hand, the variables of the input-output
model influence the primary energy use. On the other hand, the expenditure for energy
consumption has a direct impact on economic variables.
Since final energy usually cannot be provided directly to the consumer, the
transformation sector converts indigenous (primary) energy to final energy
consumption. Primary energy commodities are extracted or captured directly from
natural resources such as crude oil, hard coal, natural gas, or water. In contrast to
secondary energy (e.g. electricity), they are not converted by physical and/or chemical
processes. Partly, primary energy is transformed directly into final energy. The used
primary energy required, can be won in Austria or be imported from abroad. Also, part
of the domestic production can be exported. Furthermore, final energy is provided by
transformation of primary energy carriers to secondary energy (e.g. electricity and heat),
where, however, large transformation losses may occur.
An adequate energy model must therefore be able to consider primary and
secondary sources of energy, the final energy as well as losses of the energy conversion.
In addition, the differentiation of a multiplicity of sources of energy and a sufficiently
deep sector disaggregation are necessary.
The database of the energy model is the energy balance in physical units drawn
by Statistik Austria which has been available for each year from 1970 onwards. The
CO2 emissions, which are connected with the primary energy use via fixed emission
factors, are provided be the Austrian Federal Agency.
Energy price data were obtained both from national sources (e.g. E-Control3,
Austrian Energy Agency 2004) and the International Energy Agency (IEA 2007). IEA
provides prices with and without taxes (consumption and value added tax for selected
energy sources. In order to ensure the comparability of the data, all prices refer to
Terajoule (TJ).
3
http://www.e-control.at/portal/page/portal/ECONTROL_HOME/OKO/ZAHLEN_DATEN_FAKTEN/OEKOSTROMMENGEN/
Gesamt/Archiv
IIOMME08 Seville - July, 9-11 20088 Stocker, A., Großmann, A., Madlener, R., Wolter, M.I.
2.5.1 Forward projection of the energy balances
The energy balance of the Statistik Austria that differentiates 37 energy sources and 21
industries is the starting point for the construction of the energy model. First, the energy
balance is aggregated to 17 sources that comprise fossil fuels and renewable energy
forms (see blue cells in the following figure).
Figure 5
Regarding the structure (see Figure 6), the energy balance comprises three
main parts: energy supply, transformation and demand. This structure holds for all
energy sources considered.
Figure 6
Starting with the energy supply, domestic energy production plus imports and
stocks minus exports yields gross domestic consumption. The supply is determined by
definition from the transformation and final energy demand.
The transformation sector comprises the conversion of primary forms of energy
to secondary or final energy. The transformation output is the result of this
transformation process. In the transformation process the plants do not only require
primary energy (i.e. the transformation input) but also energy to operate the plants.
The total energy demand is the sum of the uses for transformation input, use
within the energy sector for needs other than transformation, any losses between the
points of production of the energy commodities and their final use, and the final
consumption. A number of fuels may also be used for non-energy purposes. An
example is the transformation of fossil fuels (oil, natural gas and coke-oven byproducts)
and biomass carbon to synthetic organic products. Thus, the final consumption consists
of the non-energy and energy uses.
In order to determine the energy balances for all 17 energy sources in the
forecasting period, first the final energy consumption of the 21 economic sectors (given
by the energy balance) has to be calculated, followed by the determination of
transformation output and input. The gross domestic consumption is by definition
determined on the demand side. Finally, the imported energy goods are calculated as
residuals from the gross domestic consumption, the stocks, the exports and the domestic
production.
In a first step, for each of the 17 sources final energy consumption for the
regarded 21 industries was projected with the growth rates of real production. For this
purpose, the 57 economic sectors of the input-output model are allocated to the 21
industries that are captured in the energy model. The final energy demand of the 21
economic sectors is explained - if no better information is present - for all the energy
sources together.
Figure 7
Logarithmic estimation only enters the real production of the respective
economic sectors, since no correlation to the price relations and therefore also no
substitution possibilities between the sources of energy were found. The development of
IIOMME08 Seville - July, 9-11 2008Renewable energy in Austria: Modeling possible development trends until 2020 9
the total energy demand of a sector then determines the growth of final energy demand
for each energy source and economic sector.
For the sectors “iron and steel“ and “private households“ more detailed
information is available so that the final energy consumption can be estimated
separately for each energy source. The estimation is based on real production, average
energy prices as well as on technological trends and learning curves.
The final energy consumption (electricity and heat) of private households is
modeled subject to the development of real consumption expenditures for electricity,
natural gas and other fuels. The demand for heat of private households is a function of
the use of coal, crude oil products, natural gas, and solar heating, district heating, energy
from heat pumps, firewood, pellets and waste wood.
Apart from the oil products the remaining sources of energy for the heat
production of the private households are estimated. The heat demand from oil products
(fuel oil) is residually determined, i.e. it results from the difference of the entire
energetic final demand of the households, the electricity demand as well as the heat
demand of the remaining sources of energy.
Final energy consumption for each energy source respectively is the sum of the
final energy demands over all 21 economic sectors:
ebtl i [t ]
EEV i , ET [t ] = EEV i , ET [t − 1]⋅
ebtl i [t − 1]
21
EEV ET [t ] = ∑ EEV i , ET [t ]
i =1 (1)
EEVi,ET ... final energy consumption of the energy source ET and the industry i
(ET = 1, ..., 17, i = 1, ..., 21)
ebtli … total final energy demand of the respective industry (i = 1, ..., 21)
Total final energy consumption EEVET implies, in principle, the transformation
output UAj, ET. For the subsequent years the transformation output is determined by
projecting the relationship between transformation output and final consumption from
the year 2005. It is assumed that the transformation output and the final energy
consumption are directly proportional to each other. The transformation output is
differentiated according to the individual converters (coking plant, blast furnace,
refinery, power stations, cogeneration plants, heating stations and gas production). The
transformation output of oil and photovoltaic is modeled as a function of the
transformation input, since a direct relationship exists. The transformation input is
identical to the transformation output. The energy sources "gas", "water", "geothermal
heat", "solar heat", "wind", "energy from heat pumps", "firewood", "wood fuel" and
"biofuels" have by definition no transformation output.
IIOMME08 Seville - July, 9-11 200810 Stocker, A., Großmann, A., Madlener, R., Wolter, M.I.
UA j ,ET [2005]
UA j , ET [t + 1] = EEVET [t + 1]⋅ ⋅ 100
EEVET [2005]
7
UAET [t + 1] = ∑ UA j ,ET [t + 1]
j =1 (2)
UAj: transformation output of plants (j = 1, 2, …, 7)
EEVET: total final energy consumption over all industries
The transformation output results from converting or using primary energy (for
heating or power). The output depends on the used amount of primary energy and of
technology. The technological coefficient is assumed to be constant, so that the
transformation input can be calculated as:
UE j , ET [2005]
UE j , ET [t + 1] = UA j , ET [t + 1]⋅ ⋅100
UA j , ET [2005]
7
UE ET [t + 1] = ∑UE j , ET [t + 1]
j =1 (3)
In general, it is assumed that under normal conditions the power and heat
output develops proportionally (in the ratio of 1:1), i.e. if the entire final energy demand
increases, the change in production of power and heat develops equally. In the scenarios
the transformation input of the energy sources, with given final energy demand, can be
varied so that the power to heat ratio can be changed.
Figure 8
Domestic production, changes in stocks and the non-energy uses are constant.
Transport losses and own use of the energy sector are modeled subject to the size of use
of the respective energy source, so that they grow proportionally. Energy exports
depend on the economic exports.
Gross domestic energy consumption can by definition be calculated either from
the supply or demand perspective. On the demand side, gross domestic energy
consumption is determined by the transformation input minus transformation output
plus the use within the energy sector, plus non-energy use, plus transport losses and
final energy use. On the supply side, gross domestic energy consumption consists of
domestic energy production plus imports and stocks minus exports.
In this modeling framework, gross domestic consumption of energy is
calculated from the demand side perspective (see Figure 9).
Figure 9
After determining gross domestic energy consumption, imports can be
calculated as residuals (see Figures 9 and 10). A change of the energy imports
influences the economic imports in the input-output model. An increased demand of oil,
IIOMME08 Seville - July, 9-11 2008Renewable energy in Austria: Modeling possible development trends until 2020 11
for instance, augments on the one hand the amount of imports and, on the other hand,
affects the price, which again causes further reactions. The energy supply is determined
by definition.
Figure 10
2.5.2 Forward projection of energy prices
The determination of the energy prices follows the duality of the selected modeling
approach: On the one hand, energy prices have to be seized correctly in the energy
model. On the other hand, production price indices in the concept of basic prices have to
be adapted in the economic model in order to correctly record the developments in the
energy model.
For the economic development the production price indices are crucial. Due to
the information that the input-output model provides, the cost structure for the sector
“energy and services of the energy industry” is well-known. It contains the costs for
intermediate demand, capital use in the form of depreciations and labor costs. Further
cost components are the net taxes on goods and net production taxes.
In the energy model the development of the prices is determined on the basis of
scenario assumptions and "learning curves": These assumptions are based on various
studies. The source for import prices of the fossil sources of energy is the IEA World
Energy Outlook (IEA, 2007). The price history for large and small consumers follows
the growth rates of the respective sources of energy.
For calculating the changes in the input coefficients of the energy industry, the
energy balance is the basis. In the transformation sector the lines for power plants (KW)
and combined heat and power plants (KWK) do not only deliver the input of the
different energy sources (EBKW&KWK,EC,t), but also the sum of the used energy sources
(EBKW&KWK,t). From these components it is possible to determine the ratio of use:
EBKW &KWK ,EC ,t
EC − Ratio = (4)
EBKW &KWK ,t
For the changed inputs of coal and gas during the power generation thereby a
connection to the input-output table can be determined: The price-adjusted input
coefficient ARGas&coal,energy sector,t is defined as the ratio of price-adjusted intermediate
flows to price-adjusted production and determines the necessary amount of electricity.
Accordingly, the input coefficient ARGas&coal,energy sector,t decreases
proportionally when the portion of fossil energy sources on power generation declines.
The consequence of additional inputs of renewable energies – with unchanged
electricity consumption – thereby leads to savings in inputs and thus ceteris paribus to a
reduction of the basic prices.
So far, only one part of the changes of the cost structure of the energy industry
is captured. In addition, we have to differentiate renewable energies as (1) renewable
energies that use biofuels (fire wood, wood pellets, combustible wastes, fermentation
gas, etc.) and (2) renewable energies that do not (solar, water, wind etc.). For both cases
IIOMME08 Seville - July, 9-11 200812 Stocker, A., Großmann, A., Madlener, R., Wolter, M.I.
it is true that an increasing use implies that additional production capacity has to be
generated.
Investments have to be made which are included in the cost accounting of the
firms by the size of the consumption of fixed capital.
The size of the investments depends on the costs per installed capacity unit (in
kW) and the operating time (in h). While renewable energies that are based on
regenerating raw materials can be operated continuously, power stations that are based
on wind and solar energy are dependent on the weather situation. Accordingly, for each
energy source an investment path is computed, which entails a change in the
depreciation. Thereby, it is assumed that the investments in renewable energies are
additive and added to the "usual" investments in the energy sector. Hence it follows that
the depreciations in the cost calculation of the energy supply industry rise and thus
accelerates the development of prices.
In the first case additional costs (e.g. for the use of fuels) must be added. A
higher use of fuels implies proportional changes in the input coefficients of the cost
structure to the ratio of use in the energy balance. Depending on the energy source, the
wood industry, the chemical industry or agriculture increase their portion on the cost
structure of the energy industry.
In the second case the situation is more difficult: For wind, water and solar
energy no intermediate deliveries arise in the cost structure of the energy industry since
no costs emerge. From this it cannot be concluded, however, that the electricity tariff
reduces, as long as the depreciations for, e.g., photovoltaic systems are smaller than the
savings of fossil energy sources.
In both cases the renewable energies are fed into the electricity grid. The grid
operator ("distribution") pays the feed-in compensation to the renewable power
producers. The power distribution companies record the costs of the electricity feed-in
to the grid into their cost calculations. Since the feed-in compensation per kWh for
renewable energies is usually clearly higher than for conventionally produced energy
the input coefficient AR[energy][energy] increases.
Due to the missing decomposition of the energy sector (production and
distribution of energy cannot be divided) the portion of renewable energy shifted within
the energy sector is not known. Thus, a proper allocation has to use assumptions. In the
following it is postulated that this sector internal flow increases by twice the savings of
fossil energy resources. This hypothesis stems from the consideration that each
renewable energy (except for water and fuel wood) is at least twice as expensive as
conventionally produced energy. From this, it follows that the price changes are all the
more underestimated the higher the feed-in compensation is. Especially strong is the
underestimation in the case of photovoltaics.
Concerning the labor costs we assume a constant development, due to missing
information.
Figure 11 provides an overview of the connections between the economic and
the energy model. Furthermore, the price effects of a higher use of renewable energies
are summarized. At a first glance, the figure conveys that the use of renewable energy
IIOMME08 Seville - July, 9-11 2008Renewable energy in Austria: Modeling possible development trends until 2020 13
leads to augmenting prices. However, it has to be considered that increasing prices for
fossil fuels may cause an overall decelerated price development. The beneficiary of a
particular energy source is thus dependent on the assumptions about the energy prices in
the scenarios.
Figure 11
Furthermore, it has to be noted that the prices for final consumption are based
on the purchaser price principle, i.e. current taxes etc. still positively affect the
development of the purchaser prices. In addition, the energy sector can include
additional criteria – e.g. the development of the price for electricity at the stock
exchange – and, accordingly, further mark-ups into the price setting. This is not the case
in the modeling; rather a constant relationship between unit costs and production prices
is assumed.
Finally, the consequences of the CO2 emission trading are included in a
simplified way. The energy industry pays the costs of the CO2 certificates – the arising
payment stream is accordingly booked in the SNA – and allocates these costs equally, in
a way that all the production prices increase, however without additional profits in the
energy industry.
2.5.3 Feedbacks between the energy model and the economic model
The feedbacks that exist between the economic model and the energy model are
illustrated in Figure 12. The economic and the energy imports and/or exports of fossil
and renewable energy resources mutually influence each other in their development. A
quantitative increase of the imported energy resources such as coal or gas, equally
causes a rise in the amount of the price-adjusted imported goods of the economic model.
The fossil sources of energy such as coal, gas and oil can be added directly to the
economic goods imported. Firewood, however, is only one part (approx. 4 %) of the
imported goods of the commodity group "forest products".
Figure 12
A similar logic applies to the exports. However, here the imported economic
goods determine the energy exports (i.e. the exports of the energy balance). The reason
lies in the structure of the model. It is assumed that Austria’s exports depend on the
world import demand. This is given by the world trade model GINFORS. The size of
the exports depends on the market shares, which change by the competitiveness of the
regarded country.
Changes in industry-specific final energy demand also affect the intermediate
flows of the “industry energy and services of the energy supply" as well as the
associated transformation input of primary energy (coal, crude oil, natural gas, etc.) for
the production of the secondary energy (district heating, electricity). Changes in the
transformation input and, concomitantly, the transformation output of secondary energy
in the respective converters (coking plant, refinery, heating plants etc.) lead to a
changed cost structure (see previous remarks).
The change in final energy demand must be integrated into the intermediate
consumption matrix accordingly. This is realized by projecting the input coefficients
IIOMME08 Seville - July, 9-11 200814 Stocker, A., Großmann, A., Madlener, R., Wolter, M.I.
with the quantitative change of the assigned energy sources used for power and heat
generation.
3 The RET Scenarios
Based on the experience of the project “ARTEMIS” (see Kowalski et al., 2006;
Madlener et al. 2007; Kowalski et al., 2008, www.project-artemis.net), scenarios were
defined to specify how an increased share of renewable energy may look like. Together
with stakeholders and experts of energy technology and policy, altogether three
scenarios were worked out, illustrating different pathways to promote renewable energy
and analyzed in comparison to a Business as Usual (BAU) scenario. The BAU scenario
reflects the policy situation of 2005. Comparing the BAU scenario with the RET
scenarios allows us to recognize effects of changes induced by the scenario design.
The scenarios focus on heat and power generation. They neither refer to the
transport sector nor to measures to improve efficiency in the manufacturing industries
or the thermal reconstruction of buildings. However, energy efficiency improvements
are considered in the BAU scenario.
3.1 The Scenario “Improve strengths” - STA (short-term oriented)
The scenario “Improve strengths” (STA) is based on those technologies which have low
actual heat or power costs and are able to promptly expand their capacities. Thus,
“Improve strengths” primarily focuses on the extension of wind power and small
hydropower for power generation, as well as on pellets for heat generation. All these
technologies have good chances of further implementation in Austria. Concerning the
security of supply, the scenario is supposed not to be able to significantly reduce energy
imports, while the structure of supply will be more centrally organised.
Due to the limited capacity expansion with respect to hydropower, wind power
and wood pellets, this scenario would result in relatively small CO2 savings. The
expansion of hydropower is limited due to environmental constraints. Missing areas
with favorable wind conditions and lacking social acceptance restrict the further
exploitation for wind power. For wood pellets a doubling of the capacity is assumed,
but a higher expansion is limited due to increasing competition with the wood industry.
For these reasons, also an increase of photovoltaics is assumed.
3.2 The Scenario “Biomassive” – BIO (middle-term oriented)
The scenario „Biomassive“ (BIO) was designed due to the importance of biomass as an
energy carrier for Austria and due to the fact that a comprehensive and sustainable use
of the available biomass potentials is very likely (e.g. richness of forests, tradition,
successful wood industry, technological know-how). These technologies, which have
led to substantial capacity building over the last years and which hold great potential for
further development, are extended the most. Principally, the use of solid biomass and
biogas receives the strongest support, leading to a central structure of supply with a
focus on heat generation.
The scenario is constructed to estimate the maximum biomass use within
critical framework conditions. In this respect, additional biomass capacity, recycling
capacity, land use conflicts with wood, paper and food industry, and biofuels as well as
IIOMME08 Seville - July, 9-11 2008Renewable energy in Austria: Modeling possible development trends until 2020 15
biomass imports have to be considered. As it was the case for the first scenario, the
technological conditions for the implementation are also given. However, a strong
expansion of biomass utilisation will require increasing imports of investment goods in
order to offset missing short-term production capacity in Austria.
As a result, a significant reduction of CO2 emissions in comparison to the BAU
scenario can be expected. This reduction, however, is not possible without imports of
biomass carriers and technological equipment.
3.3 The Scenario “Think of tomorrow” – DAM (long-term oriented)
On the one hand, the scenario “Think of tomorrow” (DAM) is based on a long-term
investment strategy, which is provided by the promotion of costly but very promising
future technologies (e.g. photovoltaics, geothermal energy). On the other hand, market-
ready technologies with low land use requirements are furthered in order to distinguish
this scenario from „Biomassive“.
Thus, “Think of tomorrow” disregards the combustion and the gasification of
biomass resources. On advice of the stakeholder group the power of the sun is used in
the form of a massive expansion of photovoltaics. However, due to the still high
investment costs of photovoltaics, the financing of this scenario would have to be
strongly supported by the government, and require substantial subsidy funding.
In addition, it is not easily possible to create the necessary production capacity
for solar cells in Austria, leading to additional imports of solar cells, which would incur
a run-off of value added. If a similar behavior in other countries is assumed, then
demand-driven price increases for solar cells are likely. Furthermore, the provision of
the technology is very resource-intensive. Positive factors of this scenario are the
exploitation of a sustainable energy source, the achievement of a significant CO2
reduction and the decrease of fossil resource imports.
4 Results of scenario simulation
With respect to the economic development the BAU scenario as well as the
RET scenarios are supposed to have positive effects. In the BAU scenario the gross
domestic product (GDP) will increase by 2.1% p.a., in the RET scenarios this growth
will even be higher. The scenarios substantially differ in the growth dynamic of
investments. The scenario “Think of tomorrow“ requires considerable investments
which entail the strongest growth in GDP. As already mentioned, it has to be assumed,
however, that not all solar cells can be produced domestically, implying that additional
imports will reduce domestic economic growth.
The results for employment show that economic growth also leads to an
increase in the number of employees. While in the BAU scenario 198,000 additional
jobs can be created until 2020, this number is still higher in the three scenarios
designed: In comparison to the BAU scenario the scenario “Think of tomorrow” leads
to 19000 new jobs, in BIO about 15,000 and in STA about 10,000 additional people can
be employed.
IIOMME08 Seville - July, 9-11 200816 Stocker, A., Großmann, A., Madlener, R., Wolter, M.I.
The composition of the final energy consumption according to energy sources
develops very heterogeneously between the scenarios. The use of fuel oil is lower in
BIO and in DAM than in STA. Especially in “Biomassive” the higher use of firewood
in private households reduces the use of fuel oil significantly. In the scenario “Think of
tomorrow” it is the generation of heat by solar energy which decreases the use of fuel
oil.
The comparison of the shares of renewable energy in the course of time shows
that in the BAU scenario the share between 2005 and 2020 decreases due to the missing
extension of hydropower. In the RET scenarios this decrease can be stopped (see Figure
13).
Figure 13
The target to cover 34% of energy use by renewable energy cannot be met in
neither of the scenarios (see Table 2). The highest share with 27.5% in 2020 can be
expected in the scenario “Think of tomorrow”. “Improve strengths” supposes that the
share of the year 2005 can be kept, while in “Biomassive” even a slight decrease in
percentage over time is possible.
By combining the assumptions of the different scenarios the overall share can
be extended to 28.3%. Yet, it has to be noted that energy use will strongly increase until
2020 (see Table 2), so that despite the massive expansion of renewable energy
additional heat and power consumption cannot be covered. A stabilization of energy use
through efficiency gains and changes in consumption behavior could lead to an increase
of the share to 37%.
The resulting CO2 reduction is caused by the realized shares of renewable
energy. It is true that in all scenarios the CO2 emissions can be reduced compared to the
BAU scenario, since fossil fuels can be substituted by renewable resources. An absolute
reduction of CO2 emissions over time is, however, not possible in neither of the
scenarios (see Figure 14). Thus, with an exclusive expansion of renewable energy the
respective EU regulation of reducing CO2 emissions by 20% compared to 1990 will not
be met.
Figure 14
Table 2
In summary, one can conclude that the scenarios developed do not provide a
formula for success concerning the extension of renewable energy. There is no free
lunch. The scenario „Improve strengths“ features cost efficiency and competitiveness,
but the expansion of wind and hydropower is limited and problematic from an
environmental point of view. “Biomassive” is supposed to have high potential for
political implementation, but suffers from land use conflicts and resource scarcity. The
scenario “Think of tomorrow”, in turn, is able to achieve a high augmentation of
renewable energy and large CO2 savings, but requires high investment costs.
Finally, it is obvious that there is no alternative to reducing energy
consumption. Only if it is possible to stop its growth through huge efficiency gains and
IIOMME08 Seville - July, 9-11 2008Renewable energy in Austria: Modeling possible development trends until 2020 17
changes in behavior can renewable energy live up to the high expectations to contribute
to reach a sustainable energy system.
5 Summary
In the course of the project the emphasis of the work was on the development of the
simulation model, the design of the scenarios as well as on their simulation. The model
“e3.at”, which integrates energy, environmental and economic aspects in an integral and
consistent way, is well-suited for illustrating the impacts of an increased portion of
renewable energy technologies. The integration of the environmental and socio-
economic systems with their various linkages and feedbacks is needed to appropriately
assist policy-makers in their decisions for suitable strategies to tackle the most
challenging environmental and socio-economic problems.
Through its participatory approach, the project fosters the intensive exchange
of experience between researchers and actual users of the results from the political,
economic and societal domain. This enables an illustration of the potential impacts of
renewable energy resources which reflects actual stakeholders’ concerns. Furthermore,
the involvement of various actors (energy suppliers, NGOs, public administration etc.)
with their different interests and values represents a crucial element of a democratic
decision process towards a sustainable energy future. In this respect, the project
contributes to the connection of science and practice by improving the dialogue between
stakeholders and researchers and by enhancing the transparency of the modeling
process.
Acknowledgements
We are grateful to Stefanie Schabhüttl for proof-reading the different versions of the
paper.
IIOMME08 Seville - July, 9-11 200818 Stocker, A., Großmann, A., Madlener, R., Wolter, M.I.
References
Adriaanse, A., Bringezu, S., Hammond, A., Moriguchi, Y., Rodenburg, E., Rogich, D.,
Schütz, H. (1997) Resource Flows: The Material Basis of Industrial Economies
(Washington DC).
Almon, C. (1991) The INFORUM approach to interindustry modeling. Economic
Systems Research, 3, pp. 1–7.
Bach, S., Kohlhaas, M., Meyer, B., Praetorius, B., Welsch, H. (2002) The effects of
environmental fiscal reform in Germany: a simulation study, Energy Policy, 9, pp.
803–811.
Bockermann, A., Meyer, B., Omann, I., Spangenberg, J.H. (2005) Modelling
sustainability comparing an econometric (PANTA RHEI) and a systems dynamic model
(SuE). Journal of Policy Modeling, 2, pp. 189–210.
Coenen, R., Grunwald, A. (eds) (2003) Nachhaltigkeitsprobleme in Deutschland.
Analyse und Lösungsstrategien (Berlin, Edition Sigma).
Distelkamp, M., Meyer, B., Wolter, M. I. (2005) Der Einfluss der Endnachfrage und der
Technologie auf die Ressourcenverbräuche in Deutschland, in: Beys K. (ed)
Ressourcenproduktivität als Chance – Ein langfristiges Konjunkturprogramm für
Deutschland (Aachen, Aachener Stiftung Kathy Beys).
Energy Agency (2004): Energieeffizienz und Erneuerbare 2010. Endbericht, Wien.
EUROSTAT (2001) Economy-wide material flow accounts and derived indicators.
A methodological guide (Luxembourg, Statistical Office of the European Union).
EUROSTAT, IFF (2004) Economy-wide Material Flow Accounts and Indicators of
Resource Use for the EU-15: 1970-2001. Series A (Vienna, Statistical Office of the
European Union, Fakultät für Interdisziplinäre Forschung und Fortbildung).
Großmann, A., Stocker, A., Wolter, M.I. (2008) Das integrierte Umwelt-Energie-
Wirtschafts-Modell e3.at (Environment – Energy – Economy – Austria), Working
Paper Nr. 1 des EdZ-Projekts Modellierung nachhaltiger Energieszenarien, Wien.
Keimel, H., Berghof, J., Klann, U. (2004) Nachhaltige Mobilität integrativ betrachtet
(Berlin, Edition Sigma).
Kowalski, K., Madlener, R., Stagl, S. (2006) Neue Wege der integrierten Bewertung
von nationalen Energieszenarien für Österreich, Symposium Energieinnovation
”Dritte Energiepreiskrise – Anforderungen an die Energieinnovation”, 15.-17. Feb.
2006, TU Graz, Austria (www.IEE.TUGraz.at).
Kowalski K., Stagl S., Madlener R., Omann I. (2008) Sustainable Energy Futures:
Methodological Challenges in Combining Scenarios and Participatory Multi-Criteria
Analysis, European Journal of Operational Research (in press).
IIOMME08 Seville - July, 9-11 2008Renewable energy in Austria: Modeling possible development trends until 2020 19
International Energy Agency (2007): Energy Prices and Taxes.
Lutz, C., Meyer, B., Nathani, C., Schleich, J. (2005) Endogenous technological change
and emissions: the case of the German steel industry, Energy Policy, 9, pp. 1143–1154.
Madlener R., Kowalski K., Stagl S. (2007): New Ways for the Integrated Appraisal of
National Energy Scenarios: The Case of Renewable Energy Use in Austria, Energy
Policy, 35 (12), pp. 6060-6074.
Meyer, B. ( 2001) CO2-taxes, growth, labor market effects and structural change—
anempirical analysis, in: Welfens, P.J.J. (ed) Internationalization of the Economy and
Environmental Policy Options (Berlin, Springer-Verlag), pp. 331–352.
Meyer, B., Welfens, P.J.J. (2001) Innovation-augmented ecological tax reform: theory,
model simulation and new policy implications, in: Welfens, P.J.J. (ed)
Internationalization of the Economy and Environmental Policy Options (Berlin,
Springer-Verlag), pp. 229–268.
Meyer, B., Wolter, M.I. (2005) Sozioökonomische Modellierung. Ausgewählte
Ergebnisse der Arbeiten der Kooperationsgruppe, ZiF-Mitteilungen, 3/2005.
Meyer, B., Lutz, C., Wolter, M. I. (2008) The Global Multisector/Multicountry 3-E
Model GINFORS. A Description of the Model and a Baseline Forecast for Global
Energy Demand and CO2 Emissions. Journal of Sustainable Development, special
issue on global models, forthcoming.
Meyer, B., Lutz, C., Schnur, P., Zika, G. (2007) Economic Policy Simulations with
Global Interdependencies: A Sensitivity Analysis for Germany. Economic Systems
Research, 19:37-55.
Spangenberg, J.H. (ed) (2003) Vision 2020. Arbeit, Umwelt, Gerechtigkeit—
Strategien für ein zukunftsfähiges Deutschland (München, Ökom-Verlag).
Stocker, A., Großmann, A., Hinterberger, F., Wolter, M.I. (2007) Wachstums-,
Beschäftigungs- und Umweltwirkungen von Ressourceneinsparungen in Österreich
(RESA), Studie im Auftrag des Lebensministeriums, Wien.
Stocker, A., Bohunovsky, L., Großmann, A., Hinterberger F., Madlener, R., Wolter,
M.I. (2008) Erneuerbare Energie in Österreich: Modellierung möglicher
Entwicklungsszenarien bis 2020, Projekt-Endbericht im Rahmen der
Programmlinie "Energiesysteme der Zukunft", April 2008, Wien.
IIOMME08 Seville - July, 9-11 200820 Stocker, A., Großmann, A., Madlener, R., Wolter, M.I.
Tables and Figures:
Figure 1
Structure of the model “e.3.at” (Source: own illustration)
Figure 2
Structure of the input-output model (Source: own illustration)
IIOMME08 Seville - July, 9-11 2008Renewable energy in Austria: Modeling possible development trends until 2020 21
Figure 3
Structure of the labor market (Source: own illustration)
Figure 4
Potential material savings along the process chain (Source: own illustration)
IIOMME08 Seville - July, 9-11 200822 Stocker, A., Großmann, A., Madlener, R., Wolter, M.I.
Figure 5
Energy sources (Source: own illustration)
Figure 6
fossil & other ES renewable ES e.g. electricity
= energy supply (production, imports & exports)
,
energy transformation s
d
n
e
rt s
+ l
a
e
c
ir
ic p
n
h
c
e
t
energy demand by sectors
industry l
a
ic
n l
h a
transport c n
if
te ,
, s d
n e
+ housing
o
ti
c
c
ir
n
a
m
u p
, e
d s d
o
r d
p n
other e
rt
s
s
o
r
g
energy model
technical trends, relative prices
Note: ES: energy sources
Structure of the energy balance (Source: own illustration)
IIOMME08 Seville - July, 9-11 2008Renewable energy in Austria: Modeling possible development trends until 2020 23
Figure 7
Note: ES: energy sources
Modeling final energy demand (Source: own illustration)
IIOMME08 Seville - July, 9-11 200824 Stocker, A., Großmann, A., Madlener, R., Wolter, M.I.
Figure 8
Note: ES: energy sources
Transformation of energy (Source: own illustration)
Figure 9
energy transformation (input)
- energy transformation (output)
+ consumption of the energy sector
+ transportation losses
+ non-energy consumption
+ final energy demand
= gross domestic consumption
gross domestic consumption
- domestic energy production
+/- changes in inventories
+ exports
= imports
Balance equations
IIOMME08 Seville - July, 9-11 2008Renewable energy in Austria: Modeling possible development trends until 2020 25
Figure 10
Note: ES: energy sources
Calculation of energy supply (Source: own illustration)
IIOMME08 Seville - July, 9-11 200826 Stocker, A., Großmann, A., Madlener, R., Wolter, M.I.
Figure 11
Modeling of the development of energy prices (Source: own illustration)
Figure 12
Feedbacks of energy model and economic model (Source: own illustration)
IIOMME08 Seville - July, 9-11 2008You can also read


