Economic Impact of the Big Sandy Superstore Arena - Prepared for
←
→
Page content transcription
If your browser does not render page correctly, please read the page content below
Economic Impact of the Big
 Sandy Superstore Arena

              Prepared for:
         Big Sandy Superstore Arena

                 1/15/2013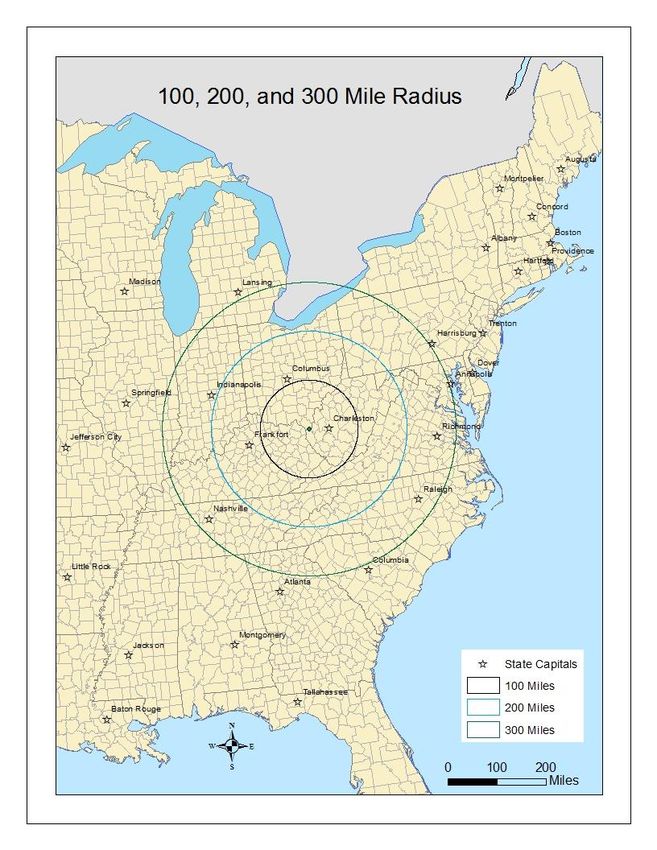
ECONOMIC IMPACT OF THE BIG SANDY SUPERSTORE ARENA

                                                   Authors:

                                           Principal Investigator:

                                                 Kent Sowards

                                                 Researchers:

                                               Jennifer L. Price
                                            Elizabeth A. Eastham

                             Center for Business and Economic Research
                                         Marshall University
                                       One John Marshall Drive
                                        Huntington, WV 25755

                              Phone: (304) 696-2313 • Fax: (304) 696-6088

                                          Acknowledgements:
The authors would like to recognize the following individuals for their assistance in bringing this
    report to fruition: Jim Atkinson, Information Systems Technician, and Anthony Galante,
    Graduate Research Assistant, both of the Center for Business and Economic Research at
                                       Marshall University.

                                                 Disclaimer:
    The contents of this report reflect the views of the authors who are responsible for the accuracy of the data
    presented herein. The views expressed in this report are those of the authors and do not reflect the official
   policy or position of Marshall University or its governing bodies. The use of trade names, if applicable, does
                                       not signify endorsement by the authors.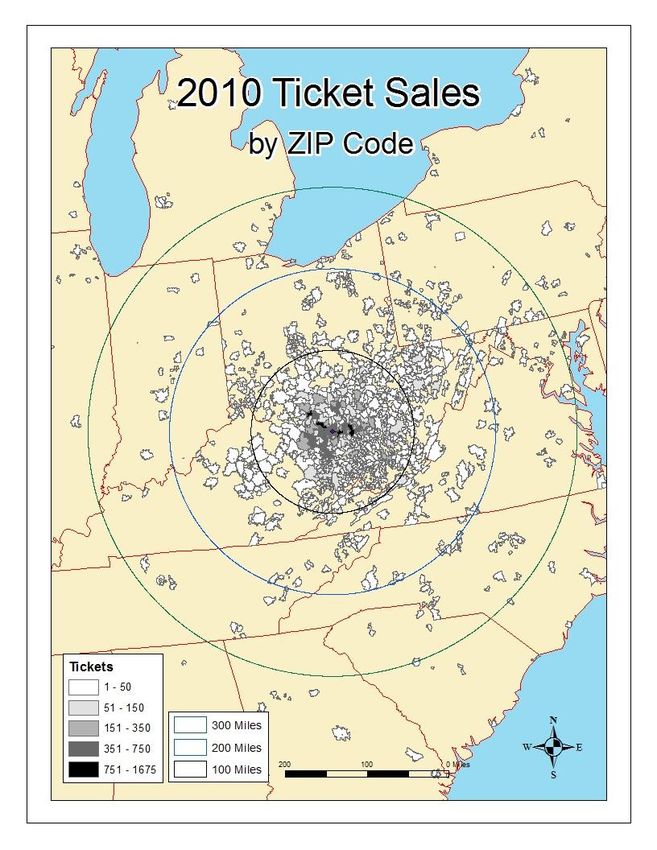
Table of Contents
Executive Summary ........................................................................................................................ 1
   Introduction ................................................................................................................................. 1
   Summary of Results .................................................................................................................... 1
Introduction ..................................................................................................................................... 3
Review of the Literature ................................................................................................................. 4
   Evidence from the Literature ...................................................................................................... 4
       Input-Output Modeling ........................................................................................................... 5
   Conclusions Drawn from the Literature ..................................................................................... 6
Methodology ................................................................................................................................... 6
   Zip Code Differentiation ............................................................................................................. 7
   Demographics and Economic Base ............................................................................................ 7
   Economic Impact Analysis ......................................................................................................... 7
       Setup of the IMPLAN© Model .............................................................................................. 8
       Measurement of Direct, Indirect and Induced Effects ............................................................ 8
   Attendee Survey .......................................................................................................................... 9
Demographics and Economic Base of the Study Area ................................................................. 10
   Age ............................................................................................................................................ 12
   Income....................................................................................................................................... 13
   Labor Force ............................................................................................................................... 14
Discussion of Results: Economic Impact ..................................................................................... 15
   Operating Impact ...................................................................................................................... 15
       Direct, Indirect and Induced Output ..................................................................................... 16
       Top 10 Sectors ...................................................................................................................... 17
       Tax Revenue and the Tax Model .......................................................................................... 19
Discussion of Results: Attendee Survey ....................................................................................... 20
   Survey Respondent Spending at Arena Events ......................................................................... 20
       Spending Inside the Arena .................................................................................................... 21
       Spending Outside the Arena ................................................................................................. 23
   Respondent Behavior Related to Big Sandy Superstore Arena Events .................................... 25
   Likelihood of Future Activity ................................................................................................... 27
   Survey Respondent Profile ....................................................................................................... 33
       Respondent Location ............................................................................................................ 33

                                                                          i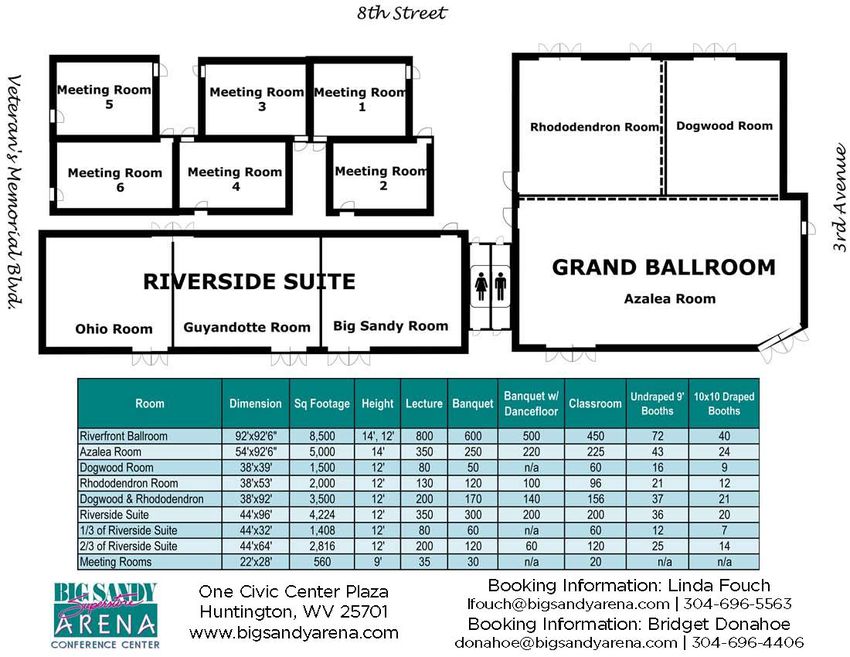
Respondent Demographics ................................................................................................... 35
   Spending Patterns by Respondent Location ............................................................................. 37
       In-Arena Spending by Respondent Location ........................................................................ 37
       Out-of-Arena Spending by Respondent Location................................................................. 38
Intangible Benefits ........................................................................................................................ 40
Summary ....................................................................................................................................... 40
References ..................................................................................................................................... 42

                                                                        ii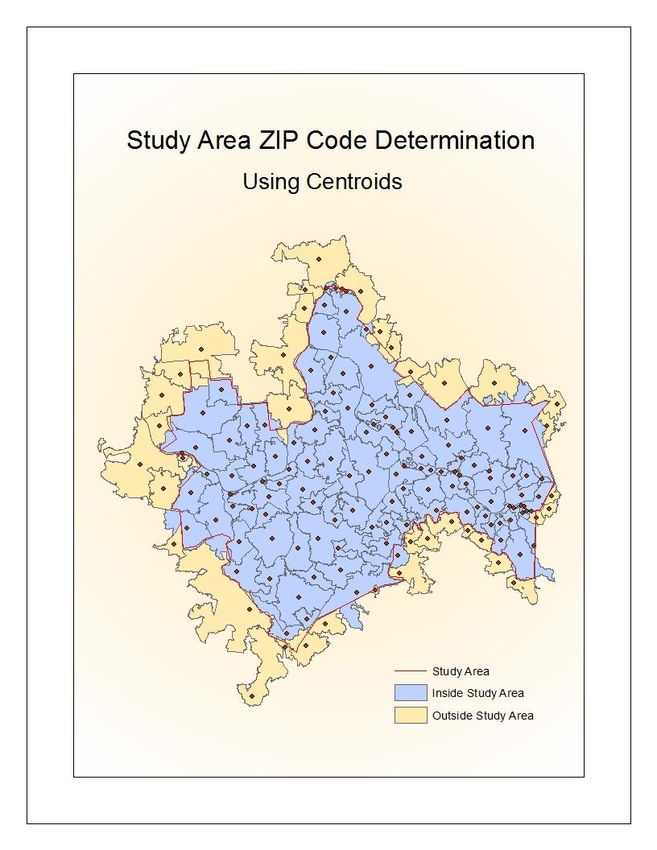
Table of Figures
Figure 1 Population of Study Area ............................................................................................... 10
Figure 2 Average Study Area Population by County ................................................................... 11
Figure 3 Median Household Income of Study Area Counties ...................................................... 13
Figure 4 Percentage of Individuals of Working Age in the Study Area ....................................... 14
Figure 5 In-Arena Purchases by Respondents during a Typical Arena Event .............................. 21
Figure 6 Average In-Arena Respondent Spending during a Typical Arena Event....................... 22
Figure 7 Out-of-Arena Purchases by Respondents during a Typical Arena Event ...................... 23
Figure 8 Average Out-of-Arena Respondent Spending during a Typical Arena Event ............... 24
Figure 9 Number of Arena Events Attended by Survey Respondents in the Past Year ............... 25
Figure 10 Number of Arena Events Attended in Total by Survey Respondents .......................... 26
Figure 11 Respondent Likelihood of Attending Future Concerts/Performances at the Arena ..... 28
Figure 12 Respondent Likelihood of Attending Future Family Shows at the Arena ................... 29
Figure 13 Respondent Likelihood of Attending Future Sporting Events at the Arena ................. 30
Figure 14 Respondent Likelihood of Attending Future Trade Shows at the Arena ..................... 31
Figure 15 Respondent Likelihood of Recommending Events at the Arena to Others .................. 32
Figure 16 In-Arena Spending for In-Area and Out-of-Area Respondents ................................... 37
Figure 17 Out-of-Arena Purchases Made by In-Area and Out-of-Area Respondents .................. 38
Figure 18 Out-of-Arena Spending for In-Area and Out-of-Area Respondents ............................ 39

                                                                iii
Table of Tables
Table 1 Population of Study Area Counties by Age Group.......................................................... 12
Table 2 Labor Force Participation by County for Study Area ...................................................... 15
Table 3 Economic Impact of the Big Sandy Superstore Arena: Output ....................................... 16
Table 4 Top 10 Sectors by Employment....................................................................................... 17
Table 5 Top 10 Sectors by Labor Income ..................................................................................... 18
Table 6 Top 10 Sectors by Total Value Added............................................................................. 18
Table 7 Top 10 Sectors by Total Output ....................................................................................... 19
Table 8 Impact of the Big Sandy Superstore Arena on West Virginia Tax Revenue ................... 20
Table 9 Notification of Upcoming Arena Events by Source ........................................................ 26
Table 10 Arena Events Attended by Survey Respondents ........................................................... 27
Table 11 Largest Zip Code Representation by Respondents ........................................................ 33
Table 12 Respondent Location in Eight County Area of Focus ................................................... 34
Table 13 Respondent Location by State ....................................................................................... 34
Table 14 Adults and Children Living in Respondent Households ............................................... 35
Table 15 Respondent Age ............................................................................................................. 35
Table 16 Respondent Household Income ..................................................................................... 36

                                                                  iv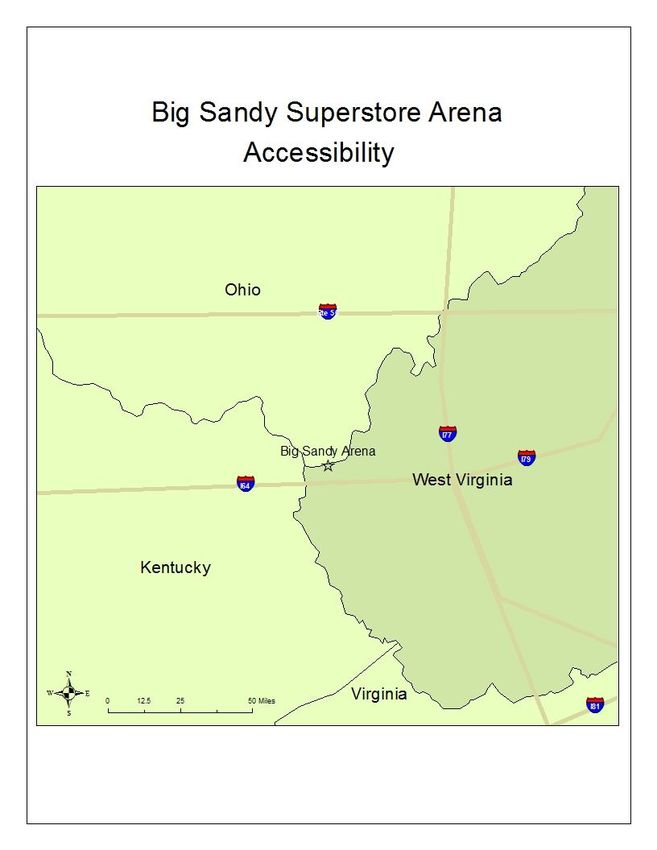
Table of Appendices
Appendix A Location of the Big Sandy Superstore Arena ........................................................... 43
Appendix B Big Sandy Superstore Arena Conference Center Layout ......................................... 44
Appendix C Study Area Zip Code Determination Using Centroids ............................................. 45
Appendix D 2010 Ticket Sales by Zip Code—300 Mile Radius.................................................. 46
Appendix E 2010 Ticket Sales by Zip Code—100 Mile Radius .................................................. 47
Appendix F Survey Respondent Location by County .................................................................. 48
Appendix G 100, 200 and 300 Mile Radius from the Big Sandy Superstore Arena .................... 49
Appendix H Big Sandy Superstore Arena Attendee Survey ........................................................ 50

                                                         v
ECONOMIC IMPACT OF THE BIG SANDY SUPERSTORE ARENA
Executive Summary
Introduction
The Big Sandy Superstore Arena, located in Huntington, West Virginia, has hosted numerous
concerts, family shows and other events—both ticketed and non-ticketed—in its 35 years of
existence. These events attract thousands of attendees every year to the Huntington area. Patrons
of Arena events, particularly those who do not live in the
area, may participate in local activities—such as dining at a
local restaurant, seeing area attractions and possibly staying This is one of the best
overnight at a local hotel—while on their visit to the region. venues I have ever
attended for a concert.
Purchases made while participating in these and other … The staff is very
activities provide monetary stimulation to the local economy.
But the impact of this stimulation is not readily obvious. To
helpful and respectful
best analyze this impact, financial data, attendee spending to any concert goer’s
habits and other information must be collected and evaluated. needs. Overall, a great
As a result, the Center for Business and Economic Research place to watch a
(CBER) at Marshall University was contracted by the Big concert!
Sandy Superstore Arena to conduct an economic impact study
of the effect of the Arena on the local economy.
—2012 Attendee
Summary of Results Survey Respondent
The outcome of the economic impact study conducted by the
CBER includes the direct, indirect and induced effects of the Arena on the surrounding area.
These effects are measured by five values:
Full-time equivalent jobs
Labor income
Total value added
Total output
State and local tax revenue.
The estimated number of full-time equivalent jobs represents positions sustained each year.
This figure does not represent the creation of new jobs on an annual basis. Additional activity
would be required to increase the number of positions in the area.
Labor income, total value added, total output and state and local tax revenue are represented
on an annual basis. For each effect (direct, indirect and induced), the amount of each of these
four values is an estimation of the effect of the Big Sandy Superstore Arena on the surrounding
area annually.
1The direct effects of this analysis include an estimated:
136 full-time equivalent jobs sustained
$3.5 million in labor income per year
$4.7 million in total value added per year
$11 million in total output per year
$399,000 in state and local tax revenue per year.
The indirect and induced effects of this analysis totaled an estimated:
53 additional full-time equivalent jobs sustained
$2.1 million in labor income per year
$3.5 million in total value added per year
$6 million in total output per year
$611,000 in state and local tax revenue per year.
Overall, the total impact as a result of this analysis totaled an estimated:
190 full-time equivalent jobs sustained
$5.6 million in labor income per year
$8.3 million in total value added per year
$17 million in total output per year
$1 million in total state and local tax revenue per year.
In addition to the fiscal impacts on Huntington and the surrounding area resulting from the
operation of the Big Sandy Superstore Arena, there are also an abundance of intangible benefits
produced as a result of the Arena’s presence. These benefits are difficult to quantify, yet this
analysis would be remiss if the value of such benefits was left unspoken.
2Introduction
The Big Sandy Superstore Arena is located in Huntington, West Virginia, and situated near the
Ohio River (see map in Appendix A). Bordered by Ohio to the north and Kentucky to the west,
Huntington is a host to many franchise and local businesses and had an estimated population of
49,253 as of a 2011 Census estimate (U.S. Census Bureau 2012).
Formerly known as the Huntington Civic Center and the Huntington Civic Arena, the
groundbreaking ceremony for the $7.5 million facility was held on March 29, 1976 (Herald-
Dispatch 1976). The completed Arena was opened to the public on September 14, 1977 (Herald-
Dispatch Civic Center Bureau 1977). Today, the Big Sandy Superstore Arena complex includes
a large multi-use arena and a conference center made up of several rooms adaptable to the size
and type of event being held.
The multi-use arena has a 7,500 person seating capacity, depending on seating arrangement and
layout for events (Big Sandy Superstore Arena 2012). Concerts and performances, family shows,
trade shows and sporting events are the most common events held at the Arena. Notable
performances from artists such as Reba McEntire and Barry Manilow have brought thousands to
the Huntington area from across the U.S. and Canada. Family shows, such as the Globetrotters
and Sesame Street, are frequently held to provide family
entertainment. Trade shows, such as the WSAZ Home
and Garden show, attract residents of the Tri-State area
Always a wonderful
each spring, and sporting events such as the West experience and fun time
Virginia State High School Wrestling Tournament bring for the family and myself.
in thousands of patrons statewide.
—2012 Attendee Survey
The Conference Center provides more than 15,000 Respondent
square feet of space divided into 10 main rooms (Big
Sandy Superstore Arena 2012). Several of those rooms,
such as the Riverside Suite, can be divided into smaller rooms or used in its entirety depending
on the space needed for individual events. Catering services are available. A layout of the
Conference Center is provided in Appendix B.
According to a 2011 memorandum by Brian Sipe, the Arena’s General Manager, it was
estimated that approximately 150,000 patrons1 attended events at the arena and conference center
in FY 2011 (Sipe 2011). Upgrades were made to the complex in 2011 from a $4.5 million bond
passed by the City of Huntington (Sipe 2011). The bond allowed the Arena to make a number of
upgrades and improvements to the facility, including new seating, new HVAC units, dressing
room and conference center renovations and technology upgrades. In addition to the bond money
provided by the City, several lighting and other repairs were made throughout the complex in
preparation of the 2011-2012 season (Sipe 2011).
1
Sipe (2011) estimated between 150,000 and 200,000 attendees in this time period. Although more than 150,000
patrons may have visited the Arena during this time, stating this number will provide a conservative estimate.
3Review of the Literature
The regional effect of civic centers and civic arenas such as the Big Sandy Superstore Arena are
often analyzed through economic impact studies to determine the influence of these facilities on
the local economy. As a result, literature pertaining to such studies is prevalent. A collection of
these studies are consulted for supporting documentation of the economic contributions these
facilities make to the surrounding communities and states. These economic contributions are
quantified through business volume, employment, output, value added and tax revenue.
Monies spent on the goods and services provided within these civic centers produce business
revenue. In turn, this revenue employs local residents not only at the centers themselves, but also
in surrounding retail establishments, restaurants and hotels. State and local government units
benefit from the industry’s activity as well through the collection of taxes on the sale of goods
and services and the employment income generated by these sales.
The existence of these types of venues in a local area can also benefit the community through the
recapture effect. This effect is generated when dollars which could have “leaked” out of the state
and local economy are recaptured by the existence of a facility such as a civic arena. This results
in an increase in output, income and jobs in the surrounding area.
Evidence from the Literature
Tulsa’s BOK Center has been a host to many concert performances by well-known artists and
WNBA games. Since its opening in September 2008, net sales from tickets, concessions and
merchandise exceeded $115.7 million (Barber 2012). In this same timeframe, sales tax revenue
remitted from the Center to the state and local government totaled nearly $10 million, greatly
benefitting the economy.
Events held at the Mayo Civic Center in Rochester, Minnesota, generated a regional economic
impact of nearly $113 million for Rochester and the surrounding area during the year 2008 alone
(Mayo Civic Center 2008). At the time of the study, the Center was considering an expansion of
its facilities. It was estimated that expanding the Center would provide an additional $44 million
in annual economic impact to the area, create 800 permanent jobs in the Rochester economy and
contribute an additional $1.5 million sales taxes each year to the State of Minnesota (Mayo Civic
Center 2008).
The presence of a civic center does not only have a direct economic impact on a community;
such establishments can also benefit other businesses in the community through indirect and
induced impacts by attracting visitors from other
I just want to thank you all for areas.
bringing entertainment to us. It’s
Since the establishment of the Verizon Wireless
always a blast to visit the BSSA Center in the Mankato community in
for an event. Minnesota, an excess of 20 hospitality
businesses have chosen to locate in Mankato
—2012 Attendee Survey and neighboring areas (Schooff 2012). An
Respondent additional 60 service and professional
4businesses have relocated to the vicinity of the Center since that time.
Not only do amenities like the Verizon Wireless Center attract businesses to the community, the
Center is also a tool used by those businesses. Businesses indicated that the Center helps attract
and retain the employment base of nearly 54,000 employees due to the lack of availability in the
employees’ home communities (Schooff 2012). Such measures play a sizable economic role by
incentivizing businesses to invest and reinvest in the area.
Input-Output Modeling
A variety of economic modeling tools and software can be used to determine the economic
impact of a civic center. An input-output software, such as the IMPLAN©2 and REMI©3 models,
is one common example. A detailed description of the IMPLAN© software is provided in the
“Methodology” section.
IMPLAN© was used in an economic impact study on the Asheville Civic Center in Asheville,
North Carolina. Three categories—payroll expenditures, other operating expenditures and visitor
spending—were used to establish the model (Ha 2006). The
outcome produced dollar- and employment-effects on the
local economy as a result of the presence of the Center. It We LOVE the Big
was estimated that the Center had a direct effect of $15.5 Sandy Superstore
million and 295 jobs on the regional economy (Ha 2006). Arena! It’s so close to
The indirect and induced effect of the Center totals home and so many
approximately $6.5 million and 73 jobs each year. State and awesome performers
local governments benefit from fiscal impact of the Center of
and shows come! It’s a
an excess of $4.2 million in tax payments each year.
fantastic opportunity!
A recent study focused on the potential impact of expansion
and renovation plans at the Wicomico Youth and Civic —2012 Attendee
Center (WYCC) in Wicomico County, Maryland. As a result Survey Respondent
of the study, renovations and expansions to the WYCC could
expect to increase spending resulting from the Center by
approximately $4.5 to $5.8 million annually (Crossroads Consulting Services 2012). In addition
to spending increases, it was estimated that between 50 and 70 new jobs would be created and
that between $445,000 and $595,000 in state and county tax revenue could be expected
(Crossroads Consulting Services 2012).
In a similar study, the REMI© modeling software was used to examine the economic impact of
the Hartford Civic Center in Hartford, Connecticut. Parr et al. (2011) studied three renovation
scenarios. As a result, it was estimated that an annual average increase of between 1,202 and
1,449 jobs and $7.4 million and $8.4 million in net state tax revenues could be expected over a
10-year time period (Parr, et al. 2011).
2
IMPLAN© stands for IMpact analysis for PLANning. For more information, please visit the MIG IMPLAN
website at http://implan.com/v4/index.php.
3
REMI© stands for Regional Economic Models, Inc. For more information, please visit the REMI website at
http://www.remi.com/.
5Conclusions Drawn from the Literature
As is evident in the literature, the economic impact of civic centers on both the state and local
economy can be far-reaching. Whether directly or indirectly influenced by attendee spending, the
impact of such centers includes both tangible and intangible contributions to the community. By
providing employment, tax revenue, business volume and additional fiscal impacts these
businesses are a vital component and a significant asset in the surrounding region.
Methodology
Data collected to analyze the impact of the Big Sandy Superstore Arena on the surrounding area
include financial statements, ticket sales and employment figures supplied by the Arena, parking
revenue supplied by the City of Huntington and spending patterns and other data categories
collected in the attendee survey. An eight-county region spanning three states is specified for this
report, including:
Boyd County, Kentucky
Cabell County, West Virginia Very nice, have loved
Kanawha County, West Virginia every experience.
Lawrence County, Ohio
Lincoln County, West Virginia —2012 Attendee
Mason County, West Virginia Survey Respondent
Putnam County, West Virginia
Wayne County, West Virginia.
With the exception of Boyd, Gallia and Kanawha, counties chosen as the study area for this
report include Cabell and those comprising the immediate surrounding area. Gallia County is
excluded due to the very limited border to Cabell County. Boyd and Kanawha counties are
included due to population size (particularly of the cities of Ashland in Boyd County and
Charleston in Kanawha County) and ease of access to Huntington via Interstate 64 (see map in
Appendix A).
Specifying the region used for the economic impact model is very important, as selecting an area
which is representative of typical local spending patterns helps produce the most thorough
estimate possible. Expanding the study region beyond the eight counties selected will not likely
add additional value to the analysis beyond capturing small amounts of existing leakages.
For the purpose of the economic impact, the model is based in the year 2009. Due to the
recession occurring during that time, results of the economic impact are likely to be understated
as compared to the true impact of the Arena today. This is beneficial in that the results of this
analysis will produce a conservative estimate. Because these results may be used to determine
future policy, taking care to not overestimate the impact of the Arena is a priority.
6Zip Code Differentiation
There is no other Two pieces of this analysis—one stemming from the survey
venue in the area that results and another from purchaser information4 provided by
provides quality events the Big Sandy Superstore Arena—rely on the use of zip
and family codes to identify attendees on an in-region and out-of-region
entertainment to the basis. Those attendees identified as in-region refer to
individuals who specified zip codes within the eight-county
community like the Big focus area. Conversely, zip codes provided which are outside
Sandy Superstore the boundaries of the eight-county focus area are considered
Arena. It is always a out-of-region for the purpose of this analysis.
great experience for
my family when we In many cases, whether a zip code lies within or outside the
visit… study area is obvious. However, because zip codes do not
follow county lines, there are cases where the inclusion of a
zip code inside or outside the specified region had to be
—2012 Attendee distinguished. Whether the majority of the zip code was
Survey Respondent inside or outside the study area became the deciding factor.
This method was used for both sets of zip codes and is
reflected as appropriate in each corresponding subsection to follow.
Appendix C illustrates the zip code and county lines for the study area. Red dots on the map
indicate center points—or “centroids”—of each zip code. Blue shading indicates zip codes which
were considered inside the study area for the purpose of this analysis while tan shading indicates
zip codes which were not included in the analysis. In most cases, the centroid of each zip code
either lies within this area or very near the study area boundaries.
The map in Appendix D illustrates 2010 ticket sales by zip code in 100, 200 and 300 mile radii
from the Arena. Because more zip codes are provided from the Big Sandy Superstore Arena
compared to those collected in the attendee survey, this map provides a more detailed illustration
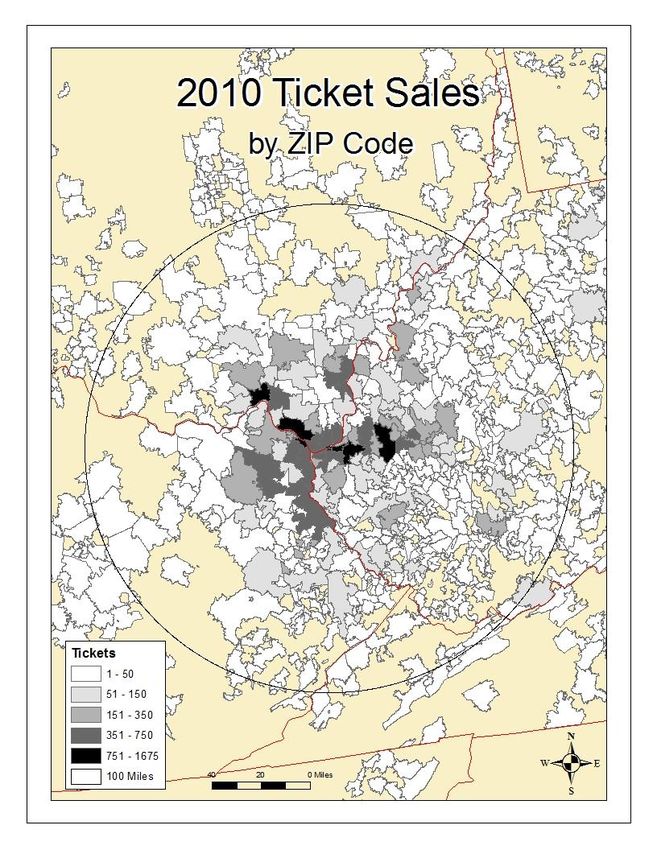
of the geographic areas from which Arena attendees are drawn. Appendix E provides a closer
view of the draw within a 100-mile radius from the Arena.
Demographics and Economic Base
This report uses the most recent demographic and economic data available and maintains
consistency in data years used to the extent possible. Unless otherwise specified, demographic,
economic and employment data used in this report reflects the three-year average from 2009 to
2011 as obtained from the American Community Survey (ACS) of the U.S. Census Bureau.
Economic Impact Analysis
CBER uses the IMPLAN© regional economic impact software to analyze the impact of the Big
Sandy Superstore Arena on Huntington and the surrounding area. Using social accounting
matrices to estimate the economic impact, IMPLAN© analyzes the relationship between
industries and socio-economic characteristics of the local economy resulting in an estimation of
income, output and employment as well as direct, indirect and induced effects on the economy.
4
This information is representative of internet, phone and box office ticket sales for calendar year 2010.
7To establish the model, a combination of data gathered from
the Arena as well as responses to the Big Sandy Superstore Every event that I have
Arena attendee survey are used. attended at the Big
Setup of the IMPLAN© Model Sandy Superstore
Arena I have
To establish the IMPLAN© model used in this analysis, the
weighted average of each spending category was calculated thoroughly enjoyed!
as reported by out-of-region survey respondents. Per-
respondent spending for both in-region and out-of-region —2012 Attendee
survey respondents is provided in detail in the “Spending Survey Respondent
Patterns by Respondent Location” subsection in “Discussion
of Results: Attendee Survey.” Spending estimations for only out-of-region respondents are added
to the model due to the fact that those who live in the specified eight-county region would have
likely spent money within the region regardless of whether or not they attended a Big Sandy
Superstore Arena event. Including spending estimations for those individuals who live in this
region in the model could, therefore, overestimate the indirect and induced spending attributable
to the Arena.
Total estimated attendance by out-of-region patrons to the Arena is calculated using total annual
estimated attendance and the proportion of out-of-area respondents to the attendee survey. This
proportion of respondents is weighted by each expenditure category, so that only the proportion
of individuals who indicated spending in each category is being counted. Once this value is
established, it is applied to the weighted average of each spending category to determine
estimated annual spending5 in each sector for use in IMPLAN©.
Payroll figures supplied by the Big Sandy Superstore Arena are used to estimate full-time
equivalence (FTE) for an annual employment number. To calculate this figure, the number of
part-time employees must be translated to full-time equivalent positions. The summed FTE value
for part-time employees is added to the number of full-time positions held at the Arena to
calculate total annual FTE for use in the model.
Measurement of Direct, Indirect and Induced Effects
CBER uses the value of the output (spending on goods and services) from the presence of the
Arena in the local economy to estimate the economic effects. This is the direct spending
occurring in the local economy on supplies, equipment, labor and services. Direct spending in
each of these areas creates re-spending throughout the region. Re-spending is also known as the
multiplier effect.
Indirect spending stems from the direct spending, in that businesses that offer these goods and
services in turn spend the money received as payment in other areas of the economy. In other
words, the money from direct spending is re-spent elsewhere. As a result of indirect spending,
the induced effect of the money being re-spent by households as income from employment (the
5
Attendee spending on parking is the only expense category which was not calculated using this method for the
model. Estimated annual parking revenue for the year 2011 attributed to the presence of the Arena was supplied by
the City of Huntington and this figure was substituted in lieu.
8outcome of direct and indirect spending) is measured. The
effects of each type of spending will be provided as a result Always a great time!
of the model.
—2012 Attendee
It is important to note that not all re-spending stays within
the region. Instead, it is inevitable that some monies will be Survey Respondent
“leaked” out of the local economy (in this case the eight-
county region) by way of state and federal taxes as well as goods and services imported from
outside the specified region. This is addressed within the modeling software.
Attendee Survey
An online survey was made available to Big Sandy Superstore Arena attendees from November
1 to November 13, 2012 to better understand attendee spending at Arena events. Respondents to
the survey were asked a number of questions to establish the frequency of visits to the Arena as
well as to quantify typical spending while attending events. To estimate visitor spending patterns
while attending events, respondents were asked to select purchases made both inside and outside
the Arena during visits and to estimate expenditures for each purchase on a typical visit.
Each response to the survey was reviewed, and any responses which were incomplete or deemed
to be excessive were discarded. The remaining valid surveys were aggregated. These results are
discussed in the “Discussion of Results: Attendee Survey” section. A complete list of questions
posed to respondents is provided in Appendix H.
9Demographics and Economic Base of the Study Area
The population of the eight-county area of focus exceeded 592,500 individuals in 1980 (U.S.
Census Bureau 2012). The number of individuals living in this area decreased to nearly 548,000
in 1990 (see Figure 1) and experienced a slight increase to 551,000 in 2000. In 2010, total
population in this region exceeded 548,000 individuals (U.S. Census Bureau 2012). Over this 30-
year period, the population of the eight-county area of focus has fallen by more than 44,000
people.
Figure 1 Population of Study Area
600,000
590,000
592,533
580,000
570,000
Population
560,000
550,000
548,275 551,063 548,290
540,000
530,000
520,000
1980 1983 1986 1989 1992 1995 1998 2001 2004 2007 2010
Year
U.S. Census Bureau, 2012.
10On a per-county basis, Kanawha County has the largest population (192,818 people) as of the
three-year average from 2009 to 2011 (ACS 2012). Lincoln County has the smallest population
(21,684 people). The average study area population by county for this time period is provided in
Figure 2.
Figure 2 Average Study Area Population by County
250,000
200,000
Average Population
150,000
100,000
50,000
0
Boyd Cabell Kanawha Lawrence Lincoln Mason Putnam Wayne
County
2012 American Community Survey (ACS): 3-year average 2009-2011.
11Age
Table 1 provides the population of each county in the study area by age group. In seven of the
eight counties, the most populated age group as of the 2009 to 2011 three-year average is
comprised of individuals aged 45 to 54 years old (ACS 2012). Cabell County is the exception;
individuals aged 25 to 34 years old make up the largest age group in this county.
Table 1 Population of Study Area Counties by Age Group
Age Group Boyd Cabell Kanawha Lawrence Lincoln Mason Putnam Wayne
Under 5 years 2,868 5,420 10,679 3,869 1,374 1,578 3,402 2,334
5 to 9 2,807 4,586 11,527 4,619 1,116 1,339 3,530 3,082
10 to 14 3,071 5,765 10,776 3,654 1,546 1,939 3,771 2,169
15 to 19 3,100 6,680 11,003 4,150 1,322 1,509 3,423 2,773
20 to 24 2,565 8,777 10,792 3,434 1,090 1,409 2,596 2,216
25 to 34 6,010 13,106 23,834 7,533 2,559 3,271 6,464 4,849
35 to 44 6,585 11,594 23,947 8,320 2,926 3,437 7,751 5,667
45 to 54 7,534 12,670 29,452 9,025 3,345 4,290 8,707 6,218
55 to 59 3,489 6,443 16,031 3,912 1,627 2,289 4,277 2,840
60 to 64 3,185 5,997 12,370 4,255 1,519 1,574 3,625 3,153
65 to 74 4,485 7,893 17,049 5,548 1,949 2,645 4,767 3,949
75 to 84 2,893 5,762 10,914 3,239 902 1,461 2,597 2,499
85 years and over 888 1,668 4,444 966 409 568 691 642
2012 American Community Survey (ACS): 3-year average 2009-2011.
12Income
The three-year average median household income in the eight-county study area ranged from
$31,989 in Lincoln County to $52,165 in Putnam County (ACS 2012). Average median
household income in the study area is approximately $39,024 for this time period. Figure 3
illustrates this data.
Figure 3 Median Household Income of Study Area Counties
$60,000
$50,000
$40,000
Median Income
$30,000
$20,000
$10,000
$0
Boyd Cabell Kanawha Lawrence Lincoln Mason Putnam Wayne
County
2012 American Community Survey (ACS): 3-year average 2009-2011.
13Labor Force
Nearly 83 percent of individuals in Cabell County are of working age (16 years of age and older)
as of the three-year average6 from 2009 to 2011, making it the county with the highest percent of
working age individuals in this region (ACS 2012). Just over 79 percent of individuals in
Lawrence County are of working age. On average, nearly 81 percent of individuals are of
working age in the study area overall. These percentages are reflected in Figure 4.
Figure 4 Percentage of Individuals of Working Age in the Study Area
83.00%
82.00%
81.00%
Working Age
80.00%
79.00%
78.00%
77.00%
Boyd Cabell Kanawha Lawrence Lincoln Mason Putnam Wayne
County
2012 American Community Survey (ACS): 3-year average7 2009-2011.
6
Labor force data for Lincoln and Mason counties is unavailable for the three-year average from 2009 to 2011. The
five-year average from 2007 to 2011 for these counties is substituted in this subsection only.
7
Ibid.
14Although individuals who are of working age (16 years of age and older) are eligible to be
included in the labor force, not all are actively participating. The labor force is comprised of
those who are willing and able to work and is represented as the sum of those employed and
those unemployed in the population (BLS 2012). The remainder of individuals—those who are
retired, students, providing care for children or other family members and any others who are not
currently employed or seeking employment—are categorized as not in the labor force (BLS
2012).
Of those individuals who are of working age in the study area, approximately 48.7 percent on
average are employed and nearly 5 percent are unemployed (ACS 2012). The remaining 46
percent of these individuals, on average, are not currently in the labor force. Table 2 provides
these percentages for each county in the study area.
Table 2 Labor Force Participation by County for Study Area
Employed Unemployed Not in Labor Force
Boyd 43.88% 6.83% 49.29%
Cabell 51.47% 4.61% 43.92%
Kanawha 56.06% 4.71% 39.23%
Lawrence 49.81% 4.99% 45.20%
Lincoln 39.25% 4.30% 56.45%
Mason 46.24% 4.33% 49.43%
Putnam 56.80% 3.30% 39.89%
Wayne 45.81% 4.13% 50.06%
2012 American Community Survey (ACS): 3-year average8 2009-2011.
Discussion of Results: Economic Impact
Operating Impact
The operating impact of the Big Sandy Superstore Arena on the eight-county study area is
determined by the direct, indirect and induced effects calculated by the IMPLAN© software.
These effects are measured in four main categories:
Employment
Labor income
Value added
Output.
8
Ibid.
15In this model, employment is measured in full-time
equivalent (FTE) employment and measures the number of I always have a blast
full-time equivalent positions being directly and indirectly [at] the Big Sandy
affected by the presence of the Arena as well as those Superstore Arena!!
positions induced as a result of indirect spending.
Employment numbers provided in the following results
section reflect FTEs, so it is important to note that both full- —2012 Attendee
and part-time positions are included. Survey Respondent
Labor income is inclusive of all types of employment income. This includes employee
compensation, such as wages and benefits, as well as proprietor income (MIG 2012). Total
output reflects the value of industry production (MIG 2012).
Value added is slightly more involved. MIG, Inc., the creators of the IMPLAN© economic
impact software, defines value added as
“the difference between an industry’s or an establishment’s total output and the
cost of its intermediate inputs. It equals gross output (sales or receipts and other
operating income, plus inventory change) minus intermediate inputs
(consumption of goods and services purchased from other industries or imported”
(MIG 2012).
This category includes such criteria as compensation of employees, taxes on production and
imports less subsidies and gross operating surplus (MIG 2012).
Direct, Indirect and Induced Output
The IMPLAN© model computes the direct, indirect and induced impact resulting from the
presence of the Arena on the specified eight-county region. Output from the model is measured
by employment, labor income, value added to the economy and total monetary output, shown in
Table 3. As a result of this model, it is estimated that a total of 190 jobs are attributed to the
presence of the Big Sandy Superstore Arena. Approximately 136 of these jobs result from direct
employment.
Table 3 Economic Impact of the Big Sandy Superstore Arena: Output
Impact Employment Labor Income Total Value Added Output
Direct Effect 136.3 $3,463,613 $4,778,514 $10,949,632
Indirect Effect 25.8 $1,051,406 $1,664,180 $2,937,795
Induced Effect 27.5 $1,038,129 $1,866,221 $3,065,028
Total Effect 189.7 $5,553,147 $8,308,915 $16,952,455
Total labor income stemming from total employment exceeded $5.5 million. Roughly 62 percent
of total labor income results from direct effects of the Arena while nearly 38 percent of total
labor income results from indirect and induced effects (approximately 19 percent each). Overall,
the total effect of the Arena on the specified region is estimated to be nearly $17 million.
16Due to the number of people drawn into Huntington for Arena events, local businesses realize a
noticeable increase in patronage and plan for additional staffing around the Arena event
schedule. The impact of the Arena on local businesses is evident from manager testimony.
According to Rob McCleery, General Manager for the Max & Erma’s restaurant located at
Pullman Square, “There is a positive impact. … We keep a handle on when things are going on
over there. It has an impact” (McCleery 2013).
Top 10 Sectors
The IMPLAN© software identifies the top 10 industries (or sectors) affected as a result of the
Arena’s impact. The software provides the top 10 ranking industries by four categories:
Employment
Labor income
Value added
Output.
Industries most affected by employment are provided in Table 4. The “promoters of performing
arts and sports and agents for public figures” industry—the industry in IMPLAN© in which
facilities such as the Big Sandy Superstore Arena is identified—is ranked highest by
employment with 77 employees. The “food services and drinking places” industry is ranked
second highest; approximately 47 positions are created in this industry in the local economy as a
result of the Arena. Other sectors in the top 10 ranking include private hospitals, health
practitioners’ offices, and “civic, social, professional and similar organizations” where
approximately two positions are created in each industry.
Table 4 Top 10 Sectors by Employment
Sector/Industry Total Employment
Promoters of performing arts and sports and agents for public figures 76.9
Food services and drinking places 46.8
Hotels and motels, including casino hotels 11.7
Retail Stores - General merchandise 5.8
Retail Stores - Gasoline stations 2.6
Real estate establishments 2.5
Insurance agencies, brokerages, and related activities 2.4
Private hospitals 1.9
Offices of physicians, dentists, and other health practitioners 1.6
Civic, social, professional, and similar organizations 1.5
17Industries most affected by labor income are provided in Table 5. As with sectors most affected
by total employment, the “promoters of performing arts and sports and agents for public figures”
industry is the largest by labor income (approximately $2.2 million) and the “food services and
drinking places” sector is second largest by labor income (approximately $887,000). The tenth
largest sector by labor income is “management, scientific and technical consulting services,”
estimated at just over $61,000.
Table 5 Top 10 Sectors by Labor Income
Sector/Industry Total Labor Income
Promoters of performing arts and sports and agents for public figures $2,201,998
Food services and drinking places $887,062
Hotels and motels, including casino hotels $304,356
Retail Stores - General merchandise $157,980
Offices of physicians, dentists, and other health practitioners $137,108
Insurance agencies, brokerages, and related activities $125,155
Private hospitals $122,721
Wholesale trade businesses $87,808
Retail Stores - Gasoline stations $71,565
Management, scientific, and technical consulting services $61,398
Industries most affected by total value added are provided in Table 6. The “promoters of
performing arts and sports and agents for public figures” and “food services and drinking places”
sectors (estimated to be $2.8 million and $1.3 million, respective) remain the two largest
industries when sorted by total value added. The “insurance carriers” sector is the tenth largest
industry by total value added, estimated at nearly $140,000.
Table 6 Top 10 Sectors by Total Value Added
Sector/Industry Total Value Added
Promoters of performing arts and sports and agents for public figures $2,834,765
Food services and drinking places $1,256,863
Hotels and motels, including casino hotels $542,585
Imputed rental activity for owner-occupied dwellings $332,130
Retail Stores - General merchandise $257,054
Real estate establishments $235,754
Insurance agencies, brokerages, and related activities $178,590
Wholesale trade businesses $150,770
Offices of physicians, dentists, and other health practitioners $146,266
Insurance carriers $139,638
18Industries most affected by total output are provided in Table 7. The largest sector by total output
is the “promoters of performing arts and sports and agents for public figures” industry with an
estimated total output of more than $6.1 million. The “food services and drinking places” sector
is second largest at an estimated $2.6 million in total output. The sector including “offices of
physicians, dentists and other health practitioners” is tenth largest by total output, estimated to be
nearly $237,000.
Table 7 Top 10 Sectors by Total Output
Sector/Industry Total Output
Promoters of performing arts and sports and agents for public figures $6,120,093
Food services and drinking places $2,591,182
Retail Nonstores - Direct and electronic sales $1,156,243
Hotels and motels, including casino hotels $1,102,561
Imputed rental activity for owner-occupied dwellings $436,437
Real estate establishments $325,395
Retail Stores - General merchandise $292,138
Private hospitals $273,260
Insurance agencies, brokerages, and related activities $263,567
Offices of physicians, dentists, and other health practitioners $236,864
Overall, the “promoters of performing arts and sports and agents for public figures” and “food
services and drinking places” industries maintained first and second place ranks in each of the
four categories. The hotels and motels industry was ranked third by employment, labor income
and total value added and was ranked fourth by total output.
Tax Revenue and the Tax Model
The State of West Virginia benefits from State and local revenue generated from the Big Sandy
Superstore Arena and the spending supported through its activities. The total estimated amount
of tax revenue created by direct employment is $399,621. When indirect and induced
employments are included, total estimated tax revenue exceeds $1 million.
The amount of additional tax dollars attributable from direct, indirect and induced income
produced from operation of the Arena is provided in Table 8. It should be noted that the
“recapture effect” is not considered in this report and therefore these estimates are conservative
in the regard that the Arena may very well keep in-state tourists here rather than traveling
elsewhere for similar experiences and/or events.
This tax revenue can be attributed to the presence of the Big Sandy Superstore Arena and the
direct, indirect and induced employment it supports. This revenue is beneficial to the State of
West Virginia and the local area.
19Table 8 Impact of the Big Sandy Superstore Arena on West Virginia Tax Revenue
Direct Total
Initial Business Taxes $222 $563
Business Taxes $70,224 $177,621
Consumer Sales & Use Taxes $114,064 $288,506
Personal Taxes $158,262 $400,297
Excise Taxes $54,655 $138,240
Miscellaneous Fees and Transfers $1,593 $4,029
Taxes Collected by Counties $600 $1,518
Total $399,621 $1,010,774
It is important to note that this tax revenue estimation only includes the impact on the State of
West Virginia. Because of limited payroll detail of employees who live in other states, namely
Kentucky and Ohio, calculating a similar tax revenue impact for these two states would prove
difficult. For purposes of this report, the impact of tax revenue calculated here is indicative of
income the State of West Virginia would receive only.
Discussion of Results: Attendee Survey
A sufficient number of responses to the attendee survey were provided to ensure that the results
are statistically significant. What follows in this section is a discussion of the survey results in
detail. The first four subsections (and subsequent parts of each subsection) discuss survey results
by all respondents. The fifth subsection, “Discussion of Survey Results by Region,” discusses
survey results for those respondents inside and outside the eight-county study area.
Survey Respondent Spending at Arena Events
Survey respondents were asked a variety of questions to analyze typical spending habits and
patterns while attending Arena events. These questions were divided between purchases made
while inside the Arena (such as food and beverage concessions and merchandise) and those made
outside the Arena (such as visiting a restaurant or staying overnight in an area hotel) while
attending a typical event. Once aggregated by attendee spending categories, a weighted average9
of per respondent spending was calculated for each expense. It is important to note that those
responses which were deemed excessive were removed from the calculations to provide a
conservative estimate.
9
Because not all survey respondents participated in and spent money on every expenditure listed, it is not assumed
that this rate applies to all visitors of Arena events.
20Spending Inside the Arena
Three expenditure categories were used to estimate attendee spending inside the Arena while
attending a typical event. Respondents were first asked whether purchases in any of the three
expenditure categories were made while attending a typical event at the Arena. Nearly 88 percent
of attendees answered that they typically purchase beverages during events and 73.2 percent
typically purchase merchandise. Approximately 56 percent of attendees typically purchase food
at Arena events. The breakdown of in-Arena purchases is provided in Figure 5.
Figure 5 In-Arena Purchases by Respondents during a Typical Arena Event
100.0%
90.0%
80.0%
70.0%
60.0%
Percent
50.0%
40.0%
30.0%
20.0%
10.0%
0.0%
Food Beverages Merchandise
Expenditure Category
21As a follow-up, respondents were asked to quantify the amount typically spent in each category
during a typical event at the Arena. The weighted average of the spending was then calculated to
determine average per-person spending at a typical Arena event. On average, attendees spent
$20.41 on food, $24.58 on beverages and $60.03 on merchandise per respondent while inside the
Arena. These values are provided graphically in Figure 6.
Figure 6 Average In-Arena Respondent Spending during a Typical Arena Event
$70.00
$60.00
$50.00
Average Spending
$40.00
$30.00
$20.00
$10.00
$0.00
Food Beverages Merchandise
Expenditure Category
22Spending Outside the Arena
Respondents were asked to identify categories of spending occurring outside the Arena during a
typical Arena event. Such spending would have occurred at an external location (such as an area
restaurant or local gas station) and is meant to quantify spending occurring in the region as a
result of the presence of the Arena. Most respondents identified spending money at an area
restaurant and parking (83.2 percent and 73.9 percent, respectively) while attending a typical
Arena event. Few respondents reported purchases related to souvenir shopping and visiting other
attractions (7 percent and 4.6 percent, respectively) while attending a typical Arena event. Figure
7 provides attendee responses by expenditure category for out-of-Arena purchases at a typical
Arena event.
Figure 7 Out-of-Arena Purchases by Respondents during a Typical Arena Event
90.0%
80.0%
70.0%
60.0%
Percent
50.0%
40.0%
30.0%
20.0%
10.0%
0.0%
Expenditure Category
23Based on attendee responses, average spending on an overnight hotel stay was the costliest
expenditure category ($123.73 per respondent10) followed by retail shopping ($81.22 per
respondent). Average spending on parking ($6.39 per respondent) was the least costly
expenditure category. Average out-of-Arena spending per respondent during a typical Arena
event is provided in Figure 8.
Figure 8 Average Out-of-Arena Respondent Spending during a Typical Arena Event
$140.00
$123.73
$120.00
$100.00
Average Spending
$81.22
$80.00
$59.71 $54.16 $52.67
$60.00
$51.03
$46.71
$37.50
$40.00
$20.00
$6.39
$0.00
Expenditure Category
10
Please note: as with all other survey respondent spending weighted averages, not all respondents reported an
overnight hotel stay. This per respondent spending is representative of the proportion who listed this expenditure
only.
24Respondent Behavior Related to Big Sandy Superstore Arena Events
The majority of survey respondents (76.7 percent) have attended a Big Sandy Superstore Arena
event within the past year. Of those, just over half (52.3 percent) have attended either two or
three events in that timeframe. The number of events attended by survey respondents is provided
in Figure 9.
Figure 9 Number of Arena Events Attended by Survey Respondents in the Past Year
60.0%
50.0%
40.0%
Percent
30.0%
20.0%
10.0%
0.0%
One Two or Four or five Six or Eight or Ten or Unsure
three seven nine more
Events Attended in Past Year
25When asked how many events at the Big Sandy Superstore Arena had been attended in total,
approximately 42 percent of respondents answered they had attended 10 or more. The
distribution of the remaining responses was fairly even. The number of events attended in total at
the Big Sandy Superstore Arena is illustrated in Figure 10.
Figure 10 Number of Arena Events Attended in Total by Survey Respondents
45.0%
40.0%
35.0%
30.0%
Percent
25.0%
20.0%
15.0%
10.0%
5.0%
0.0%
One Two or Four or five Six or Eight or Ten or Unsure
three seven nine more
Events Attended in Total
Survey respondents were asked to identify all sources used for notification of upcoming events at
the Big Sandy Superstore Arena. Each respondent was given the opportunity to choose all
applicable sources. As a result, attendees may have indicated more than one source.
As is shown in Table 9, e-mail communication is the source most identified to notify attendees of
upcoming events (an excess of 61 percent of respondents). Nearly 57 percent of respondents
identified the radio as a source for Arena event information. The Arena website was highly used
by respondents (over 42 percent). Very few respondents answered that brochures and/or mailings
provided a significant source of information of upcoming events at the Arena.
Table 9 Notification of Upcoming Arena Events by Source
Source Percent Source Percent
E-Mail 61.4% Performer/Artist Website 24.7%
Radio 56.8% Newspaper 18.2%
Big Sandy Superstore Arena Website 42.2% Other Website 9.3%
Social Media 34.8% Mailing 1.7%
Word of Mouth 32.6% Brochure 0.8%
Television 25.6% Other 0.0%
26You can also read