How Does the Arctic Sea Ice Affect the Interannual Variability of Tropical Cyclone Activity Over the Western North Pacific? - Frontiers
←
→
Page content transcription
If your browser does not render page correctly, please read the page content below
ORIGINAL RESEARCH
                                                                                                                                              published: 14 May 2021
                                                                                                                                      doi: 10.3389/feart.2021.675150

                                             How Does the Arctic Sea Ice Affect
                                             the Interannual Variability of Tropical
                                             Cyclone Activity Over the Western
                                             North Pacific?
                                             Hao Fu 1,2 , Ruifen Zhan 2,3* , Zhiwei Wu 2,3 , Yuqing Wang 4 and Jiuwei Zhao 2,5
                                             1
                                              Shanghai Typhoon Institute of China Meteorological Administration, Shanghai, China, 2 Department of Atmospheric
                                             and Oceanic Sciences, Institute of Atmospheric Sciences, Fudan University, Shanghai, China, 3 CMA-FDU Joint Laboratory
                                             of Marine Meteorology, Shanghai, China, 4 Department of Atmospheric Sciences, International Pacific Research Center,
                                             School of Ocean and Earth Science and Technology, University of Hawaii at Manoa, Honolulu, HI, United States, 5 Division
                                             of Environmental Science and Engineering, Pohang University of Science and Technology, Pohang, South Korea

                           Edited by:
                           Wen Chen,
                                             Although many studies have revealed that Arctic sea ice may impose a great impact
      Institute of Atmospheric Physics       on the global climate system, including the tropical cyclone (TC) genesis frequency
                         (CAS), China        over the western North Pacific (WNP), it is unknown whether the Arctic sea ice could
                         Reviewed by:        have any significant effects on other aspects of TCs; and if so, what are the involved
                     Jingliang Huangfu,
      Institute of Atmospheric Physics       physical mechanisms. This study investigates the impact of spring (April-May) sea ice
                            (CAS), China     concentration (SIC) in the Bering Sea on interannual variability of TC activity in terms
                         Pang-chi Hsu,
      Nanjing University of Information
                                             of the accumulated cyclone energy (ACE) over the WNP in the TC season (June-
       Science and Technology, China         September) during 1981–2018. A statistical analysis indicates that the spring SIC in
                  *Correspondence:           the Bering Sea is negatively correlated with the TC season ACE over the WNP. Further
                          Ruifen Zhan        analyses demonstrate that the reduction of the spring SIC can lead to the westward
                 zhanrf@fudan.edu.cn
                                             shift and intensification of the Aleutian low, which strengthens the southward cold-air
                   Specialty section:        intrusion, increases low clouds, and reduces surface shortwave radiation flux, leading to
         This article was submitted to       cold sea surface temperature (SST) anomaly in the Japan Sea and its adjacent regions.
                Atmospheric Science,
               a section of the journal      This local cloud-radiation-SST feedback induces the persistent increasing cooling in
            Frontiers in Earth Science       SST (and also the atmosphere above) in the Japan Sea through the TC season. This
           Received: 02 March 2021           leads to a strengthening and southward shift of the subtropical westerly jet (SWJ) over
            Accepted: 16 April 2021
            Published: 14 May 2021
                                             the East Asia, followed by an anomalous upper-level anticyclone, low-level cyclonic
                               Citation:
                                             circulation anomalies, increased convective available potential energy, and reduced
    Fu H, Zhan R, Wu Z, Wang Y and           vertical wind shear over the tropical WNP. These all are favorable for the increased ACE
  Zhao J (2021) How Does the Arctic          over the WNP. The opposite is true for the excessive spring SIC. The finding not only
          Sea Ice Affect the Interannual
 Variability of Tropical Cyclone Activity    has an important implication for seasonal TC forecasts but also suggests a strengthened
      Over the Western North Pacific?        future TC activity potentially resulting from the rapid decline of Arctic sea ice.
            Front. Earth Sci. 9:675150.
      doi: 10.3389/feart.2021.675150         Keywords: tropical cyclones, accumulated cyclone energy, sea ice, Bering Sea, subtropical westerly jet

Frontiers in Earth Science | www.frontiersin.org                                   1                                             May 2021 | Volume 9 | Article 675150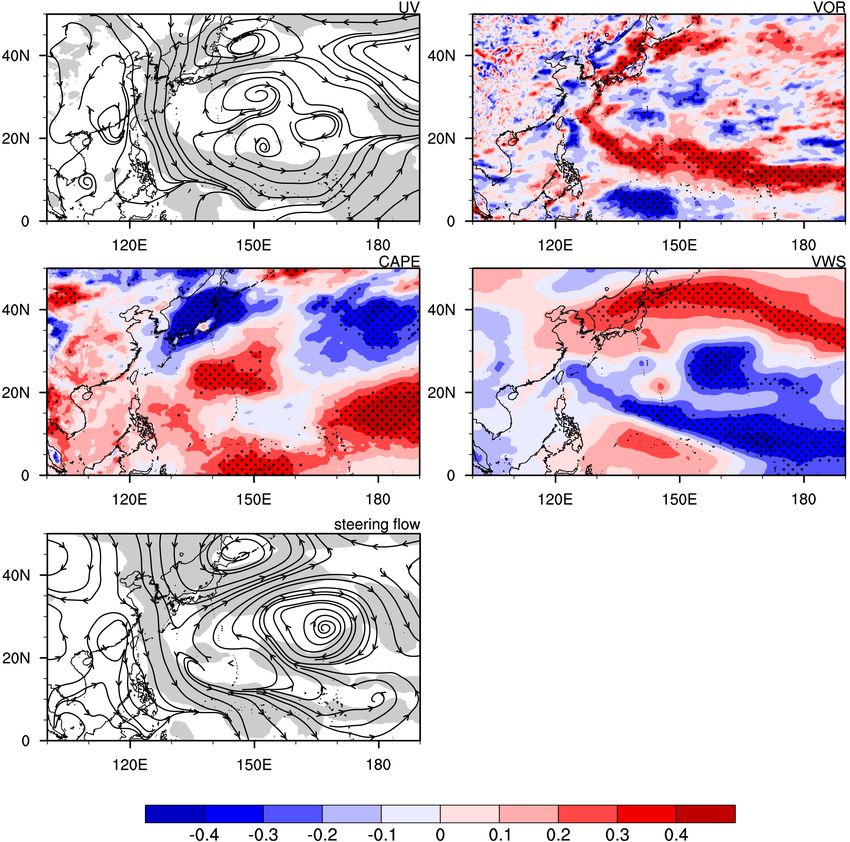
Fu et al.                                                                                                                         Sea Ice and WNP TCs

INTRODUCTION                                                                    Screen et al., 2013). Both observational and modeling studies
                                                                                manifested that there was a link between atmospheric circulations
Tropical cyclone (TC) activity over the western North Pacific                   at lower latitude and Arctic temperature/sea ice, but the
(WNP) exhibits strong interannual variability (Wang and Chan,                   corresponding mechanism of atmospheric circulation response
2002; Chan and Liu, 2004; Camargo and Sobel, 2005; Zhao et al.,                 at lower latitude remained uncertain. For example, some studies
2011; Zhan and Wang, 2016). Fox example, TC number over the                     revealed that the rise of Arctic temperature would reduce the
WNP was notably high in 2015 with 13 category 4–5 TCs, but                      equator-to-pole surface temperature gradient, and then weaken
extremely low in 1999 without any category 4–5 TCs. Therefore,                  the mid-latitude westerly jets (Schneider et al., 2014; Screen,
to understand the observed interannual variability of TC activity               2014). However, Wu et al. (2016) found that the decrease in Arctic
and the related physical processes has been a topic of great                    sea ice sustaining from winter to next spring would accelerate
interest in the last decades (Chia and Ropelewski, 2002; Chan and               the East Asian subtropical westerly jet (SWJ), a narrow-and-
Liu, 2004; Camargo and Sobel, 2005; Chan, 2005; Fan, 2007; Du                   fast westerly band extending from Asia to the North Pacific
et al., 2011; Zhan et al., 2011a,b, 2013; Tao et al., 2012; Zhang et al.,       in the upper-troposphere during boreal summer, by triggering
2015; Zhan and Wang, 2016; Gao et al., 2018).                                   a Rossby wave train. Smith et al. (2017) also showed that a
    Many previous studies have revealed the relationship between                local low pressure anomaly induced by Arctic warming could
El Niño-Southern Oscillation (ENSO), the strongest interannual                  strengthen the mid-latitude westerlies. In fact, compared with the
signal in the tropics, and TC activity over the WNP (Chia and                   background circulation, the remote impact of Arctic sea ice on the
Ropelewski, 2002; Chan and Liu, 2004; Camargo and Sobel, 2005;                  lower-latitude circulation is more likely to be important (Walsh,
Chan, 2005; Huangfu et al., 2018, 2019). During the El Niño                     2014; Woolings et al., 2014).
years, TC genesis location shifts to the southeastern quadrant of                   Several studies found a negative correlation between sea ice
the WNP, and most TCs tend to achieve higher intensity due                      concentration (SIC) in the Okhotsk Sea from preceding winter
to an increase in their lifetime over the open ocean. A recent                  to spring and the annual TC frequency in the TC season over
study has further shown that stronger ENSO events are likely to                 the WNP (Fan, 2007; Fan and Wang, 2009). Fan and Wang
have more notable impact on TC activity over the WNP (Zhan                      (2009) thus introduced the winter sea ice index as a predictor to a
et al., 2018). In addition to ENSO, the sea surface temperature                 statistical forecast model for seasonal TC genesis frequency over
(SST) anomalies (SSTA) over the East Indian Ocean (EIO) were                    the WNP and showed good prediction skill. They attributed the
shown to play an important role in modulating TC genesis                        relationship between the SIC and the TC genesis frequency to the
frequency over the WNP (Du et al., 2011; Zhan et al., 2011a,b;                  North Pacific Oscillation (NPO) triggered by the SIC in spring,
Tao et al., 2012). In the years with cold SSTA over the EIO,                    which led to the dynamic and thermodynamic condition changes
the genesis frequency of weak TCs is significantly higher than                  over the WNP maintaining from spring to the TC season by a
in the years with warm SSTA (Du et al., 2011; Zhan et al.,                      teleconnection wave train. Since Arctic sea ice has a strong impact
2011a; Tao et al., 2012) although the EIO SSTA has no significant               on the global climate system and shows a significant influence
effect on TC genesis location and the frequency of strong TCs                   on TC genesis frequency over the WNP, a natural question arises
(Zhan et al., 2011a). The SST gradient (SSTG) between the                       as to whether Arctic sea ice could have any significant effects
Southwest Pacific and the western Pacific warm pool was found to                on other aspects of WNP TCs, such as TC intensity, lifespan,
trigger a cross-equatorial pressure gradient, which exerts a strong             and track; and if so, what are the involved physical mechanisms.
influence on the air-sea interaction over the tropical Pacific,                 In addition, previous studies have shown that the SWJ plays an
greatly modulating WNP TC genesis frequency and intensity                       important role in affecting the weather and climate over East
over the WNP (Zhan et al., 2013; Zhan and Wang, 2016). More                     Asia and the WNP (Liang and Wang, 1998; Zhao et al., 2015).
recently, several studies also have suggested that the Pacific                  The SWJ can also affect TC activity, including genesis, structure
Meridional Mode (PMM) can modulate the interannual variation                    and intensity changes, and even TC extratropical transition (Park
of WNP TC activity, with more and stronger TCs in the positive                  et al., 2009; Cowan and Hart, 2020). Since the anomalous Arctic
PMM phase (Zhang et al., 2015; Gao et al., 2018). The modulation                sea ice would exhibit an important influence on the SWJ (Wu
of TC activity by the PMM is mainly through the anomalous                       et al., 2016), the Arctic sea ice might modulate TC activity over
zonal vertical wind shear (VWS), especially in the southeastern                 the WNP through affecting the SWJ.
quadrant of the WNP.                                                                Different from Fan (2007), who focused on the relationship
    In the last decade or so, more and more attentions have been                between TC genesis frequency and the Arctic sea ice in the
paid to changes in Arctic sea ice because its anomalies may                     Okhotsk Sea, in this study, we focus on how the Arctic sea ice
impose a great impact on the global climate system (Royer et al.,               in the Bering Sea in spring affects the interannual variability of
1990; Deser and Teng, 2008). The polar amplification–a feature                  TC activity over the WNP in terms of the accumulated cyclone
with temperatures warming faster in the Arctic than the rest of                 energy (ACE), which reflects not only TC genesis frequency but
the Earth was widely accepted. Namely, the surface temperature                  also the prevailing TC tracks, intensity, and lifetime (Bell et al.,
at high latitude would affirmatively respond to the change                      2000; Camargo and Barnston, 2009; Kim et al., 2013; Zhan and
of local sea ice (Barnes, 2013; Screen and Simmonds, 2013).                     Wang, 2016). We found that the spring SIC anomaly has a
Several studies have found that Arctic temperature anomalies can                significant impact on the interannual variability of TC ACE over
influence the atmospheric circulation and weather patterns in the               the WNP in the TC season with higher/lower ACE in response to
Northern Hemisphere (Balmaseda et al., 2010; Rinke et al., 2013;                the reduced/increased spring SIC. We will show that the spring

Frontiers in Earth Science | www.frontiersin.org                            2                                       May 2021 | Volume 9 | Article 675150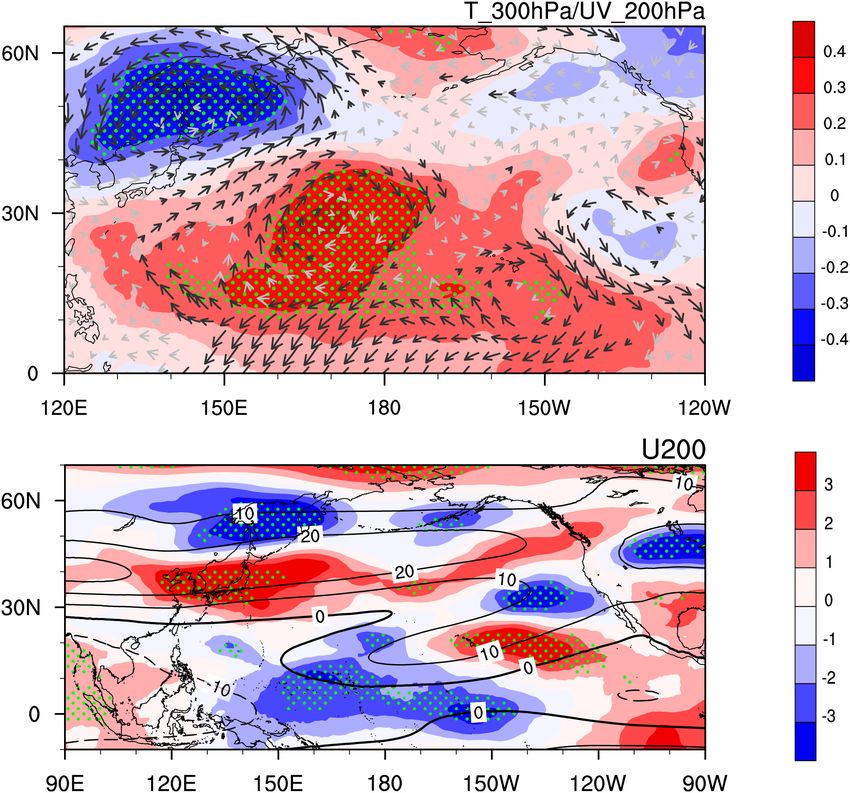
Fu et al.                                                                                                                            Sea Ice and WNP TCs

SIC triggers a cloud-radiation-SST feedback in the Japan Sea and
its adjacent regions, inducing large-scale conditions over East
Asia and the WNP and significantly affecting TC activity over the
WNP. The remainder of the paper is organized as follows. Section
“Data and Methodology” describes the datasets and analysis
methods used in this study. The statistical relationship between
Artic sea ice and TC ACE over the WNP is examined in Section
“Results From Statistical and Regression Analyses.” The possible
mechanisms are elucidated in Section “Possible Mechanisms”
based on both diagnostic analyses and climate model sensitivity
experiments. Major conclusions are summarized and discussed in
the last section.

DATA AND METHODOLOGY
All TC statistics were based on the 6-hourly TC best-track data
for the WNP during 1981–2018 from the Joint Typhoon Warning
Center (JTWC). To minimize subjectivity in the identification of            FIGURE 1 | Spatial distribution of standard deviations of sea ice
weak systems, we focused on TCs with maximum sustained 10-m                 concentration (shaded; %) north of 55◦ N in spring (April-May). The red boxes
                                                                            indicate the regions of Bering Sea (178◦ E–160◦ W, 57◦ –68◦ N) and Barents
wind speed larger than 35 knots. The result from the calculated             Sea (27◦ –65◦ E, 67◦ –80◦ N), respectively.
monthly correlation between the spring SCI and ACE shows
that the spring SIC has relatively low negative correlation with
October and November ACE over the WNP, suggesting that the
                                                                           Bering Sea (178◦ E–160◦ W, 57◦ –68◦ N) and the western region
influence of the spring SIC could last until September. Thus, in
                                                                           over the Barents Sea (27◦ –65◦ E, 67◦ –80◦ N) based on Figure 1.
this study, the TC season was defined from June to September
                                                                           Two SST indices were defined as the SST anomalies averaged,
(JJAS) each year.
                                                                           respectively, in the Japan Sea (30–50◦ N,128◦ –150◦ E) and the
   Several integrated TC metrics have been used to represent TC
                                                                           tropical central Pacific (CP, 160◦ E–160◦ W, 0◦ –20◦ N) based on
activity, such as the number of intense TCs, TC days, the power
                                                                           Figure 6. Note that here the Japan Sea is referred to the region
dissipation index (PDI) – a measure of the accumulated wind
                                                                           including both the Japan Sea and its adjacent regions for the
power destructiveness of all TCs (Emanuel, 2005), and the ACE –
                                                                           convenience of following discussion. The last index is the SWJ
an integrated measure of TC activity (Bell et al., 2000). Since TC
                                                                           index, which was defined as the zonal wind at 200-hPa averaged
activity includes not only genesis frequency but also prevailing
                                                                           in the region of 30◦ –45◦ N, 130◦ –180◦ E. All data and indices were
tracks, intensity, and lifetime, an integrated variable is better to
                                                                           linearly detrended before further analysis since we focused on the
represent various aspects of TC activity. In this study, we used
                                                                           interannual variability in this study.
ACE as the measure of the overall TC activity, which is defined
                                                                               The algorithm of Ashok et al. (2003) was used to subtract
as the sum of the square of the maximum sustained 10-m wind
                                                                           the effect of factor A from another factor B, which has the
speed at 6-h intervals for all TCs over the WNP in the TC season
                                                                           following form:
of each year, with its basic unit of 105 m2 s−2 . To analyze the
spatial ACE distribution, we divided the WNP basin (0◦ –40◦ N,                                    IRB = IB − r(IB , IA )O0 ĨA ,                        (1)
100◦ –180◦ E) into grid boxes of 5◦ longitudes × 5◦ latitudes and
calculated the sum of the square of the maximum sustained 10-m             where IA is index of A, and ĨA denotes the normalized IA . O0 was
wind speed for all TCs passing each grid box.                              the standard deviation of index of B (IB ), while r(IB ,IA ) stands for
   The monthly SIC and SST data at 1◦ longitude × 1◦ latitude              the correlation coefficient between index A and index B. The term
grids were derived from the Hadley Center Sea Ice and Sea                  IRB on the left-hand side is the net signal of index B without the
Surface Temperature dataset (HadISST) (Rayner et al., 2003).               signal of index A.
Since the SIC in the Bering Sea in April-May exhibits the higher              In addition, following Murakami et al. (2014), we quantified
correlation with the ACE over the WNP in the TC season than                the relative contributions to the interannual variability of ACE
that in March-May, we mainly examined the SIC in spring                    by TC genesis frequency, track, intensity, and the non-linearity
(April-May) as a potential preceding signal. The monthly mean              of the first three factors. The climatological mean of ACE in a
atmospheric data at 0.25◦ longitude × 0.25◦ latitude grids were            specific grid box A can be written as:
obtained from the ECMWF (European Center for Medium-                                            x
Range Weather Forecasts)’s fifth generation reanalysis (ERA5;                           f (A) =     g(A0 ) t(A, A0 ) v2 (A, A0 )dA0 ,          (2)
                                                                                                     C
Hersbach et al., 2020).
   Five indices were defined in this study based on our following          where f(A) is the ACE in a specific grid box A; an overbar
analyses. Two Arctic sea ice indices were defined as the SIC               indicates the climatological mean; g(A0 ) is the TC genesis
anomalies averaged, respectively, in the eastern region over the           frequency in the grid box A0 ; and t(A, A0 ) is the probability for

Frontiers in Earth Science | www.frontiersin.org                       3                                              May 2021 | Volume 9 | Article 675150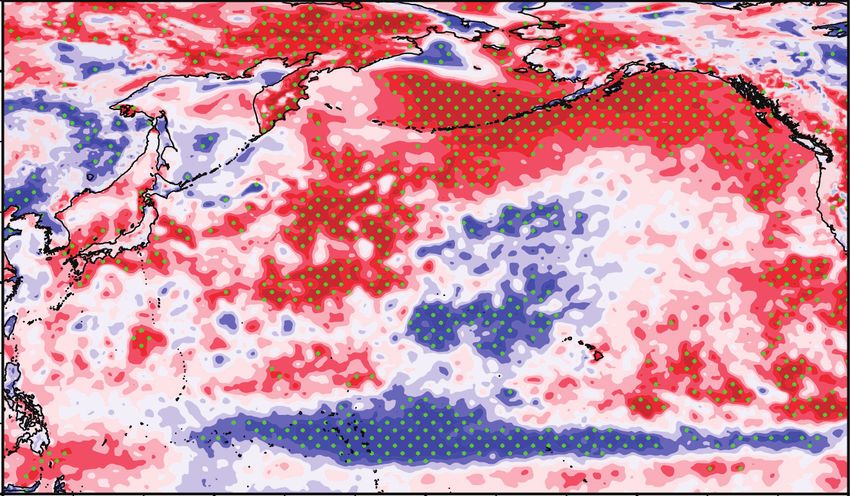
Fu et al.                                                                                                                               Sea Ice and WNP TCs

a TC formed in the grid box A0 to travel into the grid box A.
v2 (A, A0 ) stands for the mean square of maximum wind speed
for TCs in the grid box A and formed in grid box A0 ; and C is the
entire integration domain. For the period 1981–2018, the ACE
anomalies relative to the climatological mean in the grid box A
can be expressed as:
                  x
        f 0 (A) =     g 0 (A0 )t(A, A0 )v2 (A, A0 )dA0
                    c
                    x
                  +       g(A0 )t 0 (A, A0 )v2 (A, A0 )dA0
                       c
                    x
                  +       g(A0 ) t(A, A0 )v20 (A, A0 )dA0 + NL, (3)
                          c

where the prime indicates the corresponding anomaly. Eq. (3) can
quantify the contribution of each factor to the total ACE anomaly
in each given grid box. The terms on the right-hand side represent
the contributions by TC genesis frequency anomaly (first term),
track density anomaly (second term), intensity anomaly (third
term), and the nonlinear effect (fourth term), respectively. The
non-linear term is calculated as:
                  x
           NL =        g 0 (A0 )t 0 (A, A0 )v2 (A, A0 )dA0
                     c
                    x                                                        FIGURE 2 | The relationship between the WNP ACE in the TC season and the
                  +        g(A0 )t 0 (A, A0 )v20 (A, A0 )dA0                 spring SIC in Bering Sea during 1981–2018. (A) Correlation coefficients
                        c
                    x                                                        between them; (B) normalized time series of ACE (line; averaged in the region
                                                                             of 130◦ –160◦ E, 0◦ –40◦ N) and the spring SIC index in the Bering Sea (bar). In
                  +        g 0 (A0 )t(A, A0 )v20 (A, A0 )dA0
                        c                                                    panel (A), the shaded areas in blue (red) indicate the negative (positive)
                    x                                                        correlation significant at 90% confidence level.
                  +        g 0 (A0 )t 0 (A, A0 )v20 (A, A0 )dA0 , (4)
                              c

The fourth-generation atmospheric general circulation model
(AGCM) developed at the Max Planck Institute (Roeckner                      Large spring SIC variability is mainly located in the Bering Sea
et al., 1996), named ECHAM4, was used to conduct sensitivity                and the Barents Sea, followed by some small variability in the
experiments to examine the response of the large-scale                      northern Sea of Okhotsk and on the western and eastern sides
atmospheric circulation to the SST anomalies over the Japan                 of the Greenland. To quantitatively measure the SIC variability,
Sea. The prognostic variables of the model were expressed by                two SIC indices with large variability were defined as introduced
truncated series of spherical harmonics in the horizontal at                in Section “Data and Methodology:” one with the spring SIC
truncation T42 and by the finite-differencing in the hybrid σ–              anomalies averaged in the Bering Sea and the other averaged
pressure coordinate in the vertical with 19 uneven vertical levels.         in the Barents Sea. We calculated the correlations between the
A semi-implicit time-differencing scheme was used for model                 ACE over the WNP in the TC season with the above two spring
time integration. The model physics include the surface turbulent           SIC indices, respectively. The results showed that the ACE has
fluxes calculated based on the Monin–Obukhov similarity theory,             a significant negative correlation with the spring SIC in the
the horizontal diffusion in a hyper-Laplacian form, the ECMWF               Bering Sea, but the correlation with the spring SIC in the Barents
longwave and shortwave radiation schemes, and the convective                Sea is not statistically significant. Therefore, we focused on the
parameterization scheme documented in Nordeng (1994). More                  influence of the spring SIC in the Bering Sea on the ACE over
details about the model can be found in Roeckner et al. (1996).             the WNP in this study. We will refer to the spring SIC over the
                                                                            Bering Sea simply as the spring SIC in our following discussion
                                                                            for convenience without any ambiguity.
                                                                               Figure 2A shows the spatial distribution of correlation
RESULTS FROM STATISTICAL AND
                                                                            coefficients between the spring SIC and ACE over the WNP
REGRESSION ANALYSES                                                         in the TC season. As we can see, although some scattered
                                                                            positive correlations appeared in the southern East China Sea,
Correlations Between the SIC and the                                        the northern Yellow Sea, and east of 170◦ E of the WNP, the
ACE Over the WNP                                                            correlation coefficients between the spring SIC and ACE over the
To determine the key area of the seasonal SIC variability, we               WNP in the TC season were generally negative with significant
calculated the standard deviation of the interannual variability of         correlations between 130◦ E and 150◦ E, with the p-Value less than
the spring SIC anomalies in the high latitudes of the Northern              0.1. We further defined the ACE averaged in the region (130◦ E–
Hemisphere with the spatial distribution shown in Figure 1.                 160◦ E, 0–40◦ N) as an overall ACE index in the WNP basin.

Frontiers in Earth Science | www.frontiersin.org                        4                                               May 2021 | Volume 9 | Article 675150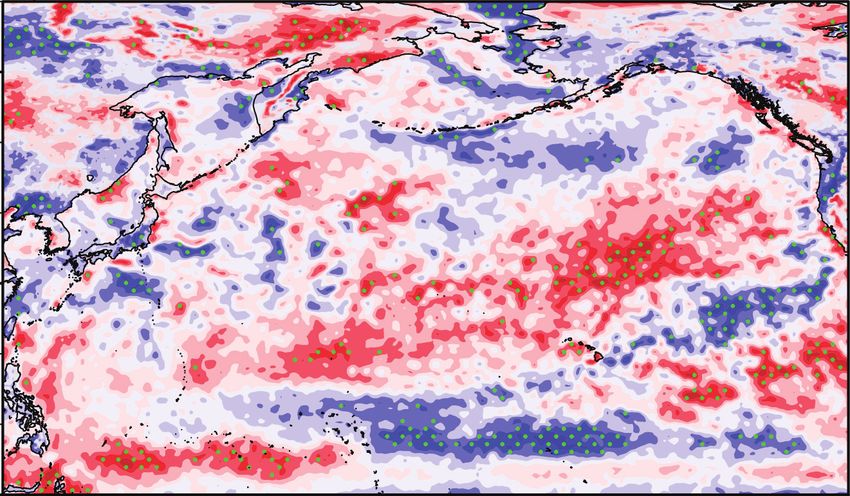
Fu et al.                                                                                                                                          Sea Ice and WNP TCs

TABLE 1 | Correlation matrix among spring SIC index, SST indices in the Japan Sea in spring and the TC season (T-season), SWJ index, and ACE during 1981–2018.

                                    SIC (spring)         SST in Japan Sea (spring)         SST in Japan Sea (T-season)           SWJ (T-season)          ACE (T-season)

SIC (spring)                              1                         −0.16                               –0.38                          –0.31                   –0.47
SST in Japan Sea (spring)                                               1                                0.18                           0.27                    0.1
SST in Japan Sea (T-season)                                                                               1                            –0.44                  −0.19
SWJ                                                                                                                                      1                     0.34
ACE                                                                                                                                                              1

The significant coefficients at the 95% confidence level are in bold.

Figure 2B shows the normalized time series of the ACE index
in the TC season and the spring SIC index during 1981–2018.
Consistent with the result in Figure 2A, the ACE and the
spring SIC are highly correlated with a correlation coefficient
of −0.47 (Table 1), which is statistically significant above 99%
confidence level. This suggests that the spring SIC most likely
have a significant effect on the interannual variability of ACE over
the WNP, with higher (lower) ACE over the WNP in response to
the decreased (increased) spring SIC in the Bering Sea.
   As mentioned above, ACE is an integrated variable including
contributions by TC genesis frequency, prevailing tracks,
intensity, and lifetime. To better understand the impact of the
SIC on TC activity, we calculated the correlations between                                FIGURE 3 | The contributions of TC genesis (dg), TC track (dt), TC intensity
the SIC index and the three aspects of ACE including TC                                   (dv2 ), and the nonlinear effect (dN) to the ACE averaged in the region
genesis frequency, track density, and intensity. The correlation                          (0◦ –40◦ N, 130◦ –160◦ E) calculated using Eq. (3).
coefficients are -0.26, -0.37, and -0.39, for TC genesis, track
density, and intensity, respectively. The first one is statistically
significant at 90% confidence level, while the other two are                             dynamic and thermodynamic factors in the TC season over the
significant above 95% confidence level. This suggests that the                           WNP with respect to the spring SIC during 1981–2018.
spring SIC has a significant influence not only on TC genesis                               Figure 4 shows the regressed 850-hPa winds, 850-hPa relative
frequency, but also on TC tracks and intensity. Further, we                              vorticity, convective available potential energy (CAPE), vertical
examined the individual contributions of TC genesis frequency,                           wind shear between 200 and 850 hPa (VWS), and mass-weighted
tracks, intensity, and the nonlinear effect in Eq. (3) to the                            mean steering flow between 850 and 300 hPa in the TC season
variability in ACE averaged in the region (0◦ –40◦ N, 130◦ –160◦ E)                      over the WNP in response to the negative spring SIC anomaly
with the results shown in Figure 3. Among the four factors,                              during 1981–2018. Namely, the SIC index was multiplied by
the TC track has the largest contribution to the ACE (nearly                             −1 to represent atmospheric response to the reduced SIC
45%), and TC genesis frequency and intensity are the second                              (namely the negative SIC anomaly). As we can see from
and third significant contributors, respectively. In contrast, the                       Figure 4, in response to the reduced SIC, a number of significant
nonlinear effect is negative and small compared to other terms.                          changes occur, including low-level anomalous westerlies over
This indicates that the spring SIC plays an important role in                            the tropical western Pacific and a tripole-pattern circulation
modulating TC genesis frequency, intensity, and tracks in the                            over the WNP with two anomalous cyclones, respectively, in
TC season over the WNP. Especially, the spring SIC can greatly                           the tropical WNP south of 25◦ N and east of the Japan Sea,
affect TC tracks. Note that TC tracks in the region north of                             with an anomalous anticyclone in between; an increase in the
20◦ N show larger contribution than that south of 20◦ N (figure                          low-level cyclonic vorticity and the CAPE, and the decrease in
not shown), suggesting that the reduced (increased) spring                               VWS over the tropical WNP between 10◦ N and 30◦ N. All these
SIC is favorable (unfavorable) for the northward shift of TC                             responses are favorable for convective activity and TC genesis
activity over the WNP.                                                                   and intensification in the main TC activity region over the
                                                                                         WNP (Weisman and Klemp, 1982; Emanuel, 1994; Rasmussen
Large-Scale Circulation Response Over                                                    and Blanchard, 1998). In contrast to the anomalous low-level
the WNP in the TC Season                                                                 circulation that are favorable for TC activity in the tropical
Since the ACE in the WNP TC season is negatively correlated                              and subtropical WNP, the response of both CAPE and VWS to
with the spring SIC in the Bering Sea, it is expected that the large-                    the reduced SIC seems to suppress TC activity near the Japan
scale thermodynamic and dynamic conditions closely associated                            Sea. However, the anomalous northward steering flow north
with TC activity over the WNP in the TC season should be also                            of 30◦ N around Japan is conducive to more TCs approaching
correlated with the spring SIC in the Bering Sea. To confirm                             Japan (Figure 4E). This is consistent with a significant but weak
this consistency, we have done regression analyses for various                           negative correlation of the ACE in the TC season with the spring

Frontiers in Earth Science | www.frontiersin.org                                     5                                              May 2021 | Volume 9 | Article 675150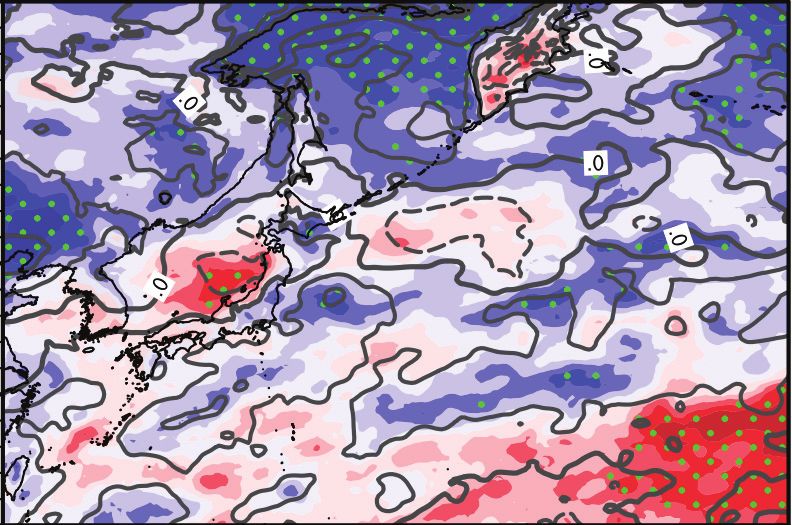
Fu et al. Sea Ice and WNP TCs
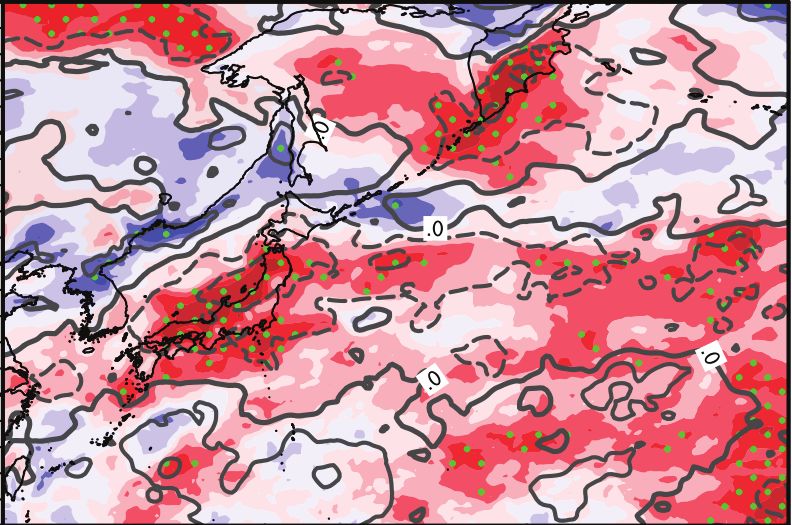
FIGURE 4 | Regressed (A) wind field (m s−1 ) at 850 hPa, (B) relative vorticity (10−6 s−1 ) at 850 hPa, (C) CAPE (10−2 J kg−1 ), (D) vertical wind shear (m s−1 )
between 200 and 850 hPa, and (E) mass-weighted steering flow between 850 and 300 hPa (m s−1 ) in the TC season with respect to the negative spring SIC index
during 1981–2018. Gray shaded in panels (A,E) and stippling in panels (B-D) denote regions where the regressions are statistically significant above 90%
confidence level based on the Student t-test.
SIC there (Figure 2A). In addition, the anomalous northerly Fischer et al., 2017), we also examined the regressed 300-hPa
and negative low-level vorticity from the Korean Peninsula to temperature, 200-hPa horizontal winds, and 200-hPa zonal winds
east of the Philippines between 115◦ E and 130◦ E in response to in the TC season with respect to the spring reduced SIC,
the reduced spring SIC are generally unfavorable for TC genesis with the results shown in Figure 5. For a comparison, the
and intensification. This is also consistent with the positive climatological mean 200-hPa zonal wind field is also given in
correlation between the spring SIC and the ACE in the region Figure 5B. In response to the reduced SIC, a significant upper-
in the TC season (Figure 2A). level cold anomaly appears over the Japan Sea and strong warm
Since the upper-tropospheric circulation may play some anomalies appear over the tropical Pacific (Figure 5A), which
important roles in TC activity (e.g., Bracken and Bosart, 2000; are consistent with the pattern of the regressed SST anomalies
Frontiers in Earth Science | www.frontiersin.org 6 May 2021 | Volume 9 | Article 675150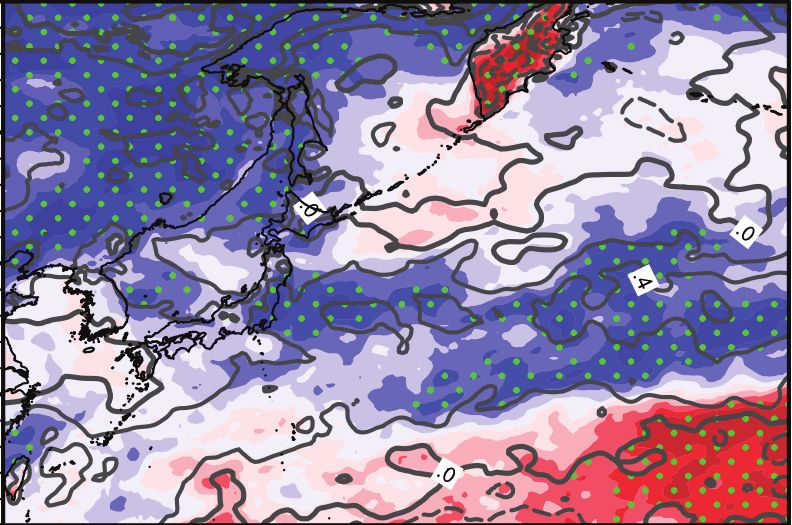
Fu et al.                                                                                                                                      Sea Ice and WNP TCs

  FIGURE 5 | Regressed (A) 300-hPa temperature (shaded; K) and 200-hPa wind field (m s−1 ), and (B) 200-hPa zonal wind (shaded; m s−1 ) in the TC season with
  respect to the negative spring SIC index during 1981–2018. The black arrows in panel (A) and the dots in panels (A,B) denote the areas where the regressions are
  statistically significant above 90% confidence level based on the Student t-test. The contours in panel (B) denote the climatological mean zonal wind at 200 hPa
  (U200).

(figure not shown). Corresponding to the above temperature                            POSSIBLE MECHANISMS
anomaly pattern are an anomalous cyclone over the Japan Sea and
an anomalous anticyclone over the tropical WNP (Figure 5A)                            In the last section, we have shown that the large-scale circulation
together with a strengthened and southward shifted SWJ in                             response to the spring SIC anomaly in the Bering Sea is consistent
the upper troposphere (Figure 5B). These anomalies can be                             with the correlation of the ACE over the WNP in the TC season
inferred from the thermal wind balance because of the increased                       with the spring SIC. A question arises as to how the spring SIC
meridional temperature gradient (Figure 5A).                                          anomaly can impose a delayed impact on TC activity over the
    Previous studies have shown that the anticyclonic circulation                     WNP in the TC season because the direct influence of the SIC
south of the SWJ entrance region can dynamically force                                often weakens quickly in the coming summer. Since the memory
ascending motion, promote moist convection, and thus favorable                        of the atmosphere is relatively short, often less than a month
for TC development and intensification (Moore and Vanknowe,                           (see a review by Zhan et al., 2012), and the ocean has a much
1992; Cowan and Hart, 2020). Corresponding to the strengthened                        longer memory than the atmosphere, we hypothesize that the
and southward shifted SWJ (Figure 5B) is an anomalous                                 ocean response to the spring SIC anomaly and the subsequent
anticyclonic circulation in the upper troposphere (Figure 5A)                         ocean-atmospheric interaction may play a key bridging role in
and increased CAPE (Figure 4C) over the tropical and                                  the connection between the spring SIC in the Bering Sea and
subtropical WNP. Furthermore, we calculated the correlation                           the TC activity over the WNP. As we mentioned above, the SST
between the SWJ index and ACE index in the TC season. The                             anomalies and the upper-tropospheric air temperature anomalies
correlation coefficient between the two indices reaches 0.34,                         over the WNP in the TC season show similar spatial patterns
which is statistically significant at the 95% confidence level                        in response to the spring SIC in the Bering Sea. According to
(Table 1). Therefore, this strongly suggests that the spring SIC                      the thermal wind balance, the southward horizontal temperature
can significantly modulate the SWJ over East Asia and the WNP                         gradient can lead to an increase of westerlies with height. This
throughout the summer, affecting the large-scale dynamic and                          means that the deep air temperature response in the WNP and
thermodynamic atmospheric conditions over the WNP and thus                            the strengthening and southward shift of the SWJ are dynamically
TC activity in the TC season.                                                         balanced. Since the SWJ plays an important role in affecting the

Frontiers in Earth Science | www.frontiersin.org                                  7                                             May 2021 | Volume 9 | Article 675150
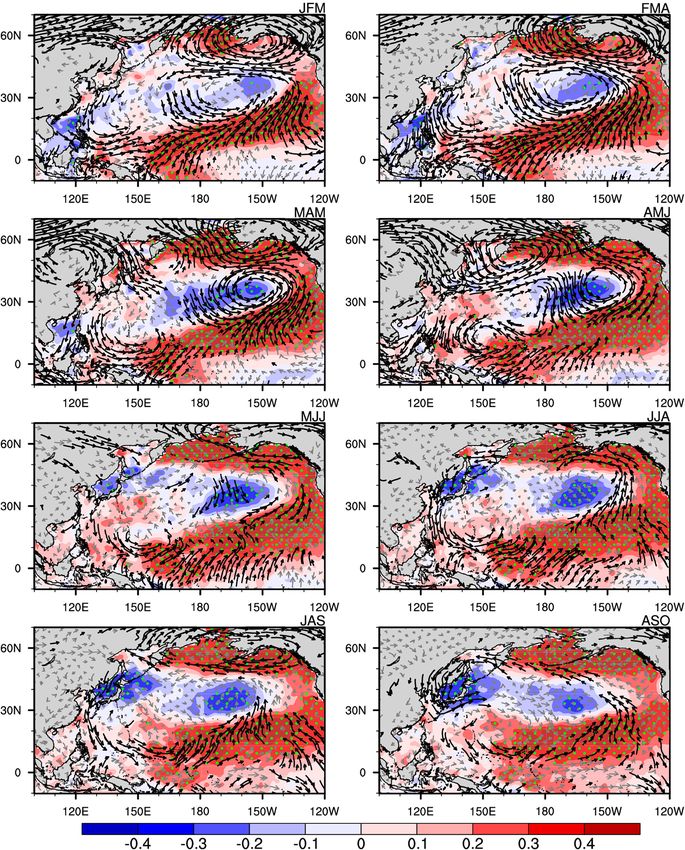
Fu et al.                                                                                                                                     Sea Ice and WNP TCs

  FIGURE 6 | Regressed 3-month moving averaged SST (shaded; ◦ C) and 850-hPa wind (vectors; m s−1 ) fields with respect to the negative spring SIC index from
  March to October. (A) January-March (JFM); (B) February-April (FMA); (C) March-May (MAM); (D) April-June (AMJ); (E) May-July (MJJ); (F) June-August (JJA);
  (G) July-September (JAS); (H) August-October (ASO). The black arrows denote the wind fields significant at 90% confidence level. The dots denote the areas where
  the regressions in SST are significant at 90% confidence level.

Frontiers in Earth Science | www.frontiersin.org                                 8                                             May 2021 | Volume 9 | Article 675150
Fu et al.                                                                                                                           Sea Ice and WNP TCs

WNP thermodynamic and dynamic conditions controlling TC
                                                                             A
activity in the TC season over the WNP, it is key to understand
how the spring SIC causes the SST anomaly pattern over the
WNP and how the SST anomaly pattern persists through the TC
season. Therefore, in this section we explore the possible physical
mechanisms by which the spring SIC anomaly contributes to
the development and maintenance of the SST anomaly pattern,
and affecting the SWJ and thus the TC activity over the WNP
in the TC season.
    Figure 6 shows the regressed 3-month moving averaged SST
and 850-hPa wind fields with respect to the negative SIC index
from March to October. A significant change in the regressed
SST field is found in the Japan Sea with a gradually enhanced
cooling from March-May to August-October, while changes in
SST anomalies in other regions remain small in all seasons.
We further calculated the correlation between the SST index
                                                                             B
in the Japan Sea and the spring SIC index in the Bering Sea
defined in Section “Data and Methodology”. As shown in Table 1,
this insignificant (r = −0.16) correlation in spring turned to
significant (r = −0.38) at the 95% confidence level in the
TC season. This suggests that the reduced spring SIC induces
the cooling in the Japan Sea, and the cooling can intensify
and maintain through the whole TC season. Note that the
cold SST anomaly (and also the cold atmospheric temperature
anomaly above) in the Japan Sea associated with the spring
SIC is located just to the north of the SWJ (Figures 5, 6). The
correlation coefficients between the SWJ index in the TC season
and the spring SIC and between the SWJ index and the SST
index in the Japan Sea in the TC season are -0.31 and -0.44,
respectively, both statistically significant at the 95% confidence
level (Table 1). This indicates that the SST cooling over the
Japan Sea induced by the reduced spring SIC can enhance the
                                                                            FIGURE 7 | Regressed 200-hPa wind field (m s−1 ) in the TC season with
climatological meridional atmospheric temperature gradient and              respect to the negative SST anomaly in the Japan Sea based on panels (A)
thus accelerate the SWJ above.                                              the original data and (B) with the CP SST signal removed during 1981–2018.
    The possible role of the Japan Sea SST in affecting the SWJ             The shaded areas denote where the regressions are statistically significant
in the TC season can be confirmed by regressing the 200-hPa                 above 90% confidence level based on the Student t-test.
winds with respect to the negative SST index in the Japan Sea
in the TC season without and with the CP SST signal removed
using Eq. (1), as shown in Figure 7. Note that the regressed SST           Japan Sea contributes significantly to the SWJ and thus the TC
field with respect to the negative SIC index shows the cold Japan          activity over the WNP.
Sea and warm CP anomalies (Figure 6). Therefore, removing the                 To confirm the above data analysis, we conducted three
CP SST signal is to avoid its significant effect on TC activity over       numerical experiments using the ECHAM4 as briefly described
the WNP (Chen and Tam, 2010) and thus to isolate the primary               in Section “Data and Methodology”. These experiments were
effect of the SST anomaly over the Japan Sea. As expected, the             designed to demonstrate the independent impact of the Japan
negative Japan Sea SST anomaly with the CP SST anomaly signal              Sea SST anomaly on the SWJ in the TC season. The control run
retained induces remarkable anomalous westerlies between 30                was performed with the observed monthly mean climatological
and 40◦ N from 100◦ E to 180◦ E and an anomalous anticyclonic              SST averaged in the period 1981–2018. The two sensitivity
circulation in the upper troposphere south of 30◦ N over the               experiments (cold and warm runs) were identical to the control
tropical WNP (Figure 7A). Such a pattern tends to strengthen the           run except that 1◦ C was subtracted from and added to,
SWJ and provide large-scale environmental conditions favorable             respectively, the SST in the Japan Sea as shown in Figure 8A
for TC activity. This is generally consistent with the atmospheric         from June to September, namely through the TC season. The
response to the negative spring SIC as shown in Figure 5. With             model was integrated for 30 years for each experiment and the
the CP SST anomaly signal removed, the anomalous westerlies                last 25 years were used in the analysis here. The control run
and anticyclonic circulation in response to the cold Japan Sea             generally reproduces reasonably well the observed wind fields
anomaly are still significant and similar to those with the CP             at both 850 hPa and 200 hPa (not shown). Figures 8B–D show
signal retained although the anomalous anticyclone becomes                 the differences in the simulated 300-hPa temperature and 850-
slightly weaker (Figure 7B). Namely, the SST anomaly over the              hPa and 200-hPa winds in the TC season between the cold and

Frontiers in Earth Science | www.frontiersin.org                       9                                             May 2021 | Volume 9 | Article 675150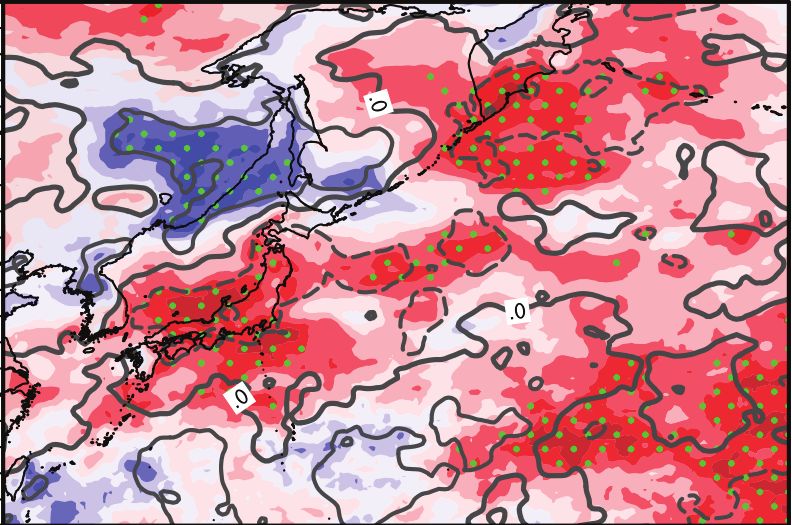
Fu et al.                                                                                                                                       Sea Ice and WNP TCs

                 A                                                                 B

                 C                                                                 D

  FIGURE 8 | (A) The domain in which SST is modified in the sensitivity experiments. (B-D) The differences in the simulated (B) 300-hPa temperature (shaded, K), (C)
  850-hPa, and (D) 200-hPa winds (vector; m s−1 ) between the cold and warm runs based on the ECHAM4 model. The dots in panel (B) and the shaded in panels
  (C,D) denote areas where the differences are statistically significant above 90% confidence level based on the Student t-test.

                                                                                            warm runs. Consistent with the regression analysis shown in
        A
                                                                                            Figure 7, the simulated differences in 200-hPa winds between the
                                                                                            cold and warm SST anomalies over the Japan Sea (Figure 8D)
                                                                                            show significant westerly anomalies near 30◦ N from 120◦ to
                                                                                            180◦ E and an anomalous anticyclonic circulation south of 30◦ N
                                                                                            over the WNP. At the same time, the difference in the simulated
                                                                                            temperature at 300 hPa exhibits a significant cold anomaly to the
                                                                                            north and a warm anomaly to the south of 30◦ N over the WNP
                                                                                            (Figure 8B), similar to that observed as shown in Figure 5A. This
                                                                                            suggests that the cold SST in the Japan Sea can indeed lead to
                                                                                            the strengthening and southward shift of the SWJ. In addition,
        B                                                                                   the simulated difference in 850-hPa winds between the cold
                                                                                            and warm runs (Figure 8C) is characterized by an anomalous
                                                                                            cyclonic circulation over the tropical WNP, which is favorable
                                                                                            for TC activity over the WNP, although the low-level circulation
                                                                                            response to the cold Japan Sea is slightly north of that regressed
                                                                                            with respect to the spring SIC anomaly (Figure 4A). These results
                                                                                            confirm the role of Japan Sea SST anomaly in modulating the SWJ
                                                                                            and the large-scale environmental conditions affecting the ACE
                                                                                            in the TC season over the WNP.
                                                                                                As discussed above, there is a gradually increasing cooling
                                                                                            in the Japan Sea from March-May to August-October in
                                                                                            response to the spring SIC anomaly (Figure 6). Therefore, it
                                                                                            is important to understand how the spring SIC anomaly leads
  FIGURE 9 | Regressed sensible heat flux (W m−2 ) averaged in panels                       to the continuous cooling in the Japan Sea through the TC
  (A) April-May and (B) June-July with respect to the negative spring SIC index.
  The dots denote the areas where the regressions in sensible heat flux are
                                                                                            season. In January-March, the Bering Sea and the Gulf of Alaska
  significant at 90% confidence level.                                                      is covered by a strong anticyclonic anomaly (Figures 6A,B).
                                                                                            As the SIC decreases in spring, a cyclonic anomaly over the

Frontiers in Earth Science | www.frontiersin.org                                       10                                        May 2021 | Volume 9 | Article 675150
Fu et al. Sea Ice and WNP TCs
A B
C D
FIGURE 10 | Regressed (A) latent heat flux, (B) sensible heat flux, (C) longwave radiation flux, and (D) shortwave radiation flux (W m−2 ) in the TC season with
respect to the negative spring SIC index during 1981–2018. The dotted areas denote where the regressions are statistically significant above 90% confidence level
based on the Student t-test.
western Bering Sea gradually strengthens and expands around, shortwave radiation fluxes. Figure 10 shows the regressed four
which contributes to the westward shift and intensification fluxes in the TC season with respect to the negative spring SIC
of the Aleutian low (Figures 6C,D). Afterwards, the cyclonic index during 1981–2018, where the positive sign stands for “into
anomaly weakens and decays in summer (Figures 6E,F). In the ocean and thus warming” and vice versa. Among the four
response to the reduced spring SIC, sensible heat flux over the fluxes in the Japan Sea, the shortwave radiation flux anomalies
Bering Sea also exhibits significant positive anomaly in spring, in response to the spring SIC (Figure 10D) displays a similar
while the positive anomaly rapidly weakens and decays in the pattern to the SST anomalies in the Japan Sea. This suggests that
coming summer (Figure 9). This suggests that the reduced the persistent cooling in the Japan Sea through the TC season
spring SIC significantly modulates the Aleutian low by warming after its initiation in spring is most likely caused by the reduction
the low-level atmosphere. Meanwhile, the strengthened Aleutian of the incoming shortwave radiation reaching the ocean surface.
low enhances the northwesterly over the mid-latitude Asian Consistent with the evolution of the regressed SST anomalies
continent, leading to cold continental air intrusion into the Japan (Figure 6), the regressed shortwave radiation flux shows negative
Sea and thus the cooling in the Japan Sea by promoting sea anomalies in the Japan Sea in spring, which quickly intensifies
surface sensible and latent heat fluxes. However, although the and extends eastward through the TC season (Figure 11). The
cold air intrusion induced by the spring SIC weakens rapidly surface shortwave radiation is largely determined by low clouds in
from spring to summer, the cooling in the Japan Sea continues the Japan Sea in summer (e.g., Koseki et al., 2012). The increasing
through the TC season. This suggests that the reduced SIC in reduction of surface shortwave radiation flux can be attributed to
spring triggers the initial cold SST anomaly in the Japan Sea, but the increasing low cloud cover in the Japan Sea as we can see from
the strengthening of the cold SST anomaly over the Japan Sea the evolution of the regressed low cloud cover with respect to the
through the TC season could not be attributed to the direct effect reduced spring SIC index in Figure 11.
of the reduced SIC in the Bering Sea. The above analysis demonstrates that a positive feedback
To probe into the possible physical process of the persistent among low cloud, radiation, and SST (namely the cloud-
SST cooling in the Japan Sea through the TC season, we examined radiation-SST feedback) could be responsible for the persistent
the surface heat fluxes. This is because if ignoring the effect of strengthening cooling in the Japan Sea through the TC season
surface currents and upper ocean mixing, changes in SST in triggered by the spring reduced SIC in the Bering Sea. In spring,
the ocean would be determined by the net surface heat flux, the anomalous northwesterly associated with the strengthening
including the latent heat flux, sensible heat flux, longwave and Aleutian low due to the reduced SIC in the Bering Sea brings
Frontiers in Earth Science | www.frontiersin.org 11 May 2021 | Volume 9 | Article 675150Fu et al. Sea Ice and WNP TCs
A B
C D
E F
FIGURE 11 | (A-F) Regressed 3-month running averaged low cloud cover (shaded) and shortwave radiation flux (contour; W m−2 ) from March to October with
respect to the negative spring SIC index during 1981–2018. The dotted areas denote where the regressions are statistically significant at 90% confidence level.
dry and cold air to the Japan Sea from the mid-latitude Asian Klein and Hartmann, 1993; Wang et al., 2004a,b; Koseki et al.,
continent. This enhances surface turbulent sensible and latent 2012). Therefore, through the local positive cloud-radiation-SST
heat fluxes. Thus, the SST begins to cool down and the boundary feedback process over the Japan Sea and its adjacent regions that
layer becomes more stable leading to the formation of low clouds the spring SIC anomaly affects the interannual variability of the
above the Japan Sea and its adjacent regions. Afterwards, the SWJ, and large-scale circulation and thus the TC activity in the
cyclonic anomaly weakens and decays in summer. However, TC season over the WNP. This demonstrates that the spring SST
low clouds block the downward short-wave radiation reaching anomaly in the Japan Sea triggered by the SIC anomaly in the
the ocean surface, leading to further cooling of the ocean Bering Sea plays a key role in bridging the observed relationship
surface. The strong cooling in turn strengthens the stability between the spring SIC and the ACE in the TC season over
of the lower troposphere, which is more favorable for low the WNP discussed in Section “Results From Statistical and
clouds (Manabe and Strickler, 1964; Lilly, 1968; Moeng, 1986; Regression Analyses.”
Frontiers in Earth Science | www.frontiersin.org 12 May 2021 | Volume 9 | Article 675150Fu et al. Sea Ice and WNP TCs
WNP (Fan, 2007; Fan and Wang, 2009). Our study focuses on
the role of spring SIC in the Bering Sea in contributing to the
interannual variability of ACE over the WNP, which includes
not only TC genesis frequency, but also TC tracks and intensity.
Our results show that the spring SIC has an important impact
on the TC tracks and the meridional shift of TC activity over
the WNP. Especially, this study reveals the key role of the
cloud-radiation-SST feedback in the Japan Sea in bridging the
interannual relationship between the spring SIC and the ACE in
FIGURE 12 | Schematic diagram showing the processes through which the
spring SIC affects the WNP environment in the TC season. The reduced SIC the TC season over the WNP.
induces the intensification and westward shift of the Aleutian low in spring, Note that the regressed SST field with respect to the reduced
which increases the low cloud, reduces surface shortwave radiation flux and SIC (Figure 6) also shows a similar pattern to the second
causes cooling over the Japan Sea. The cloud-radiation-SST feedback empirical orthogonal function mode (EOF2) of SST anomalies in
intensifies and maintains through the TC season, which leads to the
the North Pacific, namely the Victoria mode (VM), which was
strengthening and southward shift of the SWJ and then induces favorable
conditions for TC activity over the WNP. The yellow solid and thick arrow highly correlated with TC frequency over the WNP (Pu et al.,
denotes the SWJ, and the yellow solid and thin arrow denotes the surface 2019). However, we found no statistically significant correlation
shortwave radiation flux. The dotted gray arrows indicate the physical process between the summer Victoria mode index and spring SIC index.
by which the spring SIC anomaly imposes impact in the tropical WNP in the After the Victoria model signal was removed from the SIC
TC season through the bridging role of the cloud-radiation-SST feedback in
Japan Sea.
index, the regressed WNP ACE in the TC season with respect
to the spring SIC anomaly in the Bering Sea is still significant,
suggesting that the impact of the spring SIC is independent of
that of the Victoria mode.
CONCLUSION AND DISCUSSION Previous studies have also demonstrated a prominent control
of ENSO on TC activity over the WNP on interannual time
This study has documented the negative correlation between the scale (e.g., Camargo and Sobel, 2005; Zhan et al., 2018). We
spring SIC in the Bering Sea and the ACE in the TC season over compared the spatial correlations between the Nino3.4 index and
the WNP on the interannual timescale during 1980–2018. The WNP ACE in the TC season, and found that the correlation is
reduced (increased) spring SIC is favorable for higher (lower) statistically significant only over the eastern WNP, very different
ACE, an integrated measure of TC genesis frequency, intensity from that associated with the impact of the spring SIC. Therefore,
and tracks. Especially, the spring SIC can greatly affect TC tracks the relative contribution from the spring SIC and ENSO to the
by shifting TC activity meridionally over the WNP. Results from interannual variability of TC activity in terms of the ACE might
both reanalysis data analysis and atmospheric model experiments be an interesting topic that deserves a future study. In addition,
demonstrate the key role of the SST anomaly in the Japan Sea many studies have shown that Arctic sea ice has been decreasing
in bridging the correlation between the spring SIC and the rapidly (e.g., Serreze and Barry, 2011) and the WNP TC activity
WNP ACE in the TC season. The associated physical processes has also shown an intensification in recent decades (Emanuel,
are conceptualized in Figure 12. In spring, the reduced SIC 2005, 2013; Webster et al., 2005; Park et al., 2017). Our study has
induces the intensification and westward shift of the Aleutian revealed a significant negative correlation between the spring SIC
low, which is consistent with the results in Fan (2007). However, and TC ACE in the TC season over the WNP on the interannual
we further pointed out that such changes in the Aleutian low time scale. It is unclear whether the rapid decline of the Arctic
strengthens the cold air intrusion from the mid-latitude Asian sea ice has contributed to the intensified TC activity over the
continent and induces the cooling and promotes the development WNP. Our study also showed that the spring SIC can greatly
of low clouds in the Japan Sea and its adjacent regions. The affect TC tracks and its meridional shift. It implies that the
low clouds reduce the shortwave radiation reaching the ocean rapid decline in Arctic sea ice might lead to longer TC tracks
surface, further cooling the ocean surface in the Japan Sea. This and more active TC activity in higher latitudes under a warmer
would in turn increases the stability of the lower troposphere and climate. These could be another interesting topic for a future
further enhances the low clouds and thus cools the ocean surface. study. Nevertheless, the finding from this study not only has an
This local cloud-radiation-SST feedback persistently cools the important implication for seasonal TC forecasts but also suggests
Japan Sea and the atmosphere above through the TC season, a strengthened future TC activity potentially resulting from the
enhancing the meridional gradient of air temperature, leading rapid decline of Arctic sea ice.
to the strengthening and southward shift of the SWJ over the
East Asia, an anomalous upper-level anticyclone over the WNP,
low-level cyclonic circulation anomalies, increased CAPE, and SIGNIFICANCE STATEMENTS
reduced VWS over the tropical WNP. These all are favorable for
TC development and intensification and thus the increased ACE Although many studies have revealed that Arctic sea ice may
over the WNP in the TC season. impose a great impact on the global climate system, including
Previous studies have revealed the impact of spring sea ice the tropical cyclone genesis frequency over the western North
cover in the North Pacific on TC genesis frequency over the Pacific, it is unknown whether the Arctic sea ice could have any
Frontiers in Earth Science | www.frontiersin.org 13 May 2021 | Volume 9 | Article 675150Fu et al. Sea Ice and WNP TCs
significant effects on other aspects of TCs, such as TC intensity, AUTHOR CONTRIBUTIONS
lifespan, and track; and if so, what are the involved physical
mechanisms. Here, we found that the decreased (increased) HF and RZ conceived the study and wrote the manuscript. HF
spring sea ice in the Bering Sea is favorable (unfavorable) for and JZ set and run the numerical experiments. ZW and YW
TC activity, including the mean lifetime of tropical cyclones provided critical feedback and helped shape the research and
and the meridional shift of the mean tropical cyclogenesis manuscript. All authors contributed to the article and approved
location and dominant tracks. The spring sea ice anomaly can the submitted version.
induce large-scale conditions that significantly affect tropical
cyclone activity over the western North Pacific by triggering
the cloud-radiation-SST feedback in the Japan Sea. The finding FUNDING
not only has an important implication to seasonal tropical
cyclone forecasts but also suggest a strengthened future tropical This work has been supported by the National Key Basic
cyclone activity potentially resulting from the rapid decline Research Project of China (2019YFA0607002), the National
of Arctic sea ice. Natural Science Foundation of China (Grants 42075015 and
41875114), and the Shanghai Typhoon Research Foundation
(TFJJ201919).
DATA AVAILABILITY STATEMENT
ACKNOWLEDGMENTS
The original contributions presented in the study are included
in the article/supplementary material, further inquiries can be The authors are grateful to Drs. Yinao Diao, Chenghu Sun, and
directed to the corresponding author/s. Anmin Duan for their constructive comments and suggestions.
REFERENCES Du, Y., Yang, L., and Xie, S. (2011). Tropical Indian Ocean influence on Northwest
Pacific tropical cyclones in summer following strong El Niño. J. Clim. 24,
Ashok, K., Guan, Z., and Yamagata, T. A. (2003). A look at the relationship between 315–322. doi: 10.1175/2010JCLI3890.1
the ENSO and the Indian Ocean dipole. J. Meteorol. Soc. Jpn. Ser II 81, 41–56. Emanuel, K. A. (1994). Atmospheric Convection. (Oxford: Oxford University Press),
doi: 10.2151/jmsj.81.41 580.
Balmaseda, M. A., Ferranti, L., Molteni, F., and Palmer, T. N. (2010). Impact of 2007 Emanuel, K. A. (2005). Increasing destructiveness of tropical cyclones over the past
and 2008 Arctic ice anomalies on the atmospheric circulation: implications for 30?years. Nature 436, 686–688. doi: 10.1038/nature03906
long-range predictions. Q. J. R. Meteorol. Soc. 136, 1655–1664. doi: 10.1002/qj. Emanuel, K. A. (2013). Downscaling CMIP5 climate models shows increased
661 tropical cyclone activity over the 21st century. Proc. Natl. Acad. Sci. U.S.A. 110,
Barnes, E. A. (2013). Revisiting the evidence linking Arctic amplification to extreme 12219–12224. doi: 10.1073/pnas.1301293110
weather in midlatitudes. Geophys. Res. Lett. 40, 4734–4739. doi: 10.1002/grl. Fan, K. (2007). North Pacific sea ice cover, a predictor for the Western North
50880 Pacific typhoon frequency? Sci. China Ser. D Earth Sci. 50, 1251–1257. doi:
Bell, G. D., Halpert, M. S., Schnell, R. C., Higgins, R. W., Lawrimore, J., Kousky, 10.1007/s11430-007-0076-y
V. E., et al. (2000). Climate assessment for 1999. Bull. Am. Meteorol. Soc. 81, Fan, K., and Wang, H. J. (2009). A new approach to forecasting typhoon frequency
S1–S50. over the western North Pacific. Weather Forecast. 24, 974–986. doi: 10.1175/
Bracken, W. E., and Bosart, L. F. (2000). The role of synoptic-scale flow during 2009WAF2222194.1
tropical cyclogenesis over the North Atlantic Ocean. Mon. Weather Rev. 128, Fischer, M. S., Tang, B. H., and Corbosiero, K. L. (2017). Assessing the influence
353–376. doi: 10.1175/1520-0493(2000)1282.0.co;2 of upper-tropospheric troughs on tropical cyclone intensification rates after
Camargo, S. J., and Barnston, A. G. (2009). Experimental dynamical seasonal genesis. Mon. Weather Rev. 145, 1295–1313. doi: 10.1175/MWR-D-16-
forecasts of tropical cyclone activity at IRI. Weather Forecast. 24, 472–491. 0275.1
doi: 10.1175/2008WAF2007099.1 Gao, S., Zhu, L., Zhang, W., and Chen, Z. (2018). Strong modulation of the
Camargo, S. J., and Sobel, A. H. (2005). Western North Pacific tropical cyclone Pacific meridional mode on the occurrence of intense tropical cyclones over the
intensity and ENSO. J. Clim. 18, 2996–3006. doi: 10.1175/JCLI3457.1 western North Pacific. J. Clim. 31, 7739–7749. doi: 10.1175/JCLI-D-17-0833.1
Chan, J. C. L. (2005). Interannual and interdecadal variations of tropical cyclone Hersbach, H., Bell, B. D., Berrisford, P., Hirahara, S., Horányi, A., Muñoz-Sabater,
activity over the western North Pacific. Meteorol. Atmos. Phys. 89, 143–152. J., et al. (2020). The ERA5 global reanalysis. Q. J. R. Meteorol. Soc. 146,
doi: 10.1007/s00703-005-0126-y 1999–2049. doi: 10.1002/qj.3803
Chan, J. C. L., and Liu, K. S. (2004). Global warming and western North Pacific Huangfu, J., Chen, W., Huang, R., and Feng, J. (2019). Modulation of the impacts
typhoon activity from an observational perspective. J. Clim. 17, 4590–4602. of the Indian Ocean Basin mode on tropical cyclones over the Northwest
doi: 10.1175/3240.1 Pacific during the boreal summer by La Niña Modoki. J. Clim. 32, 3313–3326.
Chen, G., and Tam, C.-Y. (2010). Different impacts of two kinds of Pacific Ocean doi: 10.1175/jcli-d-18-0638.1
warming on tropical cyclone frequency over the western North Pacific. Geophys. Huangfu, J., Huang, R., Chen, W., and Feng, T. (2018). Causes of the active typhoon
Res. Lett. 37:L01803. doi: 10.1029/2009GL041708 season in 2016 following a strong El Niño with a comparison to 1998. Int. J.
Chia, H. H., and Ropelewski, C. F. (2002). The interannual variability in the genesis Climatol. 38, e1107–e1118. doi: 10.1002/joc.5437
location of tropical cyclones in the Northwest Pacific. J. Clim. 15, 2934–2944. Kim, H., Lee, M., Webster, P. J., Kim, D., and Yoo, J. H. (2013). A physical basis for
Cowan, L. P., and Hart, R. E. (2020). An objective identification and climatology of the probabilistic prediction of the accumulated tropical cyclone kinetic energy
upper-tropospheric jets near Atlantic tropical cyclones. Mon. Weather Rev. 148, in the western North Pacific. J. Clim. 26, 7981–7991. doi: 10.1175/JCLI-D-12-
3015–3036. doi: 10.1175/MWR-D-19-0262.1 00679.1
Deser, C., and Teng, H. (2008). Evolution of Arctic sea ice concentration trends Klein, S. A., and Hartmann, D. L. (1993). The seasonal cycle of low stratiform
and the role of atmospheric circulation forcing, 1979–2007. Geophys. Res. Lett. clouds. J. Clim. 6, 1587–1606. doi: 10.1175/1520-0442(1993)006
35:L02504. doi: 10.1029/2007GL032023 2.0.co;2
Frontiers in Earth Science | www.frontiersin.org 14 May 2021 | Volume 9 | Article 675150Fu et al. Sea Ice and WNP TCs
Koseki, S., Nakamura, T., Mitsudera, H., and Wang, Y. (2012). Modeling low-level Tao, L., Wu, L., Wang, Y., and Yang, J. (2012). Influence of tropical Indian Ocean
clouds over the Okhotsk Sea in summer: cloud formation and its effects on the warming and ENSO on tropical cyclone activity over the western North Pacific.
Okhotsk high. J. Geophys. Res. Atmos. 117, D05208. doi: 10.1029/2011JD016462 J. Meteorol. Soc. Jpn. Ser. II 90, 127–144. doi: 10.2151/jmsj.2012-107
Liang, X. Z., and Wang, W. C. (1998). Associations between China monsoon Walsh, J. E. (2014). Intensified warming of the Arctic: causes and impacts on
rainfall and tropospheric jets. Q. J. R. Meteorol. Soc. 124, 2597–2623. doi: 10. middle latitudes. Glob. Planet. Change 117, 52–63. doi: 10.1016/j.gloplacha.
1002/qj.49712455204 2014.03.003
Lilly, D. K. (1968). Models of cloud-topped mixed layers under a strong inversion. Wang, B., and Chan, J. C. L. (2002). How strong ENSO events affect tropical
Q. J. R. Meteorol. Soc. 94, 292–309. doi: 10.1002/qj.49709440106 cyclone activity over the western North Pacific. J. Clim. 15, 1643–1658. doi:
Manabe, S., and Strickler, R. F. (1964). Thermal equilibrium of the atmosphere 10.1175/1520-0442(2002)0152.0.co;2
with a convective adjustment. J. Atmos. Sci. 21, 361–385. doi: 10.1175/1520- Wang, Y., Xie, S., Xu, H., and Wang, B. (2004a). Regional model simulations of
0469(1964)0212.0.co;2 marine boundary layer clouds over the Southeast Pacific off South America. Part
Moeng, C.-H. (1986). Large-Eddy Simulation of a stratus-topped boundary layer. I: control experiment. Mon. Weather Rev. 132, 274–296. doi: 10.1175/1520-
Part I: structure and budgets. J. Atmos. Sci. 43, 2886–2900. doi: 10.1175/1520- 0493(2004)1322.0.co;2
0469(1986)0432.0.co;2 Wang, Y., Xu, H., and Xie, S. (2004b). Regional model simulations of marine
Moore, J. T., and Vanknowe, G. E. (1992). The effect of jet-streak curvature boundary layer clouds over the Southeast Pacific off South America. Part
on kinematic fields. Mon. Weather Rev. 120, 2429–2441. doi: 10.1175/1520- II: sensitivity experiments. Mon. Weather Rev. 132, 2650–2668. doi: 10.1175/
0493(1992)1202.0.co;2 MWR2812.1
Murakami, H., Li, T., and Hsu, P. (2014). Contributing factors to the recent high Webster, P. J., Holland, G. J., Curry, J. A., and Chang, H. R. (2005). Changes in
level of accumulated cyclone energy (ACE) and power dissipation index (PDI) tropical cyclone number, duration, and intensity in a warming environment.
in the North Atlantic. J. Clim. 27, 3023–3034. doi: 10.1175/JCLI-D-13-00 394.1 Science 309, 1844–1846. doi: 10.1126/science.1116448
Nordeng, T. E. (1994). Extended versions of the convective parameterization Weisman, M. L., and Klemp, J. B. (1982). The dependence of numerically
scheme at ECMWF and their impact on the mean and transient activity of the simulated convective storms on vertical wind shear and buoyancy. Mon.
model in the tropics. ECMWF Res. Dep. Tech. Memo. 206, 1–41. Weather Rev. 110, 504–520. doi: 10.1175/1520-0493(1982)1102
Park, D. S., Ho, C. H., Chan, J., Ha, K.-J., Kim, H.-S., Kim, J., et al. (2017). .0.co;2
Asymmetric response of tropical cyclone activity to global warming over the Woolings, T., Czuchnicki, C., and Franzke, C. (2014). Twentieth century North
North Atlantic and western North Pacific from CMIP5 model projections. Sci. Atlantic jet variability. Q. J. R. Meteorol. Soc. 140, 783–791. doi: 10.1002/
Rep. 7:41354. doi: 10.1038/srep41354 qj.2197
Park, K., Zou, X., and Li, G. (2009). A numerical study on rapid intensification Wu, Z., Li, X., Li, Y., and Li, Y. (2016). Potential influence of Arctic Sea Ice
of Hurricane Charley (2004) near landfall. Front. Earth Sci. China 3:457. doi: to the interannual variations of East Asian spring precipitation. J. Clim. 29,
10.1007/s11707-009-0048-y 2797–2813. doi: 10.1175/JCLI-D-15-0128.1
Pu, X., Chen, Q., Zhong, Q., Ding, R., and Liu, T. (2019). Influence of the North Zhan, R., Chen, B., and Ding, Y. (2018). Impacts of SST anomalies in the Indian-
Pacific Victoria mode on western North Pacific tropical cyclone genesis. Clim. Pacific basin on Northwest Pacific tropical cyclone activities during three super
Dyn. 52, 245–256. doi: 10.1007/s00382-018-4129-z El Niño years. J. Oceanol. Limnol. 36, 20–32.
Rasmussen, E. N., and Blanchard, D. O. (1998). A baseline climatology of Zhan, R., and Wang, Y. (2016). CFSv2-based statistical prediction for seasonal
sounding-derived supercell and tornado forecast parameters. Weather Forecast. accumulated cyclone energy (ACE) over the western North Pacific. J. Clim. 29,
13, 1148–1164. doi: 10.1175/1520-0434(1998)0132.0.co;2 525–541. doi: 10.1175/JCLI-D-15-0059.1
Rayner, N. A., Parker, D. E., Horton, E. B., Folland, C. K., Alexander, L. V., Rowell, Zhan, R., Wang, Y., and Lei, X. T. (2011a). Contributions of ENSO and East Indian
D. P., et al. (2003). Global analyses of sea surface temperature, sea ice, and night Ocean SSTA to the interannual variability of northwest Pacific tropical cyclone
marine air temperature since the late nineteenth century. J. Geophys. Res. Atmos. frequency. J. Clim. 24, 509–521. doi: 10.1175/2010JCLI3808.1
108:4407. doi: 10.1029/2002JD002670 Zhan, R., Wang, Y., and Wen, M. (2013). The SST gradient between the
Rinke, A., Dethloff, K., Dorn, W., Handorf, D., and Moore, J. C. (2013). Simulated Southwestern Pacific and the western Pacific warm pool: a new factor
Arctic atmospheric feedbacks associated with late summer sea ice anomalies. controlling the Northwestern Pacific tropical cyclone genesis frequency. J. Clim.
J. Geophys. Res. Atmos. 118, 7698–7714. doi: 10.1002/jgrd.50584 26, 2408–2415. doi: 10.1175/JCLI-D-12-00798.1
Roeckner, E. K., Arpe, L., Bengtsson, L., Christoph, M., Clauseen, L., Dümenil, Zhan, R., Wang, Y., and Wu, C. C. (2011b). Impact of SSTA in the East Indian
L., et al. (1996). The Atmospheric General Circulation Model ECHAM-4: Model Ocean on the frequency of northwest Pacific tropical cyclones: a regional
Description and Simulation of Present-Day Climate. Max-Planck-Institut für atmospheric model study. J. Clim. 24, 6227–6242. doi: 10.1175/JCLI-D-10-
Meteorologie Report Series. 218. Technical Report. (Hamburg: Max-Planck- 05014.1
Institut für Meteorologie). Zhan, R., Wang, Y., and Ying, M. (2012). Seasonal forecasts of tropical cyclone
Royer, J. F., Planton, S., and Déqué, M. (1990). A sensitivity experiment for the activity over the western North Pacific: a review. Trop. Cyclone Res. Rev. 1,
removal of Arctic sea ice with the French spectral general circulation model. 307–324. doi: 10.6057/2012TCRR03.07
Clim. Dyn. 5, 1–17. doi: 10.1007/bf00195850 Zhang, W., Vecchi, G. A., Murakami, H., Villarini, G., and Jia, L. (2015). The Pacific
Schneider, T., Bischoff, T., and Plotka, H. (2014). Physics of changes in synoptic Meridional Mode and the occurrence of tropical cyclones in the western North
midlatitude temperature variability. J. Clim. 28, 2312–2331. doi: 10.1175/JCLI- Pacific. J. Clim. 29, 381–398. doi: 10.1175/JCLI-D-15-0282.1
D-14-00632.1 Zhao, G., Huang, G., Wu, R., Tao, W., Gong, H., Qu, X., et al. (2015). A new upper-
Screen, J. A. (2014). Arctic amplification decreases temperature variance in level circulation index for the East Asian summer monsoon variability. J. Clim.
northern mid- to high-latitudes. Nat. Clim. Change 4, 577–582. doi: 10.1038/ 28, 9977–9996. doi: 10.1175/JCLI-D15-0272.1
nclimate2268 Zhao, H., Wu, L., and Zhou, W. (2011). Interannual changes of tropical cyclone
Screen, J. A., and Simmonds, I. (2013). Exploring links between Arctic intensity in the western North Pacific. J. Meteorol. Soc. Jpn. Ser. II 89, 243–253.
amplification and mid-latitude weather. Geophys. Res. Lett. 40, 959–964. doi: doi: 10.2151/jmsj.2011-305
10.1002/grl.50174
Screen, J. A., Simmonds, I., Deser, C., and Tomas, R. (2013). The atmospheric Conflict of Interest: The authors declare that the research was conducted in the
response to three decades of observed Arctic sea ice loss. J. Clim. 26, 1230–1248. absence of any commercial or financial relationships that could be construed as a
doi: 10.1175/JCLI-D-12-00063.1 potential conflict of interest.
Serreze, M. C., and Barry, R. G. (2011). Processes and impacts of Arctic
amplification: a research synthesis. Glob. Planet. Change 77, 85–96. doi: 10. Copyright © 2021 Fu, Zhan, Wu, Wang and Zhao. This is an open-access article
1016/j.gloplacha.2011.03.004 distributed under the terms of the Creative Commons Attribution License (CC BY).
Smith, D. M., Dunstone, N. J., Scaife, A. A., Fiedler, E. K., Copsey, D., and The use, distribution or reproduction in other forums is permitted, provided the
Hardiman, S. C. (2017). Atmospheric response to Arctic and Antarctic sea original author(s) and the copyright owner(s) are credited and that the original
ice: the importance of ocean-atmosphere coupling and the background state. publication in this journal is cited, in accordance with accepted academic practice. No
J. Clim. 30, 4547–4565. doi: 10.1175/JCLI-D-16-0564.1 use, distribution or reproduction is permitted which does not comply with these terms.
Frontiers in Earth Science | www.frontiersin.org 15 May 2021 | Volume 9 | Article 675150You can also read