WHO child growth standards for Pygmies: one size fits all? - bioRxiv
←
→
Page content transcription
If your browser does not render page correctly, please read the page content below
bioRxiv preprint first posted online Mar. 27, 2019; doi: http://dx.doi.org/10.1101/591172. The copyright holder for this preprint
 (which was not peer-reviewed) is the author/funder, who has granted bioRxiv a license to display the preprint in perpetuity.
                                  It is made available under a CC-BY 4.0 International license.

          Submitted to PLOS One

          WHO child growth standards for Pygmies: one size
          fits all?

          Stephan M. Funk1,2¶, Belén Palomo Guerra3¶, Amy Ickowitz4, Nicias
          Afoumpam Poni5, Mohamadou Aminou Abdou6, Yaya Hadam Sibama6, René
          Penda6, Guillermo Ros Brull5, Martin Abossolo, Eva Ávila Martín5, Robert
          Okale5, Blaise Ango Ze, Ananda Moreno Carrión5, Cristina García Sebastián7,
          Cristina Ruiz de Loizaga García8, Francisco López-Romero Salazar9, Hissein
          Amazia5, Idoia Álvarez Reyes10, Rafaela Sánchez Expósito5, John E. Fa4,11*

          1NatureHeritage,            St. Lawrence, Jersey, Channel Islands
          2Centro      de Excelencia en Medicina Traslacional, Universidad de La Frontera,
          Chile
          3Hospital      Universitario de Móstoles, Río Júcar, S/N, 28935 Móstoles, Madrid,
          Spain
          4Center      for International Forestry Research (CIFOR), Jalan Cifor Rawajaha,
          Situ Gede, Bogor Barat, Kota Bogor, Jawa Barat 16115, Indonesia
          5Zerca      y Lejos NGO, Calle de Sambara, 128, 28027 Madrid, Spain
          6Faculté      de Médecine et Sciences Biomédicales, Université de Yaoundé,
          Yaoundé, Cameroon
          7 Hospital      Universitario Ramón y Cajal, Ctra. Colmenar Viejo, km. 9, 100,
          28034 Madrid, Spain
          8Hospital      Universitario Príncipe de Asturias, Carretera Alcalá-Meco, s/n,
          28805 Alcalá de Henares, Madrid, Spain
          9Hospital      Universitario 12 de Octubre, Av. Cordoba, s/n, 28041 Madrid, Spain
          10Consorci        Sanitari Integral de L'Hospitalet de Llobregat, Av. Josep Molins,
          29, 08906 L'Hospitalet de Llobregat, Barcelona, Spain

                                                                                                                                    1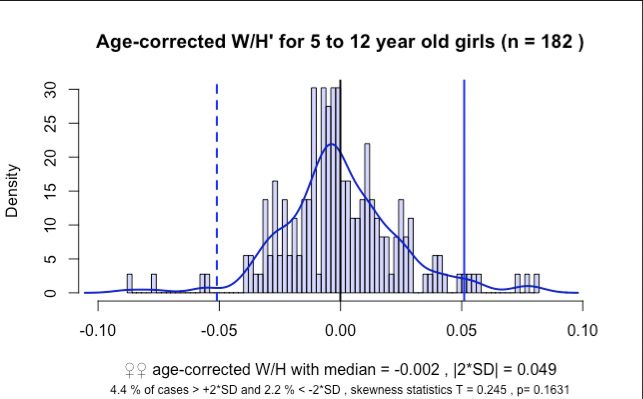
bioRxiv preprint first posted online Mar. 27, 2019; doi: http://dx.doi.org/10.1101/591172. The copyright holder for this preprint
 (which was not peer-reviewed) is the author/funder, who has granted bioRxiv a license to display the preprint in perpetuity.
                                  It is made available under a CC-BY 4.0 International license.

          11Division      of Biology and Conservation Ecology, Manchester Metropolitan
          University, Manchester M15 6BH, UK

          ¶ joint   first authors

                                                                                                                                    2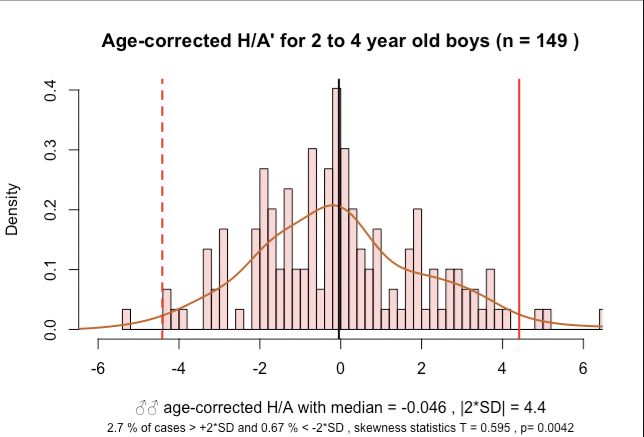
bioRxiv preprint first posted online Mar. 27, 2019; doi: http://dx.doi.org/10.1101/591172. The copyright holder for this preprint
 (which was not peer-reviewed) is the author/funder, who has granted bioRxiv a license to display the preprint in perpetuity.
                                  It is made available under a CC-BY 4.0 International license.

          Abstract
          Background African Pygmies exhibit a unique, genetically determined child
          growth dynamics and adult stature but the impact on assessing undernutrition
          remains unknown. Baka Pygmy health is highly compromised compared to
          sympatric populations. Evaluating child undernutrition is an important step to
          address this health quandry. We estimate stunting and wasting in
          Cameroon´s Baka children and investigate the applicability of the standards
          for Pygmy people.

          Methods Anthropometric and health data from 685 2-to12 year old children
          were collected at 25 health centres in southern Cameroon. Growth was
          analysed using both, WHO Child Growth Standards and the population itself
          as reference to define frequencies of stunting, wasting and obesity.

          Findings Baka children revealed with 68.4% the highest recorded level
          globally of stunting relative to the WHO child growth standard in 2-to-4 year
          olds. Wasting was at 8.2% in the upper third range in Sub-Saharan Africa.
          Obesity was with 6.5% similar to wasting, but no comparable data have been
          published for Sub-Saharan Africa. When referenced to the Baka population
          itself, values for stunting were dramatically lower at 1.0% and 2.9% for 2-to-4
          and 5-to-12 year olds, respectively. Wasting was also lower at 2.8% and 1.8%
          and was exceeded by obesity at 3.4% and 3.5%, respectively. Brachial
          perimeters and oedemas indicated rare severe malnutrition (< 2%) whilst
          moderate and severe anaemia were frequent (26.6% and 3.3%, respectively).

          Interpretation WHO child growth standards for stunting are clearly not
          applicable to Pygmies thus contradicting the widespread emphasis of their
          ethnicity-independent applicability. The inferred values for wasting and obesity
          are also difficult to interpret and are likely overestimated by the WHO criteria.
          To achieve UN Sustainable Development Goals and to fulfil our humanitarian
          responsibility for fellow man, we recommend that Pygmy specific growth
          standards are developed for the genetically differing Pygmy tribes.

                                                                                                                                    3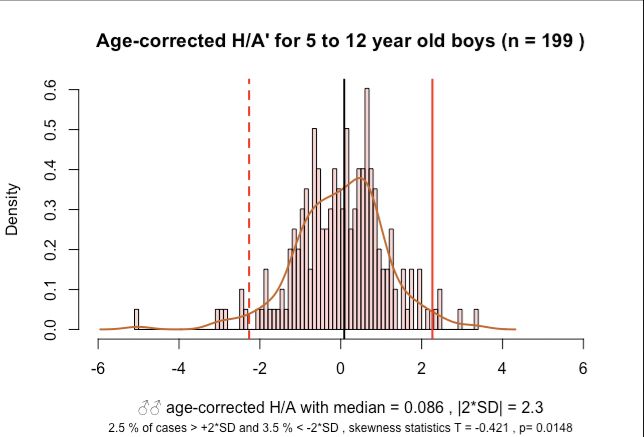
bioRxiv preprint first posted online Mar. 27, 2019; doi: http://dx.doi.org/10.1101/591172. The copyright holder for this preprint
 (which was not peer-reviewed) is the author/funder, who has granted bioRxiv a license to display the preprint in perpetuity.
                                  It is made available under a CC-BY 4.0 International license.

          Introduction
          Malnutrition refers to deficiencies, excesses or imbalances in a person’s
          intake of energy and/or nutrients. The term malnutrition covers
          ‘undernutrition’—which includes stunting (low height for age), wasting (low
          weight for height), underweight (low weight for age), micronutrient deficiencies
          or insufficiencies (a lack of important vitamins and minerals) and
          ‘overnutrition’ which includes overweight and obesity. Factors affecting
          undernutrition are manifold, ultimately determined by socio-economic and
          political factors that prolong poverty and social inequities[1,2]. The
          consequences of undernutrition include increased risk of infection, death, and
          delayed cognitive development resulting in low adult incomes and
          intergenerational transmission of poverty. Overnutrition is a major cause of
          noncommunicable diseases such as heart disease, stroke, diabetes and
          cancer.

          Malnutrition is estimated to contribute to more than one third of all child
          deaths worldwide[3]. Despite a general reduction since the beginning of this
          century, numbers of undernourished children remain alarmingly high; in 2016,
          there were 155 million cases of stunting and 52 million cases of wasting in
          children under 5 years, corresponding to global rates of 23% and 8%,
          respectively[4]. Globally, almost two thirds of children suffering from
          malnutrition live in sub-Saharan Africa and Southern Asia. In sub-Saharan
          Africa, inadequate nutrition and poverty (almost half of the population in the
          region has an income of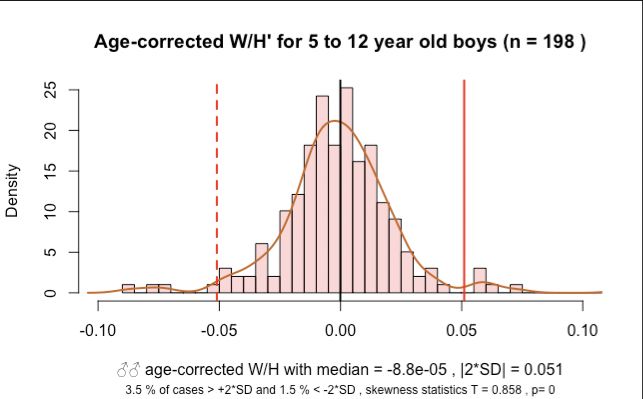
bioRxiv preprint first posted online Mar. 27, 2019; doi: http://dx.doi.org/10.1101/591172. The copyright holder for this preprint
 (which was not peer-reviewed) is the author/funder, who has granted bioRxiv a license to display the preprint in perpetuity.
                                  It is made available under a CC-BY 4.0 International license.

          appropriate interventions in pursuance of the WHO global nutrition target of
          improving maternal, infant and young child nutrition by 2025[5].

          The use of appropriate growth references is fundamental for reliably
          assessing malnutrition. In April 2006, the World Health Organization (WHO)
          released the WHO child growth standards, 16 years after a WHO working
          group on infant growth recommended that these standards should describe
          how children should grow rather than how they actually grow[7]. These
          standards, for children aged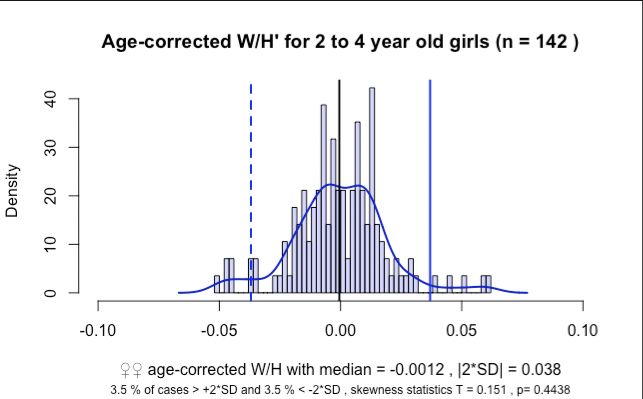
bioRxiv preprint first posted online Mar. 27, 2019; doi: http://dx.doi.org/10.1101/591172. The copyright holder for this preprint
 (which was not peer-reviewed) is the author/funder, who has granted bioRxiv a license to display the preprint in perpetuity.
                                  It is made available under a CC-BY 4.0 International license.

          study means for height were generally within ± 0.5 SD of the means in WHO
          growth standards, except for taller European populations and smaller
          populations in Saudi Arabia and Asian Indians[13]. Despite these clear
          differences, the WHO and others e.g. a recent editorial discussing the
          observed differences in Canadian children[9], claim that the WHO standards
          are adequate and ”suitable for everyone”[14]. The justification for this claim is
          based on two premises. The first is that the population-specific deviation from
          the reference is relatively small compared to the cut-off points for stunting,
          wasting and underweight generally assessed using the z-score below minus
          two standard deviations (-2 SD) from the median of the WHO reference
          population[15]. The second is that any individual health assessment needs to
          be interpreted in the individual context and the debate of “which growth chart
          is less wrong”[14] appears academic. Accepting these arguments, a large
          number of countries have adopted the WHO standards with only a few,
          especially in Europe, not implementing them since 2011[8,15].

          Whilst the WHO explicitly advises against country- or race-specific growth
          references[16], African Pygmies[17] (Note 1), which have a characteristically
          small body size (average adult height of 155 cm), merit explicit attention.
          Although the exact genetic mechanism remains tenuous, the Pygmy
          phenotype has genetic foundations impacting growth hormones and insulin-
          like growth factors[18]. Moreover, differences in growth patterns between
          Pygmy populations exist. For example, growth is faster during prenatal life in
          Eastern Pygmies such as the Efé and Sua, but slower during infancy in
          Western Pygmies, the Baka[18]. Baka growth rates are initially similar to non-
          Pygmies but then slow down significantly at about two years of age. However,
          adult Baka are similar in weight or even heavier than some Bantu populations
          in central Africa.

          Pygmy-specific growth charts have not been developed, as suggested by
          some authors[13], nor have data been collected to evaluate the impact of their
          growth patterns on estimates of malnutrition. This information may help better
          understand the impact of ethnic background on malnutrition in countries such
          as Cameroon[6,19] where there is a high prevalence of stunting and wasting

                                                                                                                                    6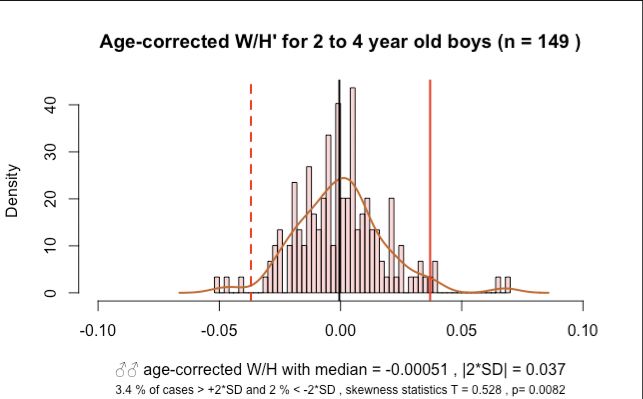
bioRxiv preprint first posted online Mar. 27, 2019; doi: http://dx.doi.org/10.1101/591172. The copyright holder for this preprint
 (which was not peer-reviewed) is the author/funder, who has granted bioRxiv a license to display the preprint in perpetuity.
                                  It is made available under a CC-BY 4.0 International license.

          overall[5]. Life expectancy at birth for Baka Pygmies in Cameroon is an
          average of 35 years of age compared to the sympatric Bantu population who
          live about 22 years longer6. Such health differences between these two
          groups have been highlighted in the Lancet special issue on indigenous
          health[20].

          In this study, we evaluate the applicability of WHO standards to quantify
          malnutrition in a sample of Pygmies populations living in south-eastern
          Cameroon. We assess stunting and wasting at an individual and population
          level. We also collected information on infection and anaemia rates to
          determine the overall health status of the subjects.

          Methods
          Methods
          Data collection
          Health data from Baka Pygmy children from the ages of one to 12 years old were
          collected in a total of 25 villages. Data were gathered in two separate campaigns in
          2010 and 2018. We sampled 23 villages in 2010, and 10 villages in 2018. All villages
          are located within the Djoum-Mimtom road axis in the Dja et Lobo Department of
          southern Cameroon. The area is covered in tropical rainforests and borders Gabon
          and Congo.

          Mobile clinics were set up in each village, under the auspices of Zerca y Lejos (ZyL),
          a Spanish NGO working on health and development issues in the region for over 15
          years. ZyL has had a presence in all our study villages for all this time, where they
          regularly employ school teachers and support agricultural activities and health[21].
          Our mobile clinics were open to all village inhabitants, who were encouraged to
          attend even if they were not unwell.

          A total of 1073 persons were attended during the two campaigns. In 2010, we
          examined 550 (1-15 years old) Baka children, but in 2018, as many as 523 persons
          (from 6 months to >18 years) were assessed. During the latter campaign, we
          examined 404 Baka and 119 Bantu persons, out of which there were 200 children
          that were included in this study. Because we had population census data for the 10
          villages sampled in 2018, we were able to calculate that between 30.3% and 90.3%
          (median 61.2%) of inhabitants were seen at the clinics.

                                                                                                                                    7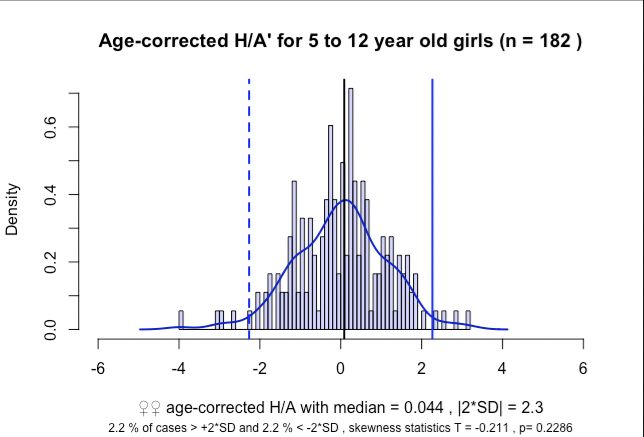
bioRxiv preprint first posted online Mar. 27, 2019; doi: http://dx.doi.org/10.1101/591172. The copyright holder for this preprint
 (which was not peer-reviewed) is the author/funder, who has granted bioRxiv a license to display the preprint in perpetuity.
                                  It is made available under a CC-BY 4.0 International license.

          A day before the clinic we held meetings with the village chiefs during which we
          obtained permission to perform out work. During the clinic, we verbally informed
          parents attending the clinics with their children of the purpose of the study and
          procedures used. Those who agreed to participate and to provide the data of their
          children for analyses gave written informed consent. Prior to data analysis, the
          names of participants were dissociated from all datasheets to maintain
          confidentiality. The Ministry of Science, Republic of Cameroon granted ethical
          approval.

          For each child, we recorded data on village, ethnicity (self-declared; Baka and
          Bantu), weight (kg) and height (cm), clinical data on Hg (g l-1), brachial perimeter
          (mm) and absence/presence of oedema, and estimated age (in three-month intervals
          for babies up to 2 years old and in years for all others). Age estimation posed
          particular challenges since there was no formal certification of date of birth. Mothers
          were asked for the age of their children in years, since exact ages in months was not
          always possible. We crosschecked age estimations by dental eruption, but this
          method also only allows categorisation in years.

          Statistical analyses
          We defined anaemia as a haemoglobin level two standard deviations below the
          mean for age according to WHO guidelines[22]. The web-based WHO Anthro Survey
          Analyser[23] was used to analyse anthropomorphic data of two to four year old Baka
          children with reference to the WHO Child Growth Standards. Henceforth we use H/A
          for height-for-age and W/L for weight-for-height. Observed data were compared to
          the growth potential as defined by WHO´s z-scores for healthy children. Cut-off
          criteria for z-scores for the identification of malnutrition in individuals were < -2 SD for
          wasting and stunting, < -3 SD for severe wasting and severe stunting, and > +2 SD
          for obesity.

          We used the statistical software R[24] to further characterise the population-level
          measures for H/A and W/H in Baka children and to extend the analysis to five to 12
          year old children, which is not covered by the WHO Anthro Survey Analyser[23]. We
          first age- and sex-corrected H/A and W/H values by subtracting the mean from all
          observations in each age and sex category retaining the same sign for uncorrected

                                                                                                                                    8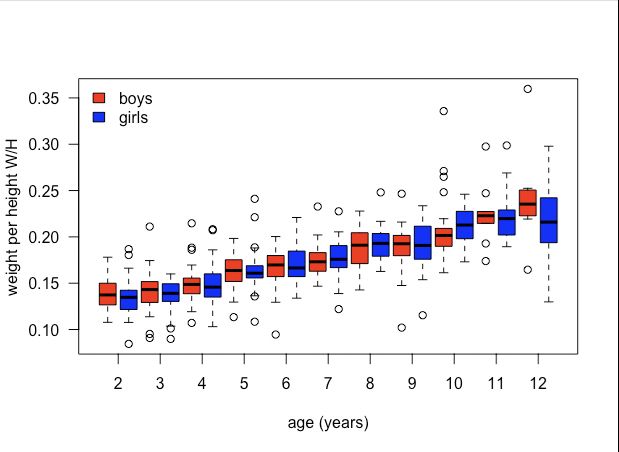
bioRxiv preprint first posted online Mar. 27, 2019; doi: http://dx.doi.org/10.1101/591172. The copyright holder for this preprint
(which was not peer-reviewed) is the author/funder, who has granted bioRxiv a license to display the preprint in perpetuity.
It is made available under a CC-BY 4.0 International license.
and corrected values. Skewness of the sample was statistically tested by a test for
normality as implemented in the R package “normtest”[25] with 10,000 Monte Carlo
Simulations.
Results
Anthropometrics
Height and weight measures were taken for a total of 685 children of 2 - 12
years; 2010 (n=460) and 2018 (n=213). H/A ratios changed rapidly from large
values with large variances up to the age of about 7 years and then
proceeded at more constant rate with lower variance (Figure 1). W/H ratios
increased consistently with age with a slight increase in variances.
Values for stunting, wasting and obesity were similar for boys and girls, and
showed large overlaps of the 95% confidence intervals, calculated by the
WHO Anthro Survey Analyzer (Table 1). Stunting, defined relative to the WHO
child growth standard, was very high at 68.4% (95% CI: 62.8% - 73.5%) for 2-
4 year olds (Table 1). Almost every second child was severely stunted, 45.5%
(39.8% - 51.3%). There was slightly more wasting at 8.2% (5.6% - 12.0%)
than obesity at 6.5% (4.2%% - 10.0%). When using the distribution of H/A
and W/H values of the study population to define malnutrition, values for
stunting were dramatically lower than defined by the WHO standards for both
age brackets with 1.0% for 2-4 year olds and 2.9% for 5-12 year olds. In each
age class, the population-based obesity proportion was 2.4% and 3.9% higher
than the respective level of wasting, which as 2.7% and 1.8%, respectively.
Thus, population-based wasting was about a third of the value estimated with
WHO standards.
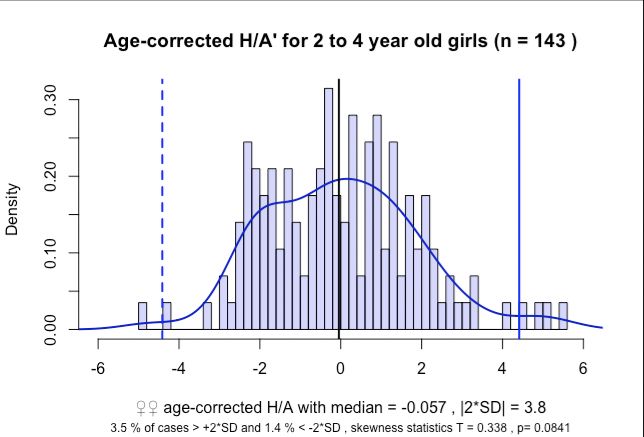
The distributions of measurements were not significantly different from normal
distributions for girls in both age classes for H/A (Figure 2) and W/H (Figure
3), respectively. Significant skew was observed in boys for both H/A (Figure 2)
and W/H (Figure 3) in both age classes. Despite these differences in
skewness in boys and girls, the extent of the skew was in each case very
small as indicated by the very small differences between means and medians
(Figures 2 and 3). There was not only no bias towards stunting or wasting, but
9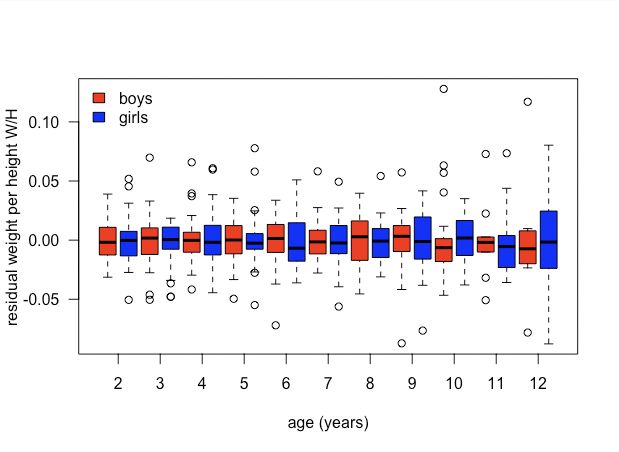
bioRxiv preprint first posted online Mar. 27, 2019; doi: http://dx.doi.org/10.1101/591172. The copyright holder for this preprint
 (which was not peer-reviewed) is the author/funder, who has granted bioRxiv a license to display the preprint in perpetuity.
                                  It is made available under a CC-BY 4.0 International license.

          the population-based estimates for obesity exceeded wasting for boys in both
          age classes (Table 1).

          Health assessments
          Presence/absence of oedema was checked for 213 children; only one positive
          case (0.5%) was recorded. Brachial perimeters ranged from 116 mm to 195
          mm (mean = 152.4 mm, median = 153 mm, n = 121) and only two cases
          (1.7%) were smaller than 125 mm. Haemoglobin concentrations indicated no
          anaemia for 293 children (46.7%, n = 628). Mild, moderate and severe
          anaemia was observed in 23.4%, 26.6% and 3.3% of children, respectively.

          Discussion
          Sub-Saharan African countries remain exposed to the highest levels of child
          malnutrition[5]. In Cameroon, the average level of malnourishment ranks
          intermediate with 32.5% and 5.6% of reported stunting and wasting – defined
          based on WHO global standards - compared to averages of 28.8% (95% CI:
          21.4 - 36.2) and 6.7% (95% CI: 4.2 - 9.2) for Central Africa[5]. Estimates of
          severe acute malnutrition in national surveys ranged from 1.9% in 2011 to
          1.3% in 2014[5]. As in other sub-Saharan countries, Cameroon is ethnically
          highly diverse. However, how different ethnic groups differ with respect to
          malnutrition remains unknown. Studies have either concentrated on the
          dominant population segment, the ethnically diverse Bantu cluster[26], or
          have reported results from ethnically highly diverse health centres without
          including ethnicity in the analysis[27,28].

          Representativeness of the study population
          The Baka Pygmies are a minority indigenous group that remain socio-
          economically highly disadvantaged. As a consequence, they suffer from
          considerably lower average health and shorter life expectancy compared to
          the majority sympatric Bantu population[6]. Since The Lancet´s recent focus
          on indigenous health, which spearheaded the predicament of the Baka[20],
          our study is the first to specifically present information on anthropometric
          indicators of Baka children. We are aware that our results may not be entirely
          representative of the whole Baka population because our data were taken

                                                                                                                                    10
bioRxiv preprint first posted online Mar. 27, 2019; doi: http://dx.doi.org/10.1101/591172. The copyright holder for this preprint
(which was not peer-reviewed) is the author/funder, who has granted bioRxiv a license to display the preprint in perpetuity.
It is made available under a CC-BY 4.0 International license.
from only one region where this group is currently found. Nonetheless, the
sample coverage of our study villages was high, and our data represent the
only information currently available on WHO growth standards for any Pygmy
group. We confirm this on the basis of an extensive research we carried out of
the peer-reviewed literature for Pygmies in general, prior to the study. Our
study is also robust in that we focussed on general heath screening of
children (and adults) and did not concentrate on malnourished individuals.
The distribution of the data does not indicate any bias towards stunting in the
population and there was even slightly more obesity than wasting observed,
both supporting a reasonable representativeness of the study population to
evaluate the adequacy of the WHO standards for Pygmies. The height data
for 2 - 12 years indicate the obvious[18], namely that Baka children are on
average small, but we challenge whether the WHO standards are
representative and suitable to act as markers of their malnutrition.
Meaningless stunting rates
A stunting rate, based on the WHO standards, of 68.4% for 2 - 4 year olds is
astonishingly high compared to anywhere in the world (including Sub-Saharan
Africa, where the rate was highest in Burundi in Eastern Africa with 57.7%)[5]
and is, to the best of our knowledge, the highest globally recorded value. On
the other hand, stunting when determined by the data from the population is
only 1% for the same age class. The difference between these two estimates
is extreme. What “real”, health-relevant levels of stunting are, remains,
however, unclear. Height-per-age values are nearly normally distributed in
Baka and do not indicate any skew towards relative shortness in the
population (Figure 2). The exceptionally high WHO-based estimate is most
likely caused by the by the growth curves of the Baka Pygmies, because their
small phenotype has strong genetic foundations[18].
Problematic wasting rates
Wasting in Baka 2 - 4 year olds was 8.2% higher than the 5.6% reported from
the Cameroonian national survey, but lower than in 12 out of the 32 surveyed
sub-Saharan African countries, where the highest level was reported for Niger
with 18%[5]. However, similar to stunting, the results leave open the question
11bioRxiv preprint first posted online Mar. 27, 2019; doi: http://dx.doi.org/10.1101/591172. The copyright holder for this preprint
(which was not peer-reviewed) is the author/funder, who has granted bioRxiv a license to display the preprint in perpetuity.
It is made available under a CC-BY 4.0 International license.
of how representative is the anthropometric indicator for “wasting”. The
percentage is possibly overestimated by the WHO child growth standards and
underestimated by using the sample population itself as a reference. Even
within Pygmies, there is variation in the genetic basis determining growth
patterns as shown by the reported differences between Western and Eastern
groups[18]. The impact on W/H has, however, not been determined. Like
height-per-age, weight-per-height values are nearly normally distributed
(Figure 3), producing similar percentages of wasting and obesity, respectively,
for both, the application of the WHO standard and the Baka populations as
reference. Shapes of distribution curves and obesity levels for Sub-Saharan
African countries, have, however, not been considered in meta-analyses and
are thus unavailable for comparison[5]. Considering all the additional
indicators for malnutrition, especially the low life expectancy at birth for Baka
in general and the high levels of anaemia in our study, the occurrence of
obesity at similar levels as wasting is surprising and remains unexplained.
Inadequacy of WHO growth standards for Pygmies
It is obvious that the specific case of Pygmies renders the often vehemently
defended assumption that the WHO Child Growth Standards should be
applied regardless of ethnicity[8,14–16] as inadequate for the height-per-age
parameter. There is, of course, a logistic and economic imperative to apply
the same child growth standards and to aim for the same model for optimal
growth independently of ethnicity[15,16]. A number of studies have already
argued that the WHO growth charts do not perfectly fit all combinations of
ethnic/socio-economic background and ongoing secular trends, and no
reference population or growth standard can provide an optimal statistical
fit[14]. Thus, the problem of which approach to use seems to boil down to
which method is ‘least wrong’. For the majority of populations under similar
socio-economic situations, this question justifiably appears to matter little
because the WHO growth standard seems to provide a reasonable
standard[14]. However, the impact of the Pygmy phenotype on the
identification of malnutrition, in particular stunting, is so extreme that the
application of the WHO growth standard cannot be justified. Here, we also
acknowledge that any ethnicity-based consideration for health care must be
12bioRxiv preprint first posted online Mar. 27, 2019; doi: http://dx.doi.org/10.1101/591172. The copyright holder for this preprint
(which was not peer-reviewed) is the author/funder, who has granted bioRxiv a license to display the preprint in perpetuity.
It is made available under a CC-BY 4.0 International license.
done with utmost concern for the highest ethical and moral standards,
especially in ethnically diverse regions where ethnicity has played such a
large role in human armed conflicts and persecutions. Possible or alleged
genetic differences between human groups has been severely misused in the
past and the consideration of such differences has provoked strong ethical
concerns[29]. Although never expressed, these concerns might play a strong
role in favouring a “seemingly inapplicable universal growth standard”.
However, the WHO growth standards produce so vastly exaggerated stunting
values and likely also bias other estimates of malnutrition that their application
in Pygmy populations is not only obsolete but might be counterproductive.
Consequences for development goals and individual health care
Given the uncertainty in interpreting the levels of observed wasting and
obesity when applying WHO standards and or when using the within-
population analysis, our data strongly indicate that the information gained
from the analysis of anthropometric child data in Baka in particular and
Pygmies in general is insufficient. It is therefore difficult to propose adequately
targeted individual health care or clear national and international health
policies for this ethnic group. Without a proper standard, the normally powerful
parameter height-for-age will leave the clinician without the background
information that is necessary to interpret these data[14].
On a population level, the current info on stunting and wasting in Baka are
insufficient to provide meaningful information for achieving the UN
Sustainable Development Goals for Baka, not to mention other Pygmy tribes
which are even more data deficient. We also do not know how the growth
patterns associated with the differing Pygmy genetic background affect
national estimates of stunting and wasting not only in Cameroon but also in all
the other West, Central and Eastern African countries with Pygmies, as
genetic admixtures occur.
At an individual level, the application of the WHO standards in Pygmies opens
the door for misinterpretation of the data by health practitioners and parents;
the anthropometric variables can easily be wrongly understood as
13bioRxiv preprint first posted online Mar. 27, 2019; doi: http://dx.doi.org/10.1101/591172. The copyright holder for this preprint
(which was not peer-reviewed) is the author/funder, who has granted bioRxiv a license to display the preprint in perpetuity.
It is made available under a CC-BY 4.0 International license.
representing abnormal growth, and as a result mistaken or unnecessary
solutions such as supplementary feeding prescribed. Considering that the
central African region is under severe socio-economic pressures and focus of
numerous politico-religious crises, armed conflicts and population
displacements, health care is often overstretched making the necessary
careful examination of anthropometric data less reliable. There are now
concerted efforts to provide optimal health care to diminish the occurrence of
severe acute malnutrition in Central Africa[28]. These laudable attempts could
be disastrously undermined if misguided advice is given based on wrong
growth standards.
The inadequacy of the UN growth standards for Pygmies highlights the urgent
need to develop specific standards for ethnically and population genetically
distinct groups, as already suggested in other studies[13]. If we are not to fail
these more vulnerable and disadvantaged groups of people[5] [6,19] in areas
that also likely to be affected by climate change[30], we need to act now to
provide baseline data to evaluate children’s growth based on standards
specific to their ethnic background.
Contributors
JEF, BPG, NAP and GRB were responsible for the study design. SMB
undertook the data analysis, data interpretation, figure construction, and
manuscript writing. JEF and BPG contributed to data interpretation, and
manuscript writing. AI contributed to the data interpretation, and manuscript
writing. Data in the field were gathered by BPG, NAP, MAA, YHS, RP, GRB,
MA, EAM, RO, BAZ, AMC, CGS, CRLG, FLRS, HA, and IAR. All authors
approved the final version to be published.
Declaration of interests
We declare no competing interests.
Acknowledgments
We thank Maria Rebollo for allowing us to use data gathered during the 2010
campaign. Julienne Meyina and Mirabelle Assampelle, nurses within the
14bioRxiv preprint first posted online Mar. 27, 2019; doi: http://dx.doi.org/10.1101/591172. The copyright holder for this preprint
(which was not peer-reviewed) is the author/funder, who has granted bioRxiv a license to display the preprint in perpetuity.
It is made available under a CC-BY 4.0 International license.
Zerca y Lejos health programme, assisted during the campaigns. Funding
was provided by the UK Darwin Initiative (Project 24029).
References
1. Heaton TB, Crookston B, Pierce H, Amoateng AY. Social inequality and
children’s health in Africa: a cross sectional study. International Journal
for Equity in Health. 2016;15. doi:10.1186/s12939-016-0372-2
2. Pridmore P, Carr-Hill R. Tackling the drivers of child undernutrition in
developing countries: what works and how should interventions be
designed? Public Health Nutrition. 2011;14: 688–693.
doi:10.1017/S1368980010001795
3. WHO. Global Database on Child Growth and Malnutrition. In: World
Health Organization [Internet]. 2018 [cited 5 Jul 2018]. Available:
http://www.who.int/nutgrowthdb/about/en/
4. United Nations. The Sustainable Development Goals Report 2017. New
York: United Nations; 2017.
5. Akombi BJ, Agho KE, Merom D, Renzaho AM, Hall JJ. Child malnutrition
in sub-Saharan Africa: A meta-analysis of demographic and health
surveys (2006-2016). Wieringa F, editor. PLOS ONE. 2017;12:
e0177338. doi:10.1371/journal.pone.0177338
6. Anderson I, Robson B, Connolly M, Al-Yaman F, Bjertness E, King A, et
al. Indigenous and tribal peoples’ health (The Lancet–Lowitja Institute
Global Collaboration): a population study. The Lancet. 2016;388: 131–
157. doi:10.1016/S0140-6736(16)00345-7
7. Bloem M. The 2006 WHO child growth standards. 2007;334: 705–706.
doi:10.1136/bmj.39155.658843.BE
8. WHO Multicentre Growth Reference Study Group. WHO Child Growth
Standards based on length/height, weight and age: WHO Child Growth
Standards. Acta Paediatrica. 2006;Suppl 145: 76–85. doi:10.1111/j.1651-
2227.2006.tb02378.x
9. Park AL, Tu K, Ray JG, the Canadian Curves Consortium. Differences in
growth of Canadian children compared to the WHO 2006 Child Growth
Standards. Paediatric and Perinatal Epidemiology. 2017;31: 452–462.
doi:10.1111/ppe.12377
10. NCD Risk Factor Collaboration (NCD-RisC). A century of trends in adult
human height. eLife. 2016;5. doi:10.7554/eLife.13410
11. Robinson MR, Hemani G, Medina-Gomez C, Mezzavilla M, Esko T,
Shakhbazov K, et al. Population genetic differentiation of height and body
15bioRxiv preprint first posted online Mar. 27, 2019; doi: http://dx.doi.org/10.1101/591172. The copyright holder for this preprint
(which was not peer-reviewed) is the author/funder, who has granted bioRxiv a license to display the preprint in perpetuity.
It is made available under a CC-BY 4.0 International license.
mass index across Europe. Nature Genetics. 2015;47: 1357–1362.
doi:10.1038/ng.3401
12. Jelenkovic A, Sund R, Hur Y-M, Yokoyama Y, Hjelmborg J v. B, Möller S,
et al. Genetic and environmental influences on height from infancy to
early adulthood: An individual-based pooled analysis of 45 twin cohorts.
Scientific Reports. 2016;6. doi:10.1038/srep28496
13. Natale V, Rajagopalan A. Worldwide variation in human growth and the
World Health Organization growth standards: a systematic review. BMJ
Open. 2014;4: e003735. doi:10.1136/bmjopen-2013-003735
14. Ong KK. WHO Growth Standards - Suitable for Everyone? Yes.
Paediatric and Perinatal Epidemiology. 2017;31: 463–464.
doi:10.1111/ppe.12396
15. de Onis M, Onyango A, Borghi E, Siyam A, Blössner M, Lutter C.
Worldwide implementation of the WHO Child Growth Standards. Public
Health Nutrition. 2012;15: 1603–1610. doi:10.1017/S136898001200105X
16. de Onis M. Child Growth and Development. In: Semba RD, Bloem MW,
editors. Nutrition and health in developing countries. 2nd ed. Totowa, NJ:
Humana Press; 2008. pp. 133–138.
17. Olivero J, Fa JE, Farfán MA, Lewis J, Hewlett B, Breuer T, et al.
Distribution and Numbers of Pygmies in Central African Forests.
Caramelli D, editor. PLOS ONE. 2016;11: e0144499.
doi:10.1371/journal.pone.0144499
18. Ramírez Rozzi FV, Koudou Y, Froment A, Le Bouc Y, Botton J. Growth
pattern from birth to adulthood in African pygmies of known age. Nature
Communications. 2015;6. doi:10.1038/ncomms8672
19. Ohenjo N, Willis R, Jackson D, Nettleton C, Good K, Mugarura B. Health
of Indigenous people in Africa. The Lancet. 2006;367: 1937–1946.
doi:10.1016/S0140-6736(06)68849-1
20. The Lancet. Indigenous health: a worldwide focus. The Lancet.
2016;388: 104. doi:10.1016/S0140-6736(16)31020-0
21. Zerca y Lejos [Internet]. [cited 24 Oct 2018]. Available:
http://zercaylejos.org/?lang=en
22. World Health Organization. Haemoglobin concentrations for the
diagnosis of anaemia and assessment of severity. 2011;
23. WHO. The WHO Anthro Survey Analyser. In: World Health Organization
[Internet]. 2018 [cited 5 Jul 2018]. Available:
https://whonutrition.shinyapps.io/anthro/
24. R Foundation for Statistical Computing. R [Internet]. 2016. Available:
https://www.r-project.org
16bioRxiv preprint first posted online Mar. 27, 2019; doi: http://dx.doi.org/10.1101/591172. The copyright holder for this preprint
(which was not peer-reviewed) is the author/funder, who has granted bioRxiv a license to display the preprint in perpetuity.
It is made available under a CC-BY 4.0 International license.
25. Gavrilov I, Pusev R. Package ‘normtest.’ 2015.
26. Nagahori C, Kinjo Y, Tchuani JP, Yamauchi T. Malnutrition among
vaccinated children aged 0-5 years in Batouri, Republic of Cameroon.
Journal of General and Family Medicine. 2017;18: 365–371.
doi:10.1002/jgf2.104
27. Chiabi A, Malangue B, Nguefack S, Dongmo FN, Fru F, Takou V, et al.
The clinical spectrum of severe acute malnutrition in children in
Cameroon: a hospital-based study in Yaounde, Cameroon. Translational
Pediatrics. 2017;5: 32–39. doi:10.21037/tp.2016.07.05
28. Ndzo JA, Jackson A. Outcomes of children aged 6–59 months with
severe acute malnutrition at the GADO Outpatient Therapeutic Center in
Cameroon. BMC Research Notes. 2018;11. doi:10.1186/s13104-018-
3177-0
29. Winegard B, Winegard B, Boutwell B. Human Biological and
Psychological Diversity. Evolutionary Psychological Science. 2017;3:
159–180. doi:10.1007/s40806-016-0081-5
30. Berrang-Ford L, Dingle K, Ford JD, Lee C, Lwasa S, Namanya DB, et al.
Vulnerability of indigenous health to climate change: A case study of
Uganda’s Batwa Pygmies. Social Science & Medicine. 2012;75: 1067–
1077. doi:10.1016/j.socscimed.2012.04.016
17bioRxiv preprint first posted online Mar. 27, 2019; doi: http://dx.doi.org/10.1101/591172. The copyright holder for this preprint
(which was not peer-reviewed) is the author/funder, who has granted bioRxiv a license to display the preprint in perpetuity.
It is made available under a CC-BY 4.0 International license.
Note 1. Use of the term Pygmy
Although numerous alternative terms to Pygmy have been used to refer the
rainforest hunter-gatherers of the Congo Basin, none have been agreed upon
by academics or the people themselves to replace it. Although some
academics and Central African government officers feel the term Pygmy is
derogatory or does not adequately represent the people, the term Pygmy
sensu lato, to refer to all hunter-gatherer groups in Central Africa, is widely
used by a broad group of people in Europe, Japan, the United States and
Africa. Moreover, International and local NGOs use the term in their titles or
literature e.g. Pygmy Survival Alliance, Forest Peoples’ Programme. Survival
International, Rainforest Foundation, Reseau Recherches Actions
Concerteees Pygmees, Centre d’Accompagnement des Autochtones
Pygmees et Minoritaires Vulnerables and the Association for the Development
of Pygmy Peoples of Gabon. Congo Basin conservation groups, such as
World Wildlife Fund and Wildlife Conservation Society and international
human rights groups working in the region, such as UNICEF and Integrated
Regional Informaton Networks (IRIN), also regularly use the term Pygmy in
their literature.
We consider all groups under the umbrella of Pygmy as expressing an
equivalent spatial relationship between their presence and their immediate
environment. In so doing, we do not ignore the fact that various ‘Pygmy’
groups express distinct cultures and in some case ethnicity from other
‘Pygmy’ groups, and is not meant in any way a disrespect to the various
ethnicities. Although it is likely that there may be cultural reasons for
geographical location and distribution, we argue that the ecological setting is a
primary driver in humans in choosing localities to live in. Ichikawa
(2014)14:332-3 – ‘The forest plants and animals provide the people with the
basis for their cultural identity. Their life and culture cannot be maintained
without the forest in its entirety … The destruction of the forest would result in
the deterioration of a culture that is heavily dependent on, and in very
significant ways a part of, the Congo Basin rainforest.’
18bioRxiv preprint first posted online Mar. 27, 2019; doi: http://dx.doi.org/10.1101/591172. The copyright holder for this preprint
(which was not peer-reviewed) is the author/funder, who has granted bioRxiv a license to display the preprint in perpetuity.
It is made available under a CC-BY 4.0 International license.
Table 1. Summary of malnutrition in Baka children aged 2 to 12 years. The
parameters wasting, stunting and obesity are defined relative to a reference
population, which is the study population except for the WHO Anthro Survey
Analyser, which applied the WHO child growth standard.
2-4 year olds 2-4 year olds 5-12 year olds
Reference population to
define stunting, wasting & WHO growth standard Population sample Population sample
obesity
stunting
∑ 68.4 (62.8; 73.5), n=288 1.03, n=292 2.89, n=381
♀♀ 62.9 (54.7; 70.5), n=143 1.40, n=143 2.20, n=182
♂♂ 73.8 (66.0; 80.3), n=145 0.67, n=149 3.52, n=199
wasting
∑ 8.2 (5.6; 12.0), n=291 2.75, n=291 1.84, n=380
♀♀ 8.5 (4.8; 14.3), n=142 3.52, n=142 2.20, n=182
♂♂ 8.1 (4.6; 13.7), n=149 2.01, n=149 1.52, n=198
obesity
∑ 6.5 (4.2; 10.0), n=291 3.44, n=291 3.95, n=380
♀♀ 4.9 (2.4; 10.0), n=142 3.52, n=142 4.40, n=182
♂♂ 8.1 (4.6; 13.7), n=149 3.36, n=149 3.54, n=198
19bioRxiv preprint first posted online Mar. 27, 2019; doi: http://dx.doi.org/10.1101/591172. The copyright holder for this preprint
(which was not peer-reviewed) is the author/funder, who has granted bioRxiv a license to display the preprint in perpetuity.
It is made available under a CC-BY 4.0 International license.
Figure Legends
Figure 1. Height per age (top) and weight per height (bottom) in Baka Pygmy
children aged two to twelve years.
Figure 2. H/A scores and population-defined stunting
Distributions, means, medians and ±2SD boundaries of age-corrected H/A
scores for two-to-four year old (left) and five to-twelve year old right) Baka
boys (top) and girls (bottom). Shown are the observed frequencies of age-
corrected H/A scores (histograms), density distributions (solid curves),
medians and ±2SD boundaries for each gender in each age-class. For each
gender / age-class combination, percentages of cases where the ±2SD
boundaries are exceeded, the test statistics T and resulting p-value of the
skewness test are noted.
Figure 3. W/H scores and population-defined stunting.
For details see description for Figure 2.
20bioRxiv preprint first posted online Mar. 27, 2019; doi: http://dx.doi.org/10.1101/591172. The copyright holder for this preprint
(which was not peer-reviewed) is the author/funder, who has granted bioRxiv a license to display the preprint in perpetuity.
It is made available under a CC-BY 4.0 International license.
Figure 1
21bioRxiv preprint first posted online Mar. 27, 2019; doi: http://dx.doi.org/10.1101/591172. The copyright holder for this preprint
(which was not peer-reviewed) is the author/funder, who has granted bioRxiv a license to display the preprint in perpetuity.
It is made available under a CC-BY 4.0 International license.
Figure 2
22bioRxiv preprint first posted online Mar. 27, 2019; doi: http://dx.doi.org/10.1101/591172. The copyright holder for this preprint
(which was not peer-reviewed) is the author/funder, who has granted bioRxiv a license to display the preprint in perpetuity.
It is made available under a CC-BY 4.0 International license.
Figure 3
23You can also read