Air Quality Improvement from COVID-19 Lockdown in the East African Community: Evidences from Kampala and Nairobi Cities
←
→
Page content transcription
If your browser does not render page correctly, please read the page content below
Open Access Library Journal
                                                                                                           2021, Volume 8, e7389
                                                                                                          ISSN Online: 2333-9721
                                                                                                            ISSN Print: 2333-9705

Air Quality Improvement from COVID-19
Lockdown in the East African Community:
Evidences from Kampala and Nairobi Cities

Juliet Angom1,2 , Christopher Angiro3,4 , Timothy Omara5,6,7*
1
  Department of Management, Amrita Vishwa Vidyapeetham, AIMS Campus, Amrita Lane AIMS Ponekkara, Kochi, Kerala, India
2
  Bureau of Integrated Rural Development, Kwame Nkrumah University of Science and Technology (KNUST), Kumasi, Ghana
3
  Department of Chemistry, Faculty of Science, Kyambogo University, Kampala, Uganda
4
  National Livestock Resources Research Institute, National Agricultural Research Organization, Kampala, Uganda
5
  Department of Chemistry and Biochemistry, School of Sciences and Aerospace Studies, Moi University, Eldoret, Kenya
6
  Africa Center of Excellence II in Phytochemicals, Textiles and Renewable Energy (ACE II PTRE), Moi University, Eldoret, Kenya
7
  Department of Quality Control and Quality Assurance, AgroWays Uganda Limited, Jinja, Uganda

How to cite this paper: Angom, J., Angiro,    Abstract
C. and Omara, T. (2021) Air Quality
Improvement from COVID-19 Lockdown            A novel highly infectious disease (Corona virus disease-2019, COVID-19) has
in the East African Community: Evidences      been an unprecedented global crisis. Following COVID-19 break out from
from Kampala and Nairobi Cities. Open
                                              Wuhan to the rest of the world, various countries adopted partial or total
Access Library Journal, 8: e7389.
https://doi.org/10.4236/oalib.1107389         lockdowns to curb its progression or mitigate it. Lockdowns left drastic ef-
                                              fects on health, physiological, social, economic and environmental fronts.
Received: April 5, 2021                       This study reports on the impacts of COVID-19-induced human mobility re-
Accepted: June 26, 2021
Published: June 29, 2021
                                              strictions on atmospheric levels of nitrogen dioxide (NO2) and particulate
                                              matter represented in absorbing aerosol index (AAI) in Kampala, Nairobi
Copyright © 2021 by author(s) and Open        and Dar es Salaam cities of Uganda, Kenya and Tanzania in the East African
Access Library Inc.
                                              Community. Using satellite data, it was found that NO2 emissions decreased
This work is licensed under the Creative
Commons Attribution International             by about 6.0% and 8.91% in Kampala and Nairobi whereas AAI decreased by
License (CC BY 4.0).                          about 1.91% in 2020. In Dar es Salaam, NO2 emissions increased by about
http://creativecommons.org/licenses/by/4.0/   1.16% while the AAI remained almost constant in the same period. It is con-
               Open Access
                                              cluded that although there were substantial reductions in air pollution during
                                              2020 (particularly the COVID-19 lockdown periods) in Kampala and Nairobi,
                                              these are not sustainable and deterioration of air quality after lifting of the re-
                                              strictions has started to occur. Therefore, legislative actions need to be upheld
                                              to maintain air quality within the recommended levels.

                                              Subject Areas
                                              Environmental Chemistry, Air Pollution

DOI: 10.4236/oalib.1107389       Jun. 29, 2021                    1                                   Open Access Library Journal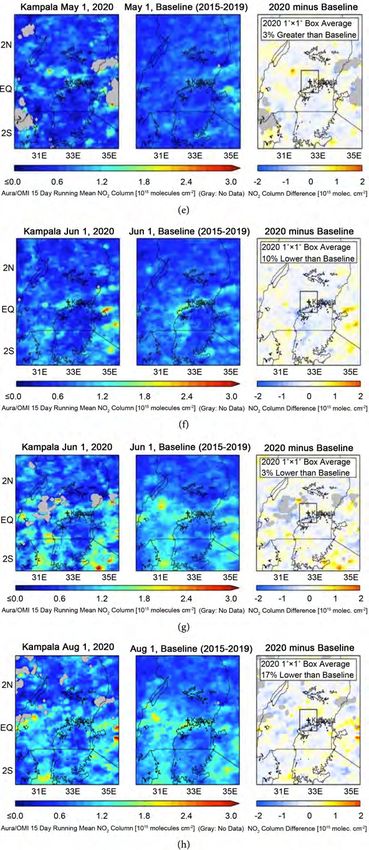
J. Angom et al.

                               Keywords
                               Absorbing Aerosol Index, Nitrogen Dioxide, Particulate Matter,
                               Corona Virus Disease-19 (COVID-19)

                             1. Introduction
                             The Coronavirus disease-2019 (COVID-19) pandemonium has been a tragedy
                             with outlasting aggregate health, environmental and economic impacts globally
                             [1]. COVID-19, whose causative virus is a positive-sense single-stranded RNA
                             β-coronavirus (SARS-CoV-2) is highly infective [2] as evidenced by its rapid
                             spill over to the rest of the world from China between December 2019 and
                             March 2020 [3]. It was first appreciated among a cluster of 27 pneumonia-like
                             case patients in the Chinese city of Wuhan (Hubei province) on 12th December
                             2019 before it gripped onto the rest of the world. The virus marks the seventh
                             incidence of coronaviruses ever reported in human history. COVID-19 was de-
                             clared a Public Health Emergency of International Concern on January 30th,
                             2020 by the World Health Organization [4] before it was finally announced as a
                             pandemic on March 22nd, 2020 [5]. To curb the spillage of the ill-fated virus,
                             most countries initially imposed lockdowns and restricted international flights,
                             which paralyzed most industrial activities. As of 1st February 2021, at least
                             2,222,647 mortalities and 102,584,351 confirmed cases of COVID-19 had been
                             reported globally, with the United States of America in the lead of the highest
                             number of reported cumulative cases [6].
                                The East African Community (EAC), just like the rest of the world suffered
                             the brunt of COVID-19 which reached it by importation. Kenya was the first to
                             record its coronavirus case on 12th March 2020, followed by Rwanda and Tanza-
                             nia on 14th and 16th March 2020, Uganda on March 21st, 2020 while Burundi and
                             South Sudan registered their first cases on 25th March 2020 and 5th April 2020
                             [7]. Of these countries, Rwanda and Uganda initially contained the pandemic
                             quite well, compared to others. As of 1st February 2021 (the time of this writing),
                             at least 161,726 confirmed cases, 112,742 recoveries and 2370 mortalities due to
                             COVID-19 have been reported in the EAC [8].
                                The EAC embraced COVID-19 containment measures including mandatory
                             institutional and self-quarantines, social distancing, restriction of international
                             flights to and from high-risk countries, reduction of economic and social activi-
                             ties i.e. lockdowns and curfews. Rwanda was the first country in the EAC and
                             Sub-Saharan Africa at large to implement total lockdown on 17th March 2020.
                             This was later followed by Uganda on 31st March 2020 as a presidential strategy
                             to curb the pandemic spread. Kenya imposed initially a partial lockdown on 6th
                             April 2020 but later extended it to a total lockdown as COVID-19 cases in-
                             creased [7]. This study reported on the impacts of the pandemic-induced human
                             mobility restrictions on atmospheric levels of nitrogen dioxide emissions and

DOI: 10.4236/oalib.1107389                         2                                  Open Access Library Journal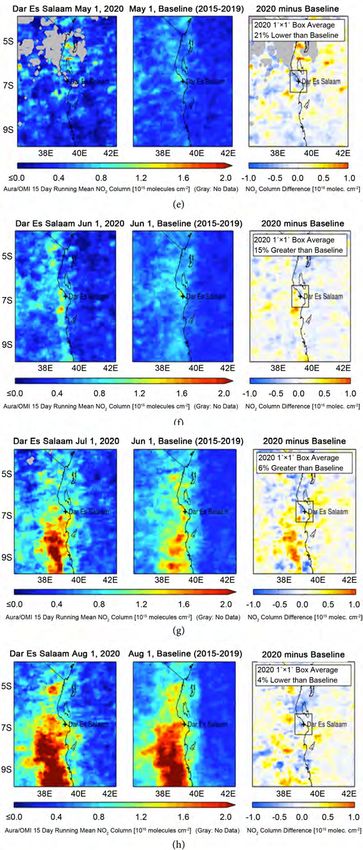
J. Angom et al.

                             particulate matter represented in absorbing aerosol index in Kampala, Nairobi
                             and Dar es Salaam cities of the EAC.

                             2. Methods
                             2.1. Study Area and Selection of Studied Cities
                             The current study was undertaken in the EAC, a consortium of countries form-
                             ing one of the developing communities of the world. It is a regional intergo-
                             vernmental organization of six (6) partner states (Figure 1) in the African Great
                             Lakes region of Eastern Africa namely: Uganda, Kenya, Rwanda, Tanzania, Bu-
                             rundi and South Sudan. Its headquarters is in Arusha, Tanzania [9].
                                As outliers with Burundi among the East African responses to COVID-19
                             pandemic, Tanzania (Dar es Salaam) was considered in this study as a reference
                             rather than a case study. The two countries (Uganda and Kenya) have been cho-
                             sen because the former enforced a complete lockdown earlier while the latter
                             started with a partial lockdown followed by a total lockdown. The major deter-
                             mining factors for the choice of these countries were because they were the only
                             countries in the EAC for which nitrogen dioxide (NO2) emissions satellite data
                             were available from National Aeronautics and Space Administration (NASA)
                             database.

                             Figure 1. Map of East African Community showing member countries with the cities
                             under study.

DOI: 10.4236/oalib.1107389                        3                                 Open Access Library Journal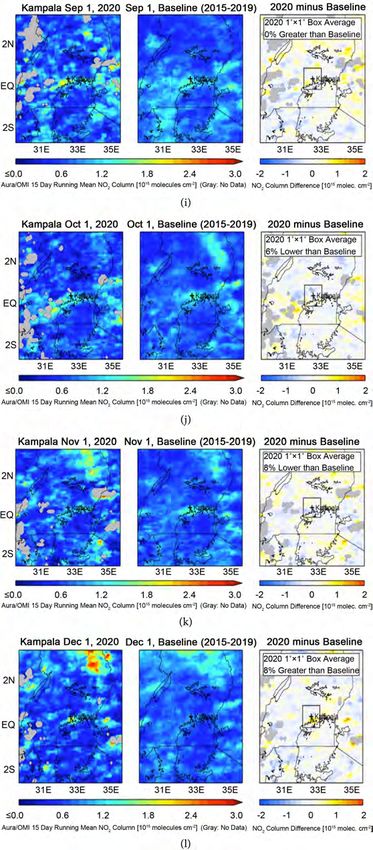
J. Angom et al.

                             2.2. Study Design
                             This study used satellite monitoring measurements for air pollutants recorded
                             from the onset of COVID-19 in January 2020 through partial to complete
                             COVID-19 lockdowns until December 2020 in the EAC. The baseline period
                             used were the years 2015-2019 for nitrogen dioxide emissions and 2019 for the
                             absorption aerosol index. We adopted this approach because the faculty of satel-
                             lite devices in remote sensing of the lower troposphere has improved considera-
                             bly over the years. Aerosol factors, for instance, are verifiable on spatial scales of
                             a few kilometers using the space-borne radiometers [10]. Further, nitrogen dio-
                             xide along with other trace gases can be effectively identified on urban levels us-
                             ing spectrometers [10]. Unlike field monitoring stations that forecasts only va-
                             cillations in air quality or assess emissions at discrete points, satellite monitoring
                             offsets this drawback with its faculty to model horizontal transportation of air
                             pollutants for both long- and short periods [11]. This singular aspect, enhances
                             greatly, synoptic and geospatial knowledge of ground-based air quality data [11].
                             In this context, data from satellite monitoring can be harnessed for establishing
                             regions with the highest concentrations or furnishing warnings of upcoming air
                             quality events such as wildfires and dust storms. Another advantage conferred
                             by satellite systems is supplying air quality information for regions devoid of
                             surface-based monitors [11].

                             2.3. Nitrogen Dioxide Measurement
                             In this study, changes in NO2 emissions before and during the COVID-19 pan-
                             demic year of 2020 were monitored by following Aura satellite data [12]. NASA
                             launched Aura satellite on July 15th 2004. It is equipped with an ozone monitor-
                             ing instrument (OMI) to monitor the changes in air quality for various regions
                             worldwide [13]. The OMI satellite instruments precisely detect air pollutants
                             such as NO2, ozone, sulfur dioxide, carbon monoxide and methane [14]. The
                             tools compute backscattered radiations from the sun in a broad spectral range
                             from ultraviolet (UV) to infrared wavelengths. Advanced retrieval algorithms
                             are thereafter applied to transform the measured radiation to pollutant concen-
                             trations, such as a tropospheric column density of NO2 [15].

                             2.4. Absorbing Aerosol Index
                             The absorbing aerosol index (AAI) data for 2019 and 2020 were obtained from
                             Tropospheric Emission Monitoring Internet Service [16] of the European Space
                             Agency (ESA).

                             2.5. Data Analysis
                             Data retrieved from satellite monitoring assessments during the COVID-19
                             pandemic lockdown were compared with both statutory and international air
                             quality compliance standards.

DOI: 10.4236/oalib.1107389                         4                                    Open Access Library Journal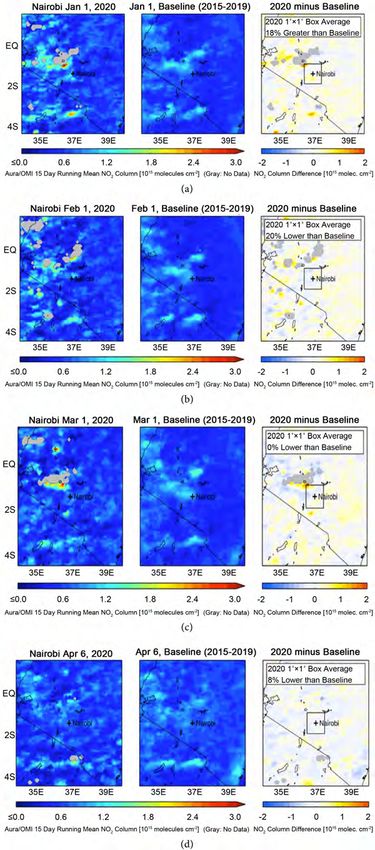
J. Angom et al.
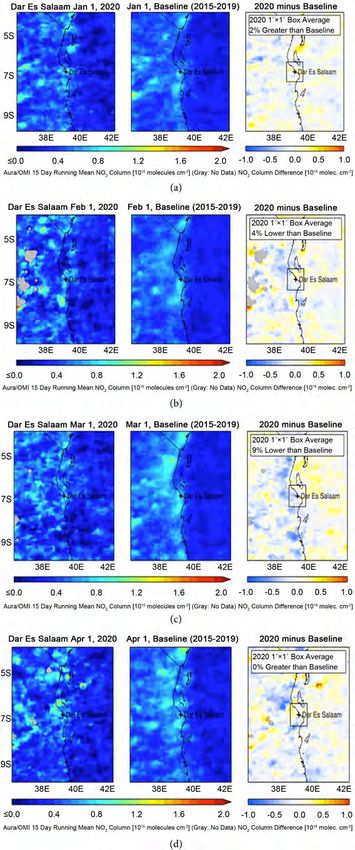
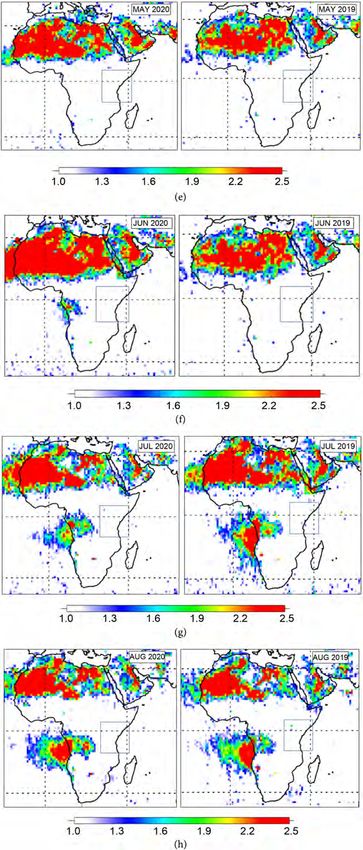
3. Results and Discussion
3.1. Changes in Nitrogen Dioxide Emissions
Data for NO2 emissions were retrieved from OMI for January 2020 to December
2020 and the baseline years (2015-2019). Data for the targeted months (March,
April and May) in 2020 represents the peak of the pandemic with total or partial
lockdowns in Uganda and Kenya, while Tanzania had no such containment
measure in the same period. Comparison of the data for each month in 2020
with those of the previous five years (2015 to 2019) aimed at logically identifying
whether the implemented containment measures during COVID-19 outbreak
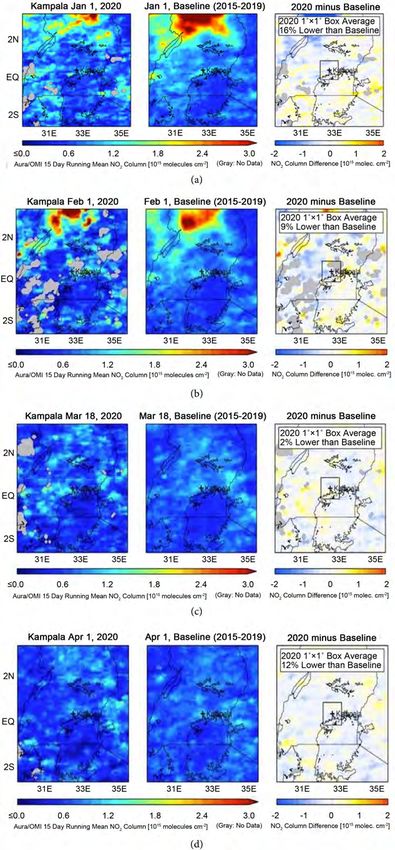
had an effect on NO2 emissions in Uganda and Kenya or not. In Figures 2-4, the
darker the color, the higher NO2 concentration/emission is [15] [17].
Data retrieved indicated that 2020 NO2 emissions in Kampala and Nairobi
were lower than the average levels in the respective cities during the same
months in 2015-2019. It is clearly observed that the orange colors in Figure 2
and Figure 3 are darker for 2020 than for 2015-2019, indicating there was a re-
duction in NO2 emissions in 2020 during the COVID-19 pandemic.
A percentage difference was calculated inside a 1˚ × 1˚ box over Kampala
(Figure 2). In January 2020, NO2 emissions in Kampala were 16% lower than the
baseline. This could be due to the reduced movements during the festive season.
In February 2020, NO2 emissions were only 9% lower than the baseline in Kam-
pala. This is because during February, most schools and tertiary institutions had
reopened, which translates into increased vehicular movements. By March 18th
2020 when total lockdown along with other containment strategies were adopted
in Uganda to reduce the spread of COVID-19 [18] [19] [20], NO2 emissions over
Kampala dropped by about 2% compared with the baseline period (Figure 2(c)).
From April 1st 2020 to May 1st 2020, NO2 emission over Kampala reduced by
12% and 3%, respectively. The lower percentage reduction in May 2020 could be
because the government eased some restrictions despite maintaining lockdown
in late April and early May [21] [22]. This also explains the lower percentage
reductions in NO2 emissions (10%, 3%, 17%, 0%, 6% and 8%) lower than the
baseline recorded between June and November 2020, as the government allowed
vehicular movements with restricted number of passengers (carrying half their
capacity), reduced curfew hours and removed total lockdown, and allowed re-
sumption of work and commercial activities to reduce risks of economic reces-
sion [23] [24]. In December 2020 (Figure 2(l)), NO2 emissions in Kampala was
8% greater than the baseline. This could be in addition to the foregoing reasons,
increased movements in preparation for the festive season (Christmas celebra-
tion on 25th December 2020 and New Year celebration on 1st January 2021) as
well as increased campaign activities in preparation for elections which occurred
from 14th January 2021 up to early February 2021.
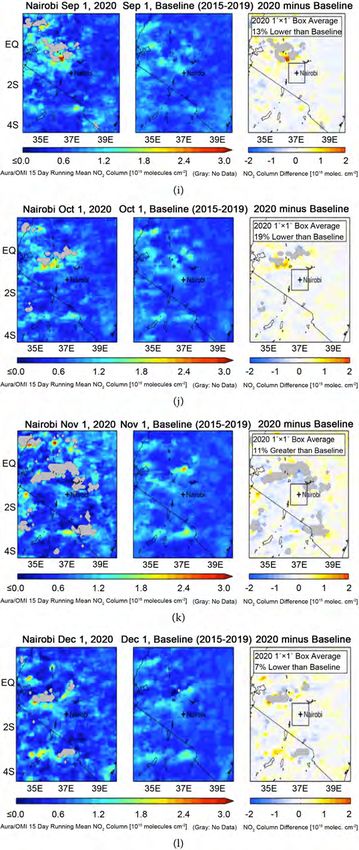
For Nairobi (Kenya), a percentage difference was calculated inside a 1˚ × 1˚
box over it. As depicted in Figure 3, NO2 emissions were 18% greater than the
baseline in January 2020 but this increased to 20% lower than the baseline in
DOI: 10.4236/oalib.1107389 5 Open Access Library Journal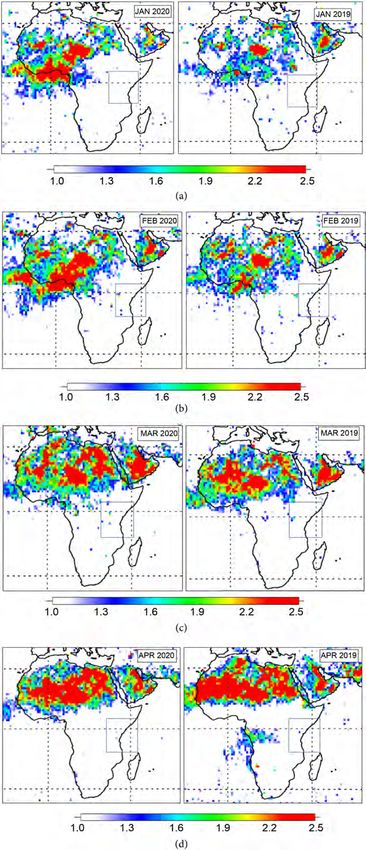
J. Angom et al.

DOI: 10.4236/oalib.1107389   6   Open Access Library Journal
J. Angom et al.

DOI: 10.4236/oalib.1107389   7   Open Access Library Journal
J. Angom et al.

                             Figure 2. Tropospheric NO2 emissions over Kampala, Uganda (32.58E, 0.35N) for 2020
                             and the baseline (2015-2019). Results are for 1˚ Latitude × 1˚ Longitude box around city
                             center.

DOI: 10.4236/oalib.1107389                          8                                    Open Access Library Journal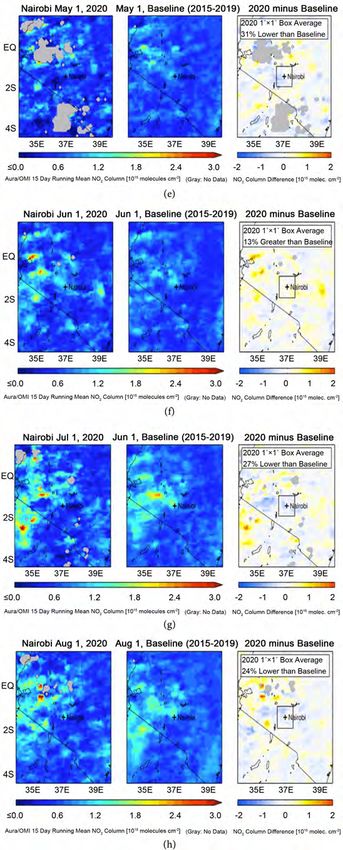
J. Angom et al.

DOI: 10.4236/oalib.1107389   9   Open Access Library Journal
J. Angom et al.

DOI: 10.4236/oalib.1107389   10   Open Access Library Journal
J. Angom et al.

                             Figure 3. Tropospheric NO2 emissions over Nairobi, Kenya (36.29E, 1.42S) for 2020 and
                             the baseline (2015-2019). Results are for 1˚ Latitude × 1˚ Longitude box around city cen-
                             ter.

DOI: 10.4236/oalib.1107389                          11                                    Open Access Library Journal
J. Angom et al. DOI: 10.4236/oalib.1107389 12 Open Access Library Journal
J. Angom et al.

DOI: 10.4236/oalib.1107389   13   Open Access Library Journal
J. Angom et al.

                             Figure 4. Tropospheric NO2 emissions over Dar es Salaam, Tanzania (39.25E, 6.80S) for
                             2020 and the baseline (2015-2019). Results are for 1˚ Latitude × 1˚ Longitude box around
                             city center.

DOI: 10.4236/oalib.1107389                         14                                    Open Access Library Journal
J. Angom et al.
February. This could be due to reduced industrial production post-festive season
of 2019. On March 1st 2020, there was no net increase in NO2 emissions when
compared to 2015-2019 baseline. On 6th April 2020 when a partial lockdown was
considered, NO2 emissions were 8% lower than the baseline. This could have
been due to decreased industrial production and vehicular movements. For May,
July, August, September, October, November and December, NO2 emissions in
Nairobi were 31%, 27%, 24%, 13%, 19%, 11% and 7% lower than the baseline.
On 1st June 2020, NO2 emissions were 13% greater than the baseline. The lower
reductions in percentage emissions of NO2 from May to December 2020 could
be due to the gradual easing of COVID-19 restrictions by the government, in-
cluding allowing resumption of work, industrial activities and public transport
i.e. vehicular movements [25]. Within Nairobi metropolitan area for example,
movement restrictions in the Eastleigh area were lifted [26]. The Novem-
ber-December lower percentage reductions in NO2 emissions could also be ex-
plained by increased industrial production and vehicular movements ahead of
the festive season (Christmas celebrations on 25th December 2020 and the new
year celebration of 1st January 2021).
Interestingly, the observed reductions in NO2 emissions in 2020 over Kampala
and Nairobi cities have not been the case with Tanzania where there was no
lockdown instituted. As seen in Figure 4(a), Dar es Salaam had 4% greater NO2
emissions than the baseline on January 1st 2020 which reduced to 4% lower than
the baseline in February 2020 (Figure 4(b)). In March when COVID-19 became
a reality in the EAC, NO2 emissions dropped by 9% lower than the baseline
(Figure 4(c)). This could be because the country initially tried to follow WHO
guidelines in containing the virus and reduced vehicular traffic in its coastal city
of Dar es Salaam [27] [28]. In April 2020, there was no net difference between
the NO2 emissions in the city as compared to the 2015-2019 baseline, but this in-
creased to 21% lower than the baseline in May 2020. When the president de-
clared the country “coronavirus-free” in June 2020 and allowed free movements
and operation of industries [29] [30], NO2 emissions increased by 15% and 4%
greater than the baseline for June and July 2020 (Figure 4(f) and Figure 4(g)).
After this, NO2 emissions were 4% lower than baseline in August 2020. There
was no net difference in NO2 emissions over Dar es Salaam in September 2020
but this decreased to 4% lower than the baseline in October 2020. November
2020 and December 2020 recorded 16% and 17% increase in NO2 emissions
when compared to the baseline. This indicates that the lockdown containment
measure could have had a reductive effect on NO2 emissions in Dar es Salaam.
Overall, there were about 6.0% and 8.91% reductions in NO2 emissions over
Kampala and Nairobi in 2020 while Dar es Salaam had about 1.16% increase in
NO2 emissions. These findings are in agreement with the percentage reduction
in the use of gasoline and diesel from March 2020 for Kampala and Nairobi.
Thus, the reductions in NO2 emissions could mainly be attributable to the re-
ductions in vehicular traffic and industrial activities during the pandemic year
DOI: 10.4236/oalib.1107389 15 Open Access Library JournalJ. Angom et al.
(2020). The NO2 emissions reported were comparable to those retrieved from the
Google community mobility reports based on anonymized datasets from users in
Kampala and Nairobi cities [31] [32]. High air pollution levels in Tanzanian city
of Dar es Salaam is not a new report; it had been reported by previous authors to
be caused by its heavy traffic, especially in the rush hours [33] [34] [35].
Reduction in NO2 levels during the novel COVID-19 pandemic have been
previously reported in other countries (cities) including China [17], Cairo and
Alexandria governorates of Egypt [15], United States of America [1], India [36]
[37], Kingdom of Saudi Arabia [38], Sao Paulo and Rio de Janeiro of Brazil [39]
[40], Croatia [41], Barcelona of Spain [42], Southern European cities of Nice,
Rome, Valencia and Turin [43] and Italian cities of Florence, Milan, Pisa and
Lucca [44] [45].
The concentration of NO2 in the atmosphere is primarily a function of the
magnitude of nitrogen oxide (NOx) emissions and weather factors such as sun
angle, wind speed and temperature, though meteorological variations between
years can cause column NO2 differences of ~15% over monthly timescales [46].
It is clear that the implemented COVID-19 lockdowns (March to May) reduced
NO2 emissions over Kampala and Nairobi, and thus improved air quality [47].
However, these improvements are temporary and unsustainable, with deteriora-
tion of air quality anticipated to upsurge as the countries resuscitate their
economies post-lockdown or in the post-pandemic period as earlier witnessed in
China [48]. It is imperative that stricter laws are enacted in the crucible of the
fight against the virus itself so as to protect the environment of the individual
countries, and the EAC at large.
3.2. Changes in Absorbing Aerosol Index
As depicted in Figure 5, the 2020 absorbing aerosol index (AAI) in Kampala and
Nairobi were lower than the AAI level during the same period in 2019 for Feb-
ruary 2020 to May 2020 by about 1.91%, which confirms the positive effect of
COVID-19 on air quality in Uganda and Kenya. In the other months, there were
insignificant changes in AAI in Kampala and Nairobi. For Dar es Salaam, there
were no appreciable increases in the AAI during the pandemic year. Recent re-
ports indicate that much of the particulate matter emissions are from the trans-
port sector (old private cars and taxis) from 6:00 am to 9:00 am in Kampala and
the rest of Uganda [49], Nairobi [50] and Dar es Salaam [51]. This explains why
lockdowns led to reduced AAI in the former than the latter. This is analogous to
the situation reported previously in Egypt [52] [53].
The stringent containment measures adopted by Uganda and Kenyan gov-
ernments led to less traffic flow and relatively fewer construction activities. Less
traffic flow usually leads to less particulate matter (PM) emissions from automo-
bile engines particularly from old taxis and public transportation buses, tyre and
brake wears and unmaintained roads [15] [50] [54]. Previous authors reported
similar attenuation in PM levels during the COVID-19 in countries (cities) of
DOI: 10.4236/oalib.1107389 16 Open Access Library JournalJ. Angom et al. DOI: 10.4236/oalib.1107389 17 Open Access Library Journal
J. Angom et al.

DOI: 10.4236/oalib.1107389   18   Open Access Library Journal
J. Angom et al.

                             Figure 5. OMI/AURA Africa’s Absorbing Aerosol Index for the year 2020 and baseline
                             (2019). East Africa is focused with the square box.

DOI: 10.4236/oalib.1107389                        19                                 Open Access Library Journal
J. Angom et al.
Egypt [15], Rio de Janeiro and Sao Paulo, Brazil [39] [40], China [17] [55], India
[37], Milan [45], Barcelona [42], Nice, Rome, Valencia and Turin [43]. The PM
emissions in Kampala, Nairobi and Dar es Salaam has increasingly surpassed
WHO regulatory guidelines in both PM10 and PM2.5 size ranges [20] [34] [35]
[47] [56]-[64]. Thus, there is need to tighten the air quality guidelines to main-
tain the air quality levels.
4. Conclusion
COVID-19 has been a crisis that has led to the undermining of environmental
priorities and the realization of some Sustainable Development Goals. It has
been visualized as a prelude to a looming future climate crisis, yet reports have
also indicated that lockdowns imposed as a COVID-19 containment measure
worldwide have led to improvement in air quality in various regions. The pauci-
ty of published reports or systematic and regulatory grade measurements of air
pollution in East African cities prompted the current study. The results indicated
that the imposed lockdowns in Kampala and Nairobi cities led to reductions in
NO2 emissions by 6.0% and 8.91%, while the AAI decreased by about 1.91% for
the year 2020. Dar es Salaam recorded a 1.16% increase in NO2 emissions though
the AAI remained almost constant in 2020. The interim pollution reduction
witnessed during the COVID-19 lockdown in Uganda and Kenya indicates that
the region needs stimulus packages that prioritize low-carbon approaches in the
post-pandemic era, with a shift to both clean and renewable energy. We recom-
mend the installation of continuous air pollution monitoring centers within the
region so as to provide data for evidentiary comparison of air pollution levels.
Acknowledgements
The authors are grateful to the World Bank and the Inter-University Council of
East Africa (IUCEA) for the scholarship awarded to Timothy Omara through
the Africa Center of Excellence II in Phytochemicals, Textiles and Renewable
Energy (ACE II PTRE) at Moi University (Kenya) which made this study possi-
ble. The analyses and visualizations presented in this study were from online da-
ta systems developed and maintained by NASA to which we are grateful. The
NASA team is highly acknowledged for compiling data on air pollutants during
the pandemic year of 2020.
Conflicts of Interest
The authors declare no conflicts of interest regarding the publication of this pa-
per.
References
[1] Muhammad, S., Long, X. and Salman, M. (2020) COVID-19 Pandemic and Envi-
ronmental Pollution: A Blessing in Disguise? Science of the Total Environment,
728, Article ID: 138820. https://doi.org/10.1016/j.scitotenv.2020.138820
DOI: 10.4236/oalib.1107389 20 Open Access Library JournalJ. Angom et al.
[2] Machhi, J., Herskovitz, J., Senan, A.M., Dutta, D., Oleynikov, M.D., et al. (2020) The
Natural History, Pathobiology, and Clinical Manifestations of SARS-CoV-2 Infec-
tions. Journal of Neuroimmune Pharmacology, 153, 359-386.
https://doi.org/10.1007/s11481-020-09944-5
[3] Guo, Y.R., Cao, Q.D., Hong, Z.S., Tan, Y.Y., Jin, H.J., et al. (2020) The Origin,
Transmission and Clinical Therapies on Coronavirus Disease 2019 (COVID-19)
Outbreak—An Update on the Status. Military Medical Research, 7, Article No. 11.
https://doi.org/10.1186/s40779-020-00240-0
[4] Hadisi, Z., Walsh, T., Dabiri, S.M.H., Seyfoori, A., Hamdi, D., Mirani, B., et al.
(2020) Management of Coronavirus Disease 2019 (COVID-19) Pandemic: From
Diagnosis to Treatment Strategies. Advanced Therapeutics, 4, Article ID: 2000173.
https://doi.org/10.1002/adtp.202000173
[5] World Health Organization (2020) WHO Director-General’s Opening Remarks at
the Mediabriefing on COVID-19. March 11, 2020.
[6] World Health Organization (2021) WHO Coronavirus Disease (COVID-19) Dash-
board.
https://covid19.who.int/?gclid=Cj0KCQiA2uH-BRCCARIsAEeef3mNi83o9BNiFZ-
2vfDgZgJPecO5Ga7CuZGN8RZ859LzUE5gEuaxqwMaAi_pEALw_wcB
[7] Angom, J. (2021) Post-COVID-19 Scenarios in the East African Community: Im-
plications for Sustainable Development. South Asian Journal of Social Studies and
Economics, 10, 45-61. https://doi.org/10.9734/sajsse/2021/v10i130255
[8] Clarke International University (2021) Daily East African Update on COVID-19.
https://ciu.ac.ug/news/daily-east-african-update-on-covid-19
[9] EAC (East African Community) (2020) EAC at A Glance. https://www.eac.int/
[10] Veefkind, P., Van Oss, R. F., Eskes, H., Borowiak, A., Dentner, F. and Wilson, J.
(2007) The Applicability of Remote Sensing in the Field of Air Pollution. Institute
for Environment and Sustainability, Ispra.
[11] Engel-Cox, J.A., Hoff, R.M. and Haymet, A.D.J. (2004) Recommendations on the
Use of Satellite Remote-Sensing Data for Urban Air Quality. Journal of Air and
Waste Management Association, 54, 1360-1371.
https://doi.org/10.1080/10473289.2004.10471005
[12] National Aeronautics and Space Administration (NASA) (2020) National Aeronau-
tics and Space Administration. AURA OMI Average Tropospheric NO2 Maps, Air-
borne Nitrogen Dioxide Emission. https://so2.gsfc.nasa.gov/no2/no2_index.html
[13] National Aeronautics and Space Administration (NASA) (2020) Ozone Monitoring
Instrument. https://aura.gsfc.nasa.gov/omi.html
[14] Somvanshi, S.S., Vashisht, A., Chandra, U. and Kaushik, G. (2019) Delhi Air Pollu-
tion Modeling Using Remote Sensing Technique. In: Hussain, C.M., Ed., Handbook
of Environmental Materials Management, Springer, Switzerland, 1-27.
https://doi.org/10.1007/978-3-319-58538-3_174-1
[15] Mostafa, M.K., Gamal, G. and Wafiq, A. (2021) The Impact of COVID 19 on Air
Pollution Levels and Other Environmental Indicators—A Case Study of Egypt.
Journal of Environmental Management, 277, Article ID: 111496.
https://doi.org/10.1016/j.jenvman.2020.111496
[16] TEMIS (2020) OMI/AURA Absorbing Aerosol Index.
http://www.temis.nl/airpollution/absaai/
[17] Wang, Q. and Su, M. (2020) A Preliminary Assessment of the Impact of COVID-19
on Environment—A Case Study of China. Science of the Total Environment, 728,
DOI: 10.4236/oalib.1107389 21 Open Access Library JournalJ. Angom et al.
138915. https://doi.org/10.1016/j.scitotenv.2020.138915
[18] Dentons (2020) Covid-19: Possible Approaches to Managing Employee-Employer
Relations.
https://www.dentons.com/en/insights/articles/2020/april/16/covid-19-possible-appr
oaches-to-managing-employee-employer-relations
[19] Anguyo, I. and Storer, L. (2020) In Times of COVID-19 Kampala Has Become
‘un-Ugandan’.
https://blogs.lse.ac.uk/africaatlse/2020/04/09/kampala-epidemic-un-ugandan-societ
y-in-times-covid-19/
[20] AirQo (2020) Kampala Air Quality Improves by up to 40% during the Covid-19
lockdown.
https://www.airqo.net/blog-post/14221308-kampala-air-quality-improves-by-up-to-
40-during-the-covid19-lockdown
[21] Calvin-Smith, G. (2020) Covid-19: Uganda Extends Lockdown for Two Weeks but
Slowly Eases Measures.
https://www.france24.com/en/africa/20200505-uganda-extends-lockdown-for-two-
weeks-but-slowly-eases-measures
[22] Garda World (2020) Uganda: Authorities Ease Certain Restrictions and Extend
Lockdown by 14 Days May 4 /Update 6.
https://www.garda.com/crisis24/news-alerts/339056/uganda-authorities-ease-certai
n-restrictions-and-extend-lockdown-by-14-days-may-4-update-6
[23] Mwangi, N. (2020) Uganda to Start Easing Virus Lockdown from June 2.
https://africa.cgtn.com/2020/05/19/uganda-to-start-easing-virus-lockdown-from-ju
ne-2/
[24] Uganda Media Center (2020) President Musevenis 8th Address on COVID 19 and
Lockdown Relaxation.
https://www.mediacentre.go.ug/media/president-musevenis-8th-address-covid-19-a
nd-lockdown-relaxation
[25] Xinhua (2020) Kenyans Ready for Partial Lifting of COVID-19 Restrictions.
http://www.xinhuanet.com/english/2020-06/05/c_139114874.htm
[26] Garda World (2020) Kenya: Authorities Announce Extension of Lockdown Meas-
ures until July 6 /Update 23.
https://www.garda.com/crisis24/news-alerts/348946/kenya-authorities-announce-ex
tension-of-lockdown-measures-until-july-6-update-23
[27] Mules, I. (2020) Tanzania under Fire from WHO for Lackluster Response to
COVID-19 Pandemic.
https://www.dw.com/en/tanzania-under-fire-from-who-for-lackluster-response-to-
covid-19-pandemic/a-53304699
[28] Vuzo, S. (2020) How COVID-19 Is Changing the Lives of Tanzanians.
https://www.un.org/africarenewal/web-features/coronavirus/how-covid-19-changin
g-lives-tanzanian
[29] Izugbara, C., Schaub, E., Bhatti, A., Marlow, H., Anderson, E. and Hinson, L. (2021)
COVID-19 and Indigenous Women in East Africa: Emerging Impacts, Responses
and Opportunities. International Center for Research on Women, Washington DC.
[30] Kell, F. (2020) Tanzania Evades COVID-19 Lockdown, but Restrictions Persist.
https://www.chathamhouse.org/2020/05/tanzania-evades-covid-19-lockdown-restri
ctions-persist
[31] Google (2021) COVID-19 Community Mobility Report—Uganda.
https://www.gstatic.com/covid19/mobility/2021-01-19_UG_Mobility_Report_en-G
DOI: 10.4236/oalib.1107389 22 Open Access Library JournalJ. Angom et al.
B.pdf
[32] Google (2021) COVID-19 Community Mobility Report—Kenya.
https://www.gstatic.com/covid19/mobility/2021-01-19_KE_Mobility_Report_en-G
B.pdf
[33] Mbuligwe, S.E. and Kassenga, G.R. (1997) Automobile Air Pollution in Dar es Sa-
laam City, Tanzania. Science of the Total Environment, 199, 227-235.
https://doi.org/10.1016/S0048-9697(97)05461-2
[34] International Association for Medical Assistance to Travellers (IAMAT)(2020)
Tanzania General Health Risks: Air Pollution. International Association for Medical
Assistance to Travellers, Toronto.
https://www.iamat.org/country/tanzania/risk/air-pollution#
[35] Jackson, M.M. (2005) Roadside Concentration of Gaseous and Particulate Matter
Pollutants and Risk Assessment in Dar-es-Salaam, Tanzania. Environmental Moni-
toring and Assessment, 104, 385-407. https://doi.org/10.1007/s10661-005-1680-y
[36] Gautam, S. (2020) Covid-19: Air Pollution Remains Low as People Stay at Home.
Air Quality, Atmosphere and Health, 13, 853-857.
https://doi.org/10.1007/s11869-020-00842-6
[37] Sharma, S., Zhang, M., Anshika, Gao, J., Zhang, H. and Kota, S.H. (2020) Effect of
Restricted Emissions during COVID-19 on Air Quality in India. Science of the To-
tal Environment, 728, Article ID: 138878.
https://doi.org/10.1016/j.scitotenv.2020.138878
[38] Anil, I. and Alagha, O. (2021) The Impact of COVID-19 Lockdown on the Air
Quality of Eastern Province, Saudi Arabia. Air Quality, Atmosphere and Health, 14,
117-128. https://doi.org/10.1007/s11869-020-00918-3
[39] Dantas, G., Siciliano, B., França, B.B., da Silva, C.M. and Arbilla, G. (2020) The Im-
pact of COVID-19 Partial Lockdown on the Air quality of the City of Rio de Janei-
ro, Brazil. Science of the Total Environment, 729, Article ID: 139085.
https://doi.org/10.1016/j.scitotenv.2020.139085
[40] Nakada, L.Y.K. and Urban, R. C. (2020) COVID-19 pandemic: Impacts on the Air
quality during the Partial Lockdown in São Paulo State, Brazil. Science of the Total
Environment, 729, Article ID: 139087.
https://doi.org/10.1016/j.scitotenv.2020.139087
[41] Jakovljević, I., Štrukil, Z.S., Godec, R., Davila, S. and Pehnec, G. (2020) Influence of
Lockdown Caused by the COVID-19 Pandemic on Air Pollution and Carcinogenic
Content of Particulate Matter Observed in Croatia. Air Quality, Atmosphere &
Health, 14, 467-472. https://doi.org/10.1007/s11869-020-00950-3
[42] Tobías, A., Carnerero, C., Reche, C., Massagué, J., Via, M., Minguill´on, M.C., et al.
(2020) Changes in Air Quality during the Lockdown in Barcelona (Spain) One
Month into the SARS-CoV-2 Epidemic. Science of the Total Environment, 726, Ar-
ticle ID: 138540. https://doi.org/10.1016/j.scitotenv.2020.138540
[43] Sicard, P., Marco, A.D., Agathokleous, E., Feng, Z., Xu, X., Paoletti, E., et al. (2020)
Amplified Ozone Pollution in Cities during the COVID-19 Lockdown. Science of
the Total Environment, 735, Article ID: 139542.
https://doi.org/10.1016/j.scitotenv.2020.139542
[44] Donzelli, G., Cioni, L., Cancellieri, M., Morales, A.L. and Suárez-Varela, M.M.M.
(2020) The Effect of the Covid-19 Lockdown on Air Quality in Three Italian Me-
dium-Sized Cities. Atmosphere, 11, Article No. 1118.
https://doi.org/10.3390/atmos11101118
[45] Collivignarelli, M.C., Abbà, A., Bertanza, G., Pedrazzani, R., Ricciardi, P. and Miino,
DOI: 10.4236/oalib.1107389 23 Open Access Library JournalJ. Angom et al.
M.C. (2020) Lockdown for CoViD-2019 in Milan: What Are the Effects on Air
Quality? Science of the Total Environment, 732, Article ID: 139280.
https://doi.org/10.1016/j.scitotenv.2020.139280
[46] Goldberg, D.L., Anenberg, S.C., Griffin, D., McLinden, C.A., Lu, Z. and Streets,
D.G. (2020) Disentangling the Impact of the COVID-19 Lockdowns on Urban NO2
from Natural Variability. Geophysics Research Letters, 47, Article ID: e2020GL089269.
https://doi.org/10.1002/essoar.10503396.1
[47] Singh, A., Pope, F. and Avis W.R. (2020) Visibility as a Proxy for Air Quality in East
Africa. Environmental Research Letters, 15, Article ID: 084002.
https://doi.org/10.1088/1748-9326/ab8b12
[48] Abnett, K. (2020) China Sees Post-lockdown Rise in Air Pollution: Study.
https://www.reuters.com/article/us-health-coronavirus-china-pollution/china-sees-
post-lockdown-rise-in-air-pollution-study-idUSKBN22U09F
[49] Okure, D., Bainomugisha, E., Lozano-Gracia, N. and Soppelsa, M.E. (2021) Charac-
terization of Ambient Air Quality in Selected Urban Areas in Uganda: A Low-Cost
Approach. Policy Research Working Paper No. 9512, World Bank, Washington DC.
https://doi.org/10.1596/1813-9450-9512
[50] Ngo, N. S., Gatari, M., Yan, B., Chillrud, S.N., Bouhamam, K. and Kinney, P.L.
(2015) Occupational Exposure to Roadway Emissions and Inside Informal Settle-
ments in Sub-Saharan Africa: A Pilot Study in Nairobi, Kenya. Atmospheric Envi-
ronment, 111, 179-184. https://doi.org/10.1016/j.atmosenv.2015.04.008
[51] Dasgupta, S., Lall, S. and Wheeler, D. (2020) Traffic, Air Pollution, and Distribu-
tional Impacts in Dar es Salaam: A Spatial Analysis with New Satellite Data. Policy
Research Working Paper No. 9185, World Bank, Washington DC.
https://doi.org/10.1596/1813-9450-9185
[52] Heger, M., Wheeler, D., Zens, G. and Meisner, C. (2019) Motor Vehicle Density and
Air Pollution in Greater Cairo: Fuel Subsidy Removal and Metro Line Extension &
Their Effect Congestion and Pollution? The World Bank, Washington DC.
https://doi.org/10.1596/32512
[53] Abbass, R.A., Kumar, P. and El-Gendy, A. (2020) Car User’s Exposure to Particulate
Matter and Gaseous Air Pollutants in Megacity Cairo. Sustainable Cities and Socie-
ty, 56, Article ID: 102090. https://doi.org/10.1016/j.scs.2020.102090
[54] Rajé, F., Tight, M. and Pope, F.D. (2018) Traffic Pollution: A Search for Solutions
for a City Like Nairobi. Cities, 82, 100-107.
https://doi.org/10.1016/j.cities.2018.05.008
[55] Wang, P., Chen, K., Zhu, S., Wang, P. and Zhang, H. (2020) Severe Air Pollution
Events Not Avoided by Reduced Anthropogenic Activities during COVID-19 Out-
break. Resources Conservation and Recycling, 158, Article ID: 104814.
https://doi.org/10.1016/j.resconrec.2020.104814
[56] Pope, F.D., Gatari, M., Ng’ang’a, D., Poynter, A. and Blake, R. (2018) Airborne Par-
ticulate Matter Monitoring in Kenya Using Calibrated Low-Cost Sensors. Atmos-
pheric Chemistry and Physics, 18, 15403-15418.
https://doi.org/10.5194/acp-18-15403-2018
[57] Schwander, S., Okello, C.D., Freers, J., Chow, J.C., Watson, J.G., Corry, M. and
Meng, Q. (2014) Ambient Particulate Matter Air Pollution in Mpererwe District,
Kampala, Uganda: A Pilot Study. Journal of Environmental and Public Health,
2014, Article ID: 763934. https://doi.org/10.1155/2014/763934
[58] Kirenga, B. J., Meng, Q., van Gemert, F., Aanyu-Tukamuhebwa, H., Chavannes, N.,
Katamba, A., et al. (2015) The State of Ambient Air Quality in Two Ugandan Cities:
DOI: 10.4236/oalib.1107389 24 Open Access Library JournalJ. Angom et al.
A Pilot Cross-Sectional Spatial Assessment. International Journal of Environmental
Research and Public Health, 12, 8075-8091.
https://doi.org/10.3390/ijerph120708075
[59] Egondi, T., Muindi, K., Kyobutungi, C., Gatari, M. and Rocklöv, J. (2016) Measur-
ing Exposure Levels of Inhalable Airborne Particles (PM2.5) in Two Socially De-
prived Areas of Nairobi, Kenya. Environmental Research, 148, 500-506.
https://doi.org/10.1016/j.envres.2016.03.018
[60] Gaita, S.M., Boman, J., Gatari, M.J., Pettersson, J.B.C. and Janhäll, S. (2014) Source
Apportionment and Seasonal Variation of PM2.5 in a Sub-Saharan African City:
Nairobi, Kenya. Atmospheric Chemistry and Physics, 14, 9977-9991.
https://doi.org/10.5194/acp-14-9977-2014
[61] Egondi, T., Ettarh, R., Kyobutungi, C., Ng, N. and Rocklöv, J. (2018) Exposure to
Outdoor Particles (PM2.5) and Associated Child Morbidity and Mortality in Socially
Deprived Neighborhoods of Nairobi, Kenya. Atmosphere, 9, Article No. 351.
https://doi.org/10.3390/atmos9090351
[62] West, S.E., Büker, P., Ashmore, M., Njoroge, G., Welden, N., Muhoza, C., et al.
(2020) Particulate Matter Pollution in an Informal Settlement in Nairobi: Using
Citizen Science to Make the Invisible Visible. Applied Geography, 114, Article ID:
102133. https://doi.org/10.1016/j.apgeog.2019.102133
[63] Muindi, K. (2017) Air Pollution in Nairobi Slums: Sources, Levels and Lay Percep-
tions. Doctoral Thesis, Umeå University, Faculty of Medicine, Department of Public
Health and Clinical Medicine, Epidemiology and Global Health, Nairobi, Kenya.
[64] Koleleni, Y.I.A. (2002) Environmental Air Degradation in Dar es Salaam by X-Ray
Fluorescence. Journal of Environmental Science and Health, Part A, 37, 385-398.
https://doi.org/10.1081/ESE-120002836
DOI: 10.4236/oalib.1107389 25 Open Access Library JournalYou can also read