Title: Assessment of Menstrual Health Status and Evolution through Mobile Apps for Fertility Awareness Authors and affiliations: Laura Symul1,2* ...
←
→
Page content transcription
If your browser does not render page correctly, please read the page content below
bioRxiv preprint first posted online Aug. 15, 2018; doi: http://dx.doi.org/10.1101/385054. The copyright holder for this preprint
     (which was not peer-reviewed) is the author/funder, who has granted bioRxiv a license to display the preprint in perpetuity.
                                    It is made available under a CC-BY-ND 4.0 International license.

Title:
Assessment of Menstrual Health Status and Evolution through Mobile Apps
for Fertility Awareness

Authors and affiliations:
Laura Symul1,2*, Katarzyna Wac1,3, Paula Hillard4, Marcel Salathé2

1
 Department of Surgery, Stanford School of Medicine, Stanford University, 300 Pasteur Dr.,
Stanford, California 94305-5317, USA.
2
 Digital Epidemiology Lab, Global Health Institute, School of Life Sciences, École Polytechnique
Fédérale de Lausanne (EPFL), Campus Biotech, Chemin des mines 9, CH-1202 Geneva, Switzerland.
3
 Quality of Life Technologies lab, Institute of Services Science, Center for Informatics, University of
Geneva, CUI Battelle bat A, Route de Drize 7, 1227 Carouge, Switzerland.
4
 Department of Obstetrics & Gynecology, Stanford School of Medicine, Stanford University, 300
Pasteur Dr. HH333, Stanford, California 94305-5317, USA.
*Correspondence to: lsymul@stanford.edu.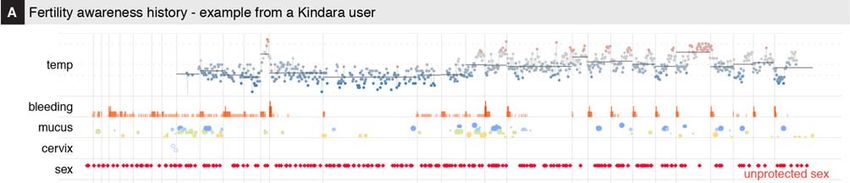
bioRxiv preprint first posted online Aug. 15, 2018; doi: http://dx.doi.org/10.1101/385054. The copyright holder for this preprint
  (which was not peer-reviewed) is the author/funder, who has granted bioRxiv a license to display the preprint in perpetuity.
                                 It is made available under a CC-BY-ND 4.0 International license.

Abstract
For most women of reproductive age, assessing menstrual health and fertility typically involves regular

visits to a gynecologist or another clinician. While these evaluations provide critical information on an

individual’s reproductive health status, they typically rely on memory-based self-reports, and the results

are rarely, if ever, assessed at the population level. In recent years, mobile apps for menstrual tracking

have become very popular, allowing us to evaluate the reliability and tracking frequency of millions of

self-observations, thereby providing an unparalleled view, both in detail and scale, on menstrual health

and its evolution for large populations. In particular, we were interested in exploring the tracking

behavior of the app users and their overall observation patterns in an effort to understand if they were

consistent with previous small-scale medical studies. We also investigated whether their precision

allowed the detection and estimation of ovulation timing, which is critical for reproductive and

menstrual health. Retrospective self-observation data were acquired from two mobile apps dedicated to

the application of the sympto-thermal fertility awareness method, resulting in a dataset of more than 30

million days of observations from over 2.7 million cycles. The analysis of the data showed that up to

40% of the cycles in which users were seeking pregnancy had recordings every single day. With a

modeling approach using Hidden Markov Models to describe the collected data and estimate ovulation

timing, it was found that follicular phases average duration and range were larger than previously

reported, with only 24% of ovulations occurring at days 14 to 15, while the luteal phase duration and

range were in line with previous reports, although short luteal phases (10 days or less) were more

frequently observed (in up to 20% of cycles). The digital epidemiology approach presented here can

help to lead to a better understanding of menstrual health and its connection to women’s health overall,

which has historically been severely understudied.

Keywords: menstrual cycle, fertility awareness, self-tracking, digital epidemiology, mobile phone apps

                                                                                                                                     2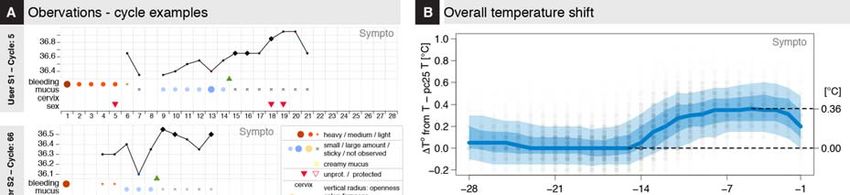
bioRxiv preprint first posted online Aug. 15, 2018; doi: http://dx.doi.org/10.1101/385054. The copyright holder for this preprint
  (which was not peer-reviewed) is the author/funder, who has granted bioRxiv a license to display the preprint in perpetuity.
                                 It is made available under a CC-BY-ND 4.0 International license.

Introduction
A broad diversity of fertility awareness methods (FAMs) has been developed in the past century1,2,

primarily designed to help couples manage fertility and family planning. Modern methods developed in

the last quarter of the 20th century take advantage of the precise description of menstrual variation of the

basal body temperature (BBT) or waking temperature, taken with a thermometer with a 0.01C or 0.5F

precision, cervical mucus quality and quantity, vaginal sensation, and cervical position3–6. These

methods have defined a set of rules that allows the identification of the fertile window around ovulation,

so that couples can adapt their sexual behavior according to their reproductive objectives7–9. The

sympto-thermal method, which combines BBT and cervical mucus observations, is arguably amongst

the most reliable FAM for family planning1,2,4,10. Recently, a number of mobile apps have been

developed by private organizations to facilitate FAM tracking. Some of these apps provide their users

with automatized interpretation with regard to the opening and closing of the fertility window11. Over

the past few years, an increasing number of women, estimated at over 200 million in 201612, have

started using these apps, contributing to the accumulation of menstrual-related data (Fig 1) from a

diverse population of users at different stage of life (Fig. 2A, Table 1, Methods).

A few studies have evaluated some of these apps in terms of user experience or the accuracy of the

scientific information provided to their users13,14 or regarding their ability to accurately indicate the

opening and closing of the fertile window11,15. Other studies16–18 have evaluated the contraceptive

efficacy of the app Natural Cycles; this app based on a proprietary algorithm only takes body

temperature into account16–18 and these studies were authored by one of the app founders and did not

provide a description of the tracked data. In the last two years, only a few studies have used datasets

from women’s health applications, such as Clue, to describe the association between pre-menstrual

symptoms and sexually transmitted infections19 or to develop machine learning methods suited to study

rhythmic human behavior20 or predict pregnancy21.

                                                                                                                                     3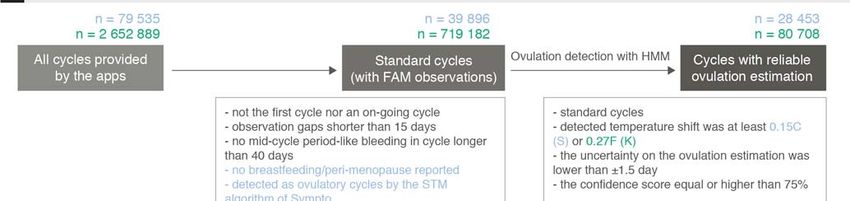
bioRxiv preprint first posted online Aug. 15, 2018; doi: http://dx.doi.org/10.1101/385054. The copyright holder for this preprint
  (which was not peer-reviewed) is the author/funder, who has granted bioRxiv a license to display the preprint in perpetuity.
                                 It is made available under a CC-BY-ND 4.0 International license.

However, fertility awareness body signs, as tracked easily via affordable mobile applications, have not

yet been extensively described or studied and it is unclear how app users are reporting these signs, as

well as whether the reported observations are consistent with the conclusions of previous smaller-scale

medical studies6,22,23. Moreover, there are no statistical framework to detect ovulation from these self-

tracked data, which would be useful to leverage the potential of these data to study fertility, accurately

predict pregnancy chances and to overall evaluate the potential impact of fluctuating hormones on the

course of chronic diseases24.

         Here, we were interested in evaluating the potential of the data collected via apps for the

assessment of menstrual health, both at the individual level and at the population level, and, in the long

run to help enable better clinical-decision-making processes. Two retrospective datasets that were

described by the app providers as representative of their active users population (Methods), were

acquired from the apps Kindara (K) and Sympto (S)11 (Fig. S1A,B, Table 1). Both apps offer free and

paid versions of their app, but all data used in this study can be tracked on their free version. Privacy

policies of the two apps explicitly state that users’ data might be transferred to academic institutions for

research purposes with the motivation to support studies that could potentially accelerate future

development of fertility awareness methods. Both apps offer similar FAM tracking options but differ in

their design and user experience (Fig. S1AB, Table 2). Kindara is primarily marketed to women who

wish to achieve pregnancy and does not provide feedback to users in terms of the opening or closing of

their fertile window. Sympto is marketed as a family planning tool that can be utilized to plan or avoid a

pregnancy. The Sympto app provides feedback to their users based on their observations, indicating

when they are potentially fertile, very fertile or infertile. The key differences between these two apps are

(i) the automatic- (S) vs user- (K) interpretation of observations, (ii) the per-cycle (S) vs per-user (K)

definition of fertility goals users wish to achieve, (iii) the criteria for the onset of a new cycle, i.e. fresh

                                                                                                                                     4
bioRxiv preprint first posted online Aug. 15, 2018; doi: http://dx.doi.org/10.1101/385054. The copyright holder for this preprint
  (which was not peer-reviewed) is the author/funder, who has granted bioRxiv a license to display the preprint in perpetuity.
                                 It is made available under a CC-BY-ND 4.0 International license.

bleeding after ovulation (S) vs self-assessed or automatic (K), and (iv) the precision at which users can

report their observations (Suppl. Mat.).

Results

         Users demographics: the typical FAM app user is 30, has a healthy BMI, and lives in a

         European or North American country

The two apps target different populations. Most Kindara users are based in the US and are trying to

achieve pregnancy, while Sympto users mainly reside in Europe and use the app primarily to avoid

pregnancy. Users of these two apps are found in over 150 countries, covering 5 continents, but the vast

majority of them are located in Europe and in the Americas. User ages span the reproductive life of

women, from the onset of their sexual activity to menopause, with an overrepresentation of users in their

late 20s and early 30s (Fig. 2A, left, Table 3). For some users, additional information is available,

including their birth year, and, for Sympto users only, their reported weight, height and age at menarche

(Fig 2A, Table 3).

The height and weight distribution of Sympto users (Fig. 2A, top and bottom right, data not available for

Kindara users, Table 3) shows median values of 60 kg and 165 cm. Both distributions present peaks at

round values such as 160 or 165 cm indicating that users often report approximate values (for example,

160 cm rather than 159 or 161 cm). This has often been observed in previous studies using self-reported

values and these mild inaccuracies of self-reported values have usually been found to only slightly affect

the overall distributions 25. The median BMI of Sympto users is around 20, which is considered healthy

for women (Fig S1C, Table 3). Information such as users’ level of education, marital or social status,

parity or particular health conditions are unknown.

                                                                                                                                     5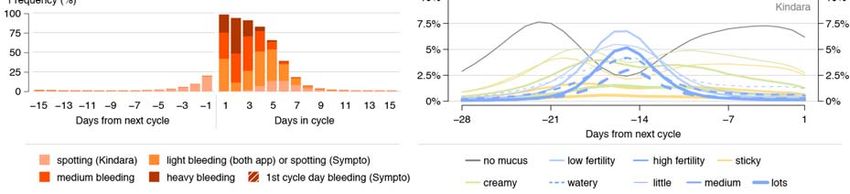
bioRxiv preprint first posted online Aug. 15, 2018; doi: http://dx.doi.org/10.1101/385054. The copyright holder for this preprint
  (which was not peer-reviewed) is the author/funder, who has granted bioRxiv a license to display the preprint in perpetuity.
                                 It is made available under a CC-BY-ND 4.0 International license.

         Regular users log their observations at a high frequency.

         The tracking behavior of regular FAM users during their usual cycles, which here are referred to

as “standard cycles” (Fig 2B, Methods) is highly variable and depends on the family planning objectives

of the users (Fig 2C). For an idealized ~28-day cycle, FAM-relevant body signs need to be recorded for

at least 8-12 days of each cycle to detect the changes related to ovulation, i.e. at a tracking frequency of

at least ~ 43%. However, most users using the apps for their FAM tracking report their observations for

over 16 days per cycle. In cycles where users choose to record sexual intercourse (65% (S) – 75% (K) of

standard cycles), tracking frequency is increased, with over 40% of cycles being tracked every single

day when seeking pregnancy (Fig. 2C, S1D), sometimes for several months or years in a row (Fig. 1).

         Tracking frequencies varied between the two apps (Fig 2C), partly in relationship to the design

of the apps; Kindara doesn’t provide user interpretation of the fertility window allowing for sporadic

tracking, whereas missing data in Sympto precludes an accurate fertility assessment, potentially leading

the user to discontinue use of the app if they are unable or unwilling to track consistently.

         Reported fertility awareness body signs show clear patterns at the user population level

         Confident that users regularly logged observations (Fig. 2C) during standard cycles, we sought

to characterize general patterns in the observations and frequency of the different FAM body signs and

investigate whether they were consistent with previous studies5,6,9,26,27. As cycle durations vary by

several days, as illustrated in Fig. 3A, and given that the duration of the luteal phase (after ovulation) has

been shown to vary less than the follicular phase (before ovulation)28,29, ovulation-related observations

(BBT, mucus, cervix, vaginal sensation) are shown from the end of each cycle (Fig. 3B-D, S2). A clear

shift of about 0.36°C/0.7°F in BBT between the mid-follicular phase and the mid-luteal phase is

observed (Fig 3B, S2A), consistent with previous observations on a cohort of much smaller size26. BBT

showed a decrease at the end of the cycle, as light bleeding or spotting was reported (Fig. 3BC).

                                                                                                                                     6
bioRxiv preprint first posted online Aug. 15, 2018; doi: http://dx.doi.org/10.1101/385054. The copyright holder for this preprint
  (which was not peer-reviewed) is the author/funder, who has granted bioRxiv a license to display the preprint in perpetuity.
                                 It is made available under a CC-BY-ND 4.0 International license.

         In an ovulatory cycle, it is well established that cervical mucus is produced in higher quantity

and with a higher stretchiness in the days leading up to ovulation5,6,9,27, which seems to be observed by

users tracking their cervical mucus (85-90% (S) and 40-45% (K) of cycles) (Fig. 3D).

         Estimation of ovulation day reveals the diversity of menstrual timing

         Previous studies have shown that the combination of BBT and cervical mucus variations were

reliable, although not perfect, proxies for the detection of ovulation8,23,27,30. We therefore decided to

define a mathematical framework (HMM) to derive an estimate of the most likely day of ovulation with

reliability indicators to reflect the uncertainty of conflicting or unexpected observation patterns (Fig. 4A,

S3,4,6, Methods). Missing temperature records have been found to alter the precision of the ovulation

estimation to a slightly greater extent than missing cervical mucus reports (Fig S6D, Suppl. Mat.).

         These estimations allowed the comparison, for cycles with reliable ovulation estimation (109,161

cycles, Methods), of the cycle length distribution to those of estimated day of ovulation and of the

duration of the luteal phase (i.e. post-ovulation) (Fig. 4B). Cycle length distribution is asymmetrical

around the typical 27 to 28 days, with a heavy tail on longer cycles. Similarly, the distribution of the

follicular (i.e. prior to ovulation) phase duration (or ovulation time) is asymmetrical as well, with a

median value of 16 days, and 90% of ovulations occurring between day 10 and day 24. Only ~24% of

ovulations occurred on days 14 to 15 of the cycle.

         Luteal phase duration distribution, which is also asymmetrical, presents however a skew for

smaller values and a smaller standard deviation (Fig. 4BC, S4BC). Median values were 12 (K) and 13

(S) days, which is in line with a previous study that used fertility monitors31 but shorter than values

reported in studies that used luteinizing hormone (LH) peak for timing of ovulation29,32. About 35% of

cycles have a luteal phase duration of 12 to 13 days, while ~20% of cycles had a luteal phase duration

smaller than or equal to 10 days, which represents a higher proportion than reported in a previous

                                                                                                                                     7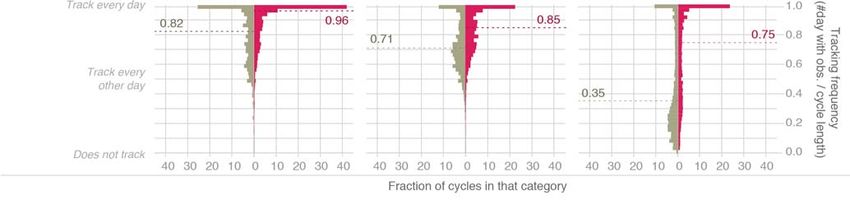
bioRxiv preprint first posted online Aug. 15, 2018; doi: http://dx.doi.org/10.1101/385054. The copyright holder for this preprint
  (which was not peer-reviewed) is the author/funder, who has granted bioRxiv a license to display the preprint in perpetuity.
                                 It is made available under a CC-BY-ND 4.0 International license.

epidemiological study29.

         Overall, the comparison with previous studies of the cycle phases duration and range shows that

the follicular phase and the whole cycle length have higher mean values and larger ranges than what was

previously observed, while the luteal phase duration and range was closer to those found in previous

studies28,29,31,33,34 (Fig. S5). The larger observed mean and range of the follicular phase and the cycle

length can partially be explained by the differences in inclusion/exclusion criteria – for example, some

previous studies excluded long cycles (Table S9) – and by the ovulation estimation methods, but also

probably by the fact that this study uses cycles from a much larger population and is thus able to capture

a higher diversity of menstrual patterns.

         Interestingly, the cycle phases distributions were slightly different when considering the data

from the two apps. These differences might be due to biases found in the user population, especially for

users seeking pregnancy that could be at higher risk of sub-fertility if assumed that they start tracking

after they have already tried to get pregnant for several months (Fig S4C); however, these data on user

behaviors around fertility seeking are not available for Kindara users.

                                                                                                                                     8
bioRxiv preprint first posted online Aug. 15, 2018; doi: http://dx.doi.org/10.1101/385054. The copyright holder for this preprint
  (which was not peer-reviewed) is the author/funder, who has granted bioRxiv a license to display the preprint in perpetuity.
                                 It is made available under a CC-BY-ND 4.0 International license.

Discussion

         This study’s goal was to describe and explore the suitability of datasets collected through two

mobile applications (Kindara and Sympto) supporting Fertility Awareness Method (FAM) tracking for

the assessment of menstrual health in general, both at the individual level and at the population level.

We found that the average tracking frequency of users that utilize the apps FAM tracking, vs basic

period tracking, is higher than the minimum required to detect changes associated with ovulation. In

particular, if users rely on the app for their family planning, i.e. if they log sexual intercourses (protected

or unprotected), the tracking frequency is increased, with up to 40% of cycles having recordings every

single day when the user’s objective is to achieve pregnancy. The reported observations (BBT, cervical

mucus changes, etc.) are overall aligned with expected patterns of FAM-related body signs, showing

these apps enable hundreds of thousands of users across Europe and North America to follow their

fertility and ovulation patterns. However individual cycles often present noisier profiles and missing

data are a frequent concern. To partly alleviate these issues, the mathematical framework (HMM) used

in this study discretizes the menstrual cycle in independent successive biologically-relevant states and

allows the estimation of ovulation timing along with uncertainty indicators. A large variation in the

ovulation time and in the luteal phase duration was found, with larger ranges than previously described

in other studies29,31,33,36 that relied on much smaller populations but that used biomarkers which might

offer a greater precision for the estimation of ovulation time.

         The strength of this study lies in the scale and precision of the datasets, as a variety of fertility

patterns are captured, and as users track the evolution of their cycles at a high frequency over long

intervals of time. It also provides a non-proprietary and replicable mathematical method to infer

biological states, and in particular to estimate the timing of ovulation, from fertility awareness self-

tracked data. The most obvious potential limitation of this study comes from the origin of these

                                                                                                                                     9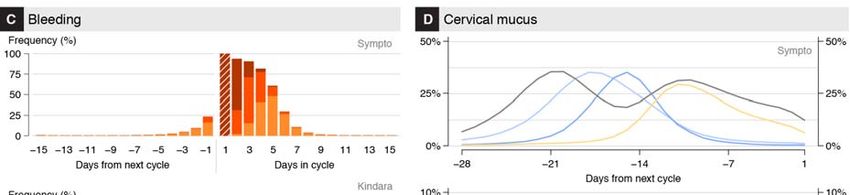
bioRxiv preprint first posted online Aug. 15, 2018; doi: http://dx.doi.org/10.1101/385054. The copyright holder for this preprint
  (which was not peer-reviewed) is the author/funder, who has granted bioRxiv a license to display the preprint in perpetuity.
                                 It is made available under a CC-BY-ND 4.0 International license.

retrospective data: a self-selected possibly biased population, limited medical and general information

on users, irregular observation patterns and little control on assessing the validity of the observations, in

particular with regard to cervical mucus tracking. While the tracking frequency limitation can be

alleviated through strict selection of users and cycles (Methods), all other limiting factors might have

introduced biases in the present analysis. Prospective studies on selected cohorts with appropriate

follow-up and information provided to users will provide higher quality data, which could then be used

for comparison.

          Based on the current findings, it appears that self-tracking of FAM-related body signs provides

an affordable means to evaluate the status and evolution of menstrual health, given that these

observations require only a precise thermometer, and that providers of these and of other apps offer free

simplified versions. These long term and yet very precise recordings support the idea that the menstrual

cycle, like other biological rhythms, is a vital sign whose variations inform about overall health

status37,38. The digital epidemiology approach39, where patients collect data themselves through digital

means, can in this context represent a powerful method to investigate menstrual health and its

connection to women’s health at the population level34 in a field that has historically been severely

understudied40.

         We foresee that future studies will use self-tracked data to quantify infertility or daily pregnancy

chances based on reported FAM body signs and user’s history. Models could also be established to

investigate potential sub-fertility causes (anovulation, recurrent early pregnancy losses, etc.) based on

the fertility signs and user’s sexual behavior. More generally, such data and tracking apps, combined

with tracking of other coexisting symptoms, enable the exploration of the menstrual dimension of the

course of chronic diseases24,41. Such studies would highly benefit from additional, sometimes already

existing, tracking options in the apps such as pregnancy validation (for example reports of pregnancy

                                                                                                                                     10
bioRxiv preprint first posted online Aug. 15, 2018; doi: http://dx.doi.org/10.1101/385054. The copyright holder for this preprint
(which was not peer-reviewed) is the author/funder, who has granted bioRxiv a license to display the preprint in perpetuity.
It is made available under a CC-BY-ND 4.0 International license.
tests results) or a prompt to the user to label a tracking pause such that it can reliably be differentiated
from a pregnancy.
It is likely that users of such applications already have an increased awareness of their cycles,
and this study suggests that these digitally self-tracked observations potentially present an opportunity to
facilitate the dialog between patients and their clinicians, helping them to make informed decisions
based on quantified indicators. The current and future development of evidence-based digital tools for
menstrual health monitoring could positively impact women’s health.
11bioRxiv preprint first posted online Aug. 15, 2018; doi: http://dx.doi.org/10.1101/385054. The copyright holder for this preprint
(which was not peer-reviewed) is the author/funder, who has granted bioRxiv a license to display the preprint in perpetuity.
It is made available under a CC-BY-ND 4.0 International license.
Methods
Extended Materials and Methods can be found in the Supplementary Materials.
To briefly summarize the methodology used in this study: datasets were first filtered to keep cycles of
users using the apps for fertility awareness purposes, i.e. identify their fertility window. Data were then
summarized to describe the overall observation patterns. Finally, a Hidden Markov Model (HMM) was
defined and used to detect ovulation time and assess the reliability of this estimation.
Mobile phone applications and data acquisition
Two de-identified retrospective datasets were acquired from the Symptotherm foundation
(www.sympto.org; Switzerland) and Kindara (www.kindara.com; US) upon receiving ethical approval
from the Canton Geneva ethical commission (CCER Genève, Switzerland), study number 2017-02108.
These two apps were selected as they both ranked high in a study comparing the performances of apps
marketed to avoid pregnancy using FAMs11, as their privacy policies specified the use of their de-
identified datasets for research purposes and as their user pools were very large or diverse
geographically and culturally. Sympto has been released in 2008 and is available worldwide in 8
languages (English, French, German, Italian, Spanish, Polish, Russian and Bulgarian). Kindara has been
released in 2012 and is available worldwide in English. Both apps de-identified their datasets before
transferring them to the authors. Both apps are available on iOS and Android platforms and are available
as free or paid apps. All features used in this study are available in the free versions of the apps. Kindara
provided a random subset of their overall pool of users with at least 4 logged cycles (199 293 users, 2
652 889 cycles) while Sympto provided observations from their long-term users (at least 4 cycles
tracked with the app) and from users who provided their weight, height and menarche age (13 674 users,
79 535 cycles). A description of the datasets fields is provided in Table 2.
12bioRxiv preprint first posted online Aug. 15, 2018; doi: http://dx.doi.org/10.1101/385054. The copyright holder for this preprint
(which was not peer-reviewed) is the author/funder, who has granted bioRxiv a license to display the preprint in perpetuity.
It is made available under a CC-BY-ND 4.0 International license.
Selection criteria for users and cycles
Given that these are self-tracked data, missing data is a frequent issue, and many cycles within the
datasets provided by the app were not suitable for the analyses of this study. First cycles were filtered to
remove any unfinished or uncomplete cycles or cycles in which fertility awareness body signs were not
observed. Kept cycles are labelled as “standard cycles” (see flowchart, Fig 2B). Then, the HMM was
used to estimate ovulation and, for the rest of the analysis, only cycles in which ovulation could reliably
be estimated were kept (Fig 2B). Below are the inclusion/exclusion criteria for these cycle categories.
Standard cycles (Sympto: 39,896 cycles; Kindara: 719,182 cycles) denote cycles of regular users of the
apps in which FAM body signs have been logged. Typically, cycles with long tracking gaps or in which
only the period flow was logged were excluded.
- (S&K) not the first cycle of a user nor an on-going cycle
- (S&K) observation gaps were no longer than 15 days within a given cycle
- (S&K) at least one FAM body sign (BBT or cervical mucus or cervix position) was recorded
- (S&K) no mid-cycle period-like bleeding was detected when the cycle was longer than 40 days
- (S) defined as ovulatory cycles by the STM algorithm of Sympto, i.e. in which the fertile window
could be closed.
- (K) at least 8 FAM observations were reported
- (S) no breastfeeding was reported or peri-menopause was declared
- (K) cycle length was at least 4 days longer than the total number of days in which bleeding was
reported
Cycles with reliable ovulation estimation (Sympto: 28,453 cycles; Kindara: 80,708)
Criteria summary:
- standard cycles
13bioRxiv preprint first posted online Aug. 15, 2018; doi: http://dx.doi.org/10.1101/385054. The copyright holder for this preprint
(which was not peer-reviewed) is the author/funder, who has granted bioRxiv a license to display the preprint in perpetuity.
It is made available under a CC-BY-ND 4.0 International license.
- detected temperature shift was at least 0.15C (S) or 0.27F (K) (Suppl. Mat.).
- the uncertainty on the ovulation estimation was lower than ±1.5 day (Suppl. Mat.).
- the confidence score, which is related to acceptable amount of missing data in the ovulatory period,
was equal or higher than 75% (Suppl. Mat.).
Observations decoding and ovulation timing estimation with HMM
The FAM body-signs are considered to reflect the hormonal changes orchestrating the menstrual cycles.
The study was focused on understanding the extent to which these tracked cycles were consistent with
previously described menstrual cycle physiologic changes, and the extent to which it was thus possible
for app users to estimate timing of ovulation. Hidden Markov Models (HMM) are one of the most
suitable mathematical frameworks to estimate ovulation timing, due to their ability to uncover, from
observations, latent phenomenon, which in this use include the cascade of hormonal events across the
menstrual cycle. HMM have also been previously used for analysis of menstrual periodicity20. A 10-
states HMM, in which each state is a particular phase of the menstrual cycle (Fig. 4A top, S3A, Suppl.
Mat.), was defined, and with decoding algorithms (Viterbi – Backward-Forward) was used to estimate
the ovulation time, the uncertainty on this estimation, and a confidence score that accounts for missing
observation and variation in temperature taking times.
A set of stringent criteria were established, and included: the uncertainty of the ovulation estimation (≤
±1.5 days); the magnitude of the temperature shift (≥ 0.15 C); and the confidence score of the
observations (≥ 0.75) to discriminate between cycles for which the estimations could be trusted (cycles
with reliable ovulation estimation) and those where the observations did not allow for a reliable
estimation of the ovulation day (Fig S4A, Suppl. Mat.). These strict criteria lead to the exclusion of
~40% (Sympto) and ~ 89% (Kindara) of the standard cycles that were initially selected. In total, 28,453
14bioRxiv preprint first posted online Aug. 15, 2018; doi: http://dx.doi.org/10.1101/385054. The copyright holder for this preprint
(which was not peer-reviewed) is the author/funder, who has granted bioRxiv a license to display the preprint in perpetuity.
It is made available under a CC-BY-ND 4.0 International license.
(Sympto) + 80,708 (Kindara) cycles with reliable ovulation estimation have been used for the
subsequent analyses (Suppl. Mat.).
Model description
The Hidden Markov Model (HMM) as implemented in this study describes a discretization in 10 states
of the successive hormonal events throughout an ovulatory menstrual cycle. The HMM definition
includes the probabilities of observing the different FAM reported body signs in each state (emission
probabilities) and the probabilities of switching from one state to another (transition probabilities).
Emission probabilities were chosen to reflect observations previously made in studies that tested for
ovulation with LH tests or ultrasounds6,8,27, while transition probabilities were chosen in a quasi-uniform
manner (Suppl. Mat.). The ovulation estimations were robust to changes in transition probabilities but
not to variations in emission probabilities (Fig S6, SI), indicating that this simple framework is suitable
to detect ovulations in cycles of any length, and potentially including pregnancies, relying primarily on
users’ observations.
Once the model was defined, the Viterbi and the Backward-Forward algorithms42 were used to calculate
the most probable state sequence for each cycle (Suppl. Mat.) and thus to estimate ovulation timing, i.e.
the most likely day of the cycle in which the HMM is in the state “ovulation”. An uncertainty of the
estimation has also been computed as the standard deviation of the distribution of probabilities for the
state ‘ovulation’, which can be interpreted as the confidence interval in days for the time of ovulation
estimation (Suppl. Mat.). Finally, a confidence score was defined to account for missing observations
and variation in temperature taking time in a window of ~5 days around the estimated ovulation day
(Suppl. Mat.).
15bioRxiv preprint first posted online Aug. 15, 2018; doi: http://dx.doi.org/10.1101/385054. The copyright holder for this preprint
(which was not peer-reviewed) is the author/funder, who has granted bioRxiv a license to display the preprint in perpetuity.
It is made available under a CC-BY-ND 4.0 International license.
HMM states
The 10 states, defined as a discretization of the hormonal evolution across the cycle (further details in
Suppl. Mat.), are:
HM: onset of the menses and the heavy/medium flow of fresh blood;
LM: days of light bleeding or spotting that conclude menstruations;
LE: Low Estrogen;
HE: High Estrogen;
Ovu: Ovulation ;
Rise: Temperature rise associated with rise in progesterone production;
HP: High Progesterone;
EP: Estrogen Peak in luteal phase;
LP: Low Progesterone;
End: Artificial state for the end of each cycle.
16bioRxiv preprint first posted online Aug. 15, 2018; doi: http://dx.doi.org/10.1101/385054. The copyright holder for this preprint
(which was not peer-reviewed) is the author/funder, who has granted bioRxiv a license to display the preprint in perpetuity.
It is made available under a CC-BY-ND 4.0 International license.
Acknowledgments:
The authors are deeply grateful to all Kindara and Sympto users whose data have been used for this
study and to the Symptotherm foundation and Kindara company. In particular, we thank Dr. H.
Wettstein, C. Bourgeois, V. Salonna, T. Newcomer, T. Baras, C. Allémann, P. Ducoeurjoly and F.
Goddyn for sharing their experience, references and for fruitful discussions. We thank S. Holmes, C.
Droin and G. Lazzari for discussion on the mathematical modeling.
Competing interests:
L.S., K.W. and M.S. have no competing interest. P.H. discloses that she is a consultant and medical
advisor to Clue by Biowink.
Author contributions:
L.S. initiated and conceived the study, analyzed the data and designed the figures, L.S., K.W., P.H. and
M.S. wrote the manuscript. All authors discussed the results and implications and commented on the
manuscript at all stages.
Funding:
L.S. is supported by a Postdoc Mobility grant (P2ELP3_178315) from the Swiss National Science
Foundation (www.snf.ch).
Data and code availability:
While the privacy policies and terms of usage of the two apps allow the sharing of their de-identified
users’ data with third parties for research purposes, they do not allow public sharing of the raw datasets.
Aggregated values necessary for the production of the figures as well as the code of the analyses are
available at https://lasy.github.io/FAM-Public-Repo/.
17bioRxiv preprint first posted online Aug. 15, 2018; doi: http://dx.doi.org/10.1101/385054. The copyright holder for this preprint
(which was not peer-reviewed) is the author/funder, who has granted bioRxiv a license to display the preprint in perpetuity.
It is made available under a CC-BY-ND 4.0 International license.
References:
1. Lamprecht, V. & Trussell, J. Natural family planning effectiveness: Evaluating published reports.
Adv. Contracept. 13, 155–165 (1997).
2. Peragallo Urrutia, R. et al. Effectiveness of Fertility Awareness–Based Methods for Pregnancy
Prevention. Obstet. Gynecol. 00, 1 (2018).
3. Marshall, J. Cervical Mucus and Basal Body Temperature Method of Regulating Births. Field
Trial. Lancet 308, 282–283 (1976).
4. Moghissi, K. S. Prediction and detection of ovulation. 224–33 (1982).
5. Moghissi, K. S. Cyclic changes of cervical mucus in normal and progestin-treated women. Fertil.
Steril. 17, 663–675 (1966).
6. Billings, E. L., Brown, J. B., Billings, J. J. & Burger, H. G. Symptoms and Hormonal Changes
Accompanying Ovulation. Lancet 299, 282–284 (1972).
7. Wilcox, A. J. The timing of the ‘fertile window’ in the menstrual cycle: day specific estimates
from a prospective study. BMJ 321, 1259–1262 (2000).
8. Frank-Herrmann, P., Gnoth, C., Baur, S., Strowitzki, T. & Freundl, G. Determination of the fertile
window: Reproductive competence of women - European cycle databases. Gynecol. Endocrinol.
20, 305–312 (2005).
9. Bigelow, J. L. et al. Mucus observations in the fertile window: A better predictor of conception
than timing of intercourse. Hum. Reprod. 19, 889–892 (2004).
10. Frank-Herrmann, P. et al. The effectiveness of a fertility awareness based method to avoid
pregnancy in relation to a couple’s sexual behaviour during the fertile time: A prospective
longitudinal study. Hum. Reprod. 22, 1310–1319 (2007).
11. Duane, M., Contreras, A., Jensen, E. T. & White, A. The Performance of Fertility Awareness-
based Method Apps Marketed to Avoid Pregnancy. J. Am. Board Fam. Med. 29, 508–11 (2016).
18bioRxiv preprint first posted online Aug. 15, 2018; doi: http://dx.doi.org/10.1101/385054. The copyright holder for this preprint
(which was not peer-reviewed) is the author/funder, who has granted bioRxiv a license to display the preprint in perpetuity.
It is made available under a CC-BY-ND 4.0 International license.
12. Dreaper, J. Women warned about booming market in period tracker apps - BBC News. BBC
(2016).
13. Moglia, M. L., Nguyen, H. V., Chyjek, K., Chen, K. T. & Castaño, P. M. Evaluation of
Smartphone Menstrual Cycle Tracking Applications Using an Adapted APPLICATIONS Scoring
System. Obstet. Gynecol. 127, 1153–1160 (2016).
14. Moglia, M. L. & Castano, P. M. A Review of Smartphone Applications Designed for Tracking
Women’s Reproductive Health. Obstet. Gynecol. 125, 2015 (2015).
15. Freis, A. et al. Plausibility of Menstrual Cycle Apps Claiming to Support Conception. Front.
Public Heal. 6, 1–9 (2018).
16. Berglund Scherwitzl, E., Gemzell Danielsson, K., Sellberg, J. A. & Scherwitzl, R. Fertility
awareness-based mobile application for contraception. Eur. J. Contracept. Reprod. Heal. Care
21, 234–241 (2016).
17. Berglund Scherwitzl, E. et al. Perfect-use and typical-use Pearl Index of a contraceptive mobile
app. Contraception (2017). doi:10.1016/j.contraception.2017.08.014
18. Berglund Scherwitzl, E., Lindén Hirschberg, A. & Scherwitzl, R. Identification and prediction of
the fertile window using NaturalCycles. Eur. J. Contracept. Reprod. Heal. Care 20, 403–408
(2015).
19. Alvergne, A., Wheeler, M. V. & Tabor, V. H. Do sexually transmitted infections exacerbate
negative premenstrual symptoms? Insights from digital health. 1–40 (2018).
doi:10.1093/emph/eoy018/5048464
20. Pierson, E., Althoff, T. & Leskovec, J. Modeling Individual Cyclic Variation in Human Behavior.
(2017). doi:10.1145/3178876.3186052
21. Liu, B. et al. Predicting pregnancy using large-scale data from a women’s health tracking mobile
19bioRxiv preprint first posted online Aug. 15, 2018; doi: http://dx.doi.org/10.1101/385054. The copyright holder for this preprint
(which was not peer-reviewed) is the author/funder, who has granted bioRxiv a license to display the preprint in perpetuity.
It is made available under a CC-BY-ND 4.0 International license.
application. ArXiv (2018).
22. Barron, M. L. & Daly, K. D. Expert in fertility appreciation: The Creighton Model practitioner. J.
Obstet. Gynecol. Neonatal Nurs. 30, 386–391 (2001).
23. Templeton, A. A., Penney, G. C. & Lees, M. M. Relation between the luteinizing hormone peak,
the nadir of the basal body temperature and the cervical mucus score. BJOG An Int. J. Obstet.
Gynaecol. 89, 985–988 (1982).
24. Case, A. & Reid, R. Menstrual Cycle Effects on Common Medical Conditions. Compr. Ther. 27,
65–71 (2001).
25. Spencer E.A., Appleby, P. N., Davey, G. K. & Key, T. J. Validity of self-reported height and
weight in 4808 EPIC–Oxford participants. Public Health Nutr. 5, 561–565 (2002).
26. Moghissi, K. S. Accuracy of Basal Body Temperature for Ovulation Detection. Fertil. Steril. 27,
1415–1421 (1976).
27. Moghissi, K. S., Syner, F. N. & Evans, T. N. A composite picture of the menstrual cycle. Am. J.
Obstet. Gynecol. 114, 405–18 (1972).
28. Lenton, E. A., Landgren, B. M., Sexton, L. & Harper, R. Normal variation in the length of the
follicular phase of the menstrual cycle: effect of chronological age. Br. J. Obstet. Gynaecol. 91,
681–4 (1984).
29. Lenton, E. A., Landgren, B. M. & Sexton, L. Normal variation in the length of the luteal phase of
the menstrual cycle: identification of the short luteal phase. Br. J. Obstet. Gynaecol. 91, 685–9
(1984).
30. Moghissi, K. S. Accuracy of Basal Body Temperature for Ovulation Detection**Presented at the
Thirty-Second Annual Meeting of The American Fertility Society, April 5 to 9, 1976, Las Vegas,
Nev. Fertil. Steril. 27, 1415–1421 (1976).
20bioRxiv preprint first posted online Aug. 15, 2018; doi: http://dx.doi.org/10.1101/385054. The copyright holder for this preprint
(which was not peer-reviewed) is the author/funder, who has granted bioRxiv a license to display the preprint in perpetuity.
It is made available under a CC-BY-ND 4.0 International license.
31. Fehring, R. J., Schneider, M. & Raviele, K. Variability in the Phases of the Menstrual Cycle. J.
Obstet. Gynecol. Neonatal Nurs. 35, 376–384 (2006).
32. Johannisson, E., Landgren, B.-M., Rohr, H. P. & Diczfalusy, E. Endometrial morphology and
peripheral hormone levels in women with regular menstrual cycles**Supported by the World
Health Organization (WHO) Special Programme of Research in Human Reproduction and by
Swiss National Research Foundation grant 3.912-0.82.††. Fertil. Steril. 48, 401–408 (1987).
33. Cole, L. A., Ladner, D. G. & Byrn, F. W. The normal variabilities of the menstrual cycle. Fertil.
Steril. 91, 522–527 (2009).
34. Harlow, S. D. & Ephross, S. A. Epidemiology of Menstruation and Its Relevance to Women ’ s
Health. Public Health 17, (1995).
35. Charkoudian, N. & Stachenfeld, N. Sex hormone effects on autonomic mechanisms of
thermoregulation in humans. Auton. Neurosci. Basic Clin. 196, 75–80 (2016).
36. Crawford, N. M., Pritchard, D. A., Herring, A. H. & Steiner, A. Z. Prospective evaluation of
luteal phase length and natural fertility. Fertil. Steril. 107, 749–755 (2017).
37. American Academy Of Pediatrics and American College of Obstretricians and Gynecologists.
Menstruation in Girls and Adolescents: Using the Menstrual Cycle as a Vital Sign. Am. Acad.
Pediatr. 137, e20154480–e20154480 (2016).
38. Alvergne, A. & Högqvist Tabor, V. Is female health cyclical? Evolutionary perspectives on
menstruation. Trends Ecol. Evol. 33, In Press (2018).
39. Salathé, M. et al. Digital epidemiology. PLoS Comput. Biol. 8, 1–5 (2012).
40. Grayson, M. Women’s health. Nature 550, S1 (2017).
41. Pinkerton, J. A. V, Guico-Pabia, C. J. & Taylor, H. S. Menstrual cycle-related exacerbation of
disease. Am. J. Obstet. Gynecol. 202, 221–231 (2010).
21bioRxiv preprint first posted online Aug. 15, 2018; doi: http://dx.doi.org/10.1101/385054. The copyright holder for this preprint
(which was not peer-reviewed) is the author/funder, who has granted bioRxiv a license to display the preprint in perpetuity.
It is made available under a CC-BY-ND 4.0 International license.
42. Rabiner, L. R. A tutorial on hidden Markov models and selected applications in speech
recognition. Proc. IEEE 77, 257–286 (1989).
22bioRxiv preprint first posted online Aug. 15, 2018; doi: http://dx.doi.org/10.1101/385054. The copyright holder for this preprint
(which was not peer-reviewed) is the author/funder, who has granted bioRxiv a license to display the preprint in perpetuity.
It is made available under a CC-BY-ND 4.0 International license.
Tables and table legends
Table 1: number of observations, cycles and users
Total # of Total # of Total # of Avg # of Fraction of Fraction of Fraction of
users cycles days of cycles per full dataset full dataset full dataset
observations users (wrt # of (wrt # of (wrt # of
users) cycles) observations)
Sympto Full dataset 13 674 79 535 1 622 270 5.82
Standard cycles 5 860 39 896 949 358 6.81 43% 50% 59%
Cycles with reliable 5 116 28 453 670 989 5.56 37% 36% 41%
ovulation estimation
Kindara Full dataset 199 293 2 652 889 32 053 183 13.31
Standard cycles 125 170 719 182 15 987 512 5.75 63% 27% 50%
Cycles with reliable 27 378 80 708 2 248 666 2.95 14% 3% 7%
ovulation estimation
Total Full dataset 212 967 2 732 424 33 675 453 12.83
Standard cycles 131 030 759 078 16 936 870 5.79 62% 28% 50%
Cycles with reliable 32 494 109 161 2 919 655 3.36 15% 4% 9%
ovulation estimation
Table 1: Number of users, cycles and days of observations. In a single day, a user can log up to 7
observations, i.e. one in each of the tracking categories available to users, see Table 2.
23bioRxiv preprint first posted online Aug. 15, 2018; doi: http://dx.doi.org/10.1101/385054. The copyright holder for this preprint
(which was not peer-reviewed) is the author/funder, who has granted bioRxiv a license to display the preprint in perpetuity.
It is made available under a CC-BY-ND 4.0 International license.
Table 2: Reported observations
Sympto Kindara
type unit/categories max precision / unit/categories max precision /
subcategories subcategories
BBT Celsius 0.05 Fahrenheit 0.01
BBT time daytime 1/2h daytime minute
questionable (not recorded) logical
temp
mucus NA NA
no mucus no mucus
little amounts of creamy mucus or not creamy little/medium/lots
very stretchable mucus
large amounts of egg-white like, watery, egg-white like little/medium/lots
very stretchable mucus
watery little/medium/lots
sticky mucus sticky little/medium/lots
cervix NA height low/medium/high
closed, firm, low firmness firm/medium/soft
medium openness closed/medium/open
open, soft, high
vaginal NA NA
sensation dry dry
wet dry sticky
very wet wet moist
wet lubricate
sex protected protected
unprotected unprotected
withdrawal
insemination
Table 2: Tracking options available to users of the Sympto and Kindara app. Kindara offers more
granularity and categories for reporting mucus, cervix and vaginal sensation. Provided that they
primarily market users who wish to achieve pregnancy, they also offer the option to track insemination.
Sympto considers withdrawal as unprotected sex and does not offer that option to their user.
24bioRxiv preprint first posted online Aug. 15, 2018; doi: http://dx.doi.org/10.1101/385054. The copyright holder for this preprint
(which was not peer-reviewed) is the author/funder, who has granted bioRxiv a license to display the preprint in perpetuity.
It is made available under a CC-BY-ND 4.0 International license.
Table 3: users demographics
Mean ± standard Fraction of users with
deviation available information (%)
Age 29.9 ± 6.4 (Sympto) 81 (Sympto)
29.2 ± 5.9 (Kindara) 13 (Kindara)
Age at Menarche 12.9 ± 1.6 (Sympto) 79 (Sympto)
Height (in cm) 161 ± 21(Sympto) 80 (Sympto)
Weight (in kg) 62 ± 13 (Sympto) 80 (Sympto)
BMI 23 ± 5 (Sympto) 80 (Sympto)
Table 3: Users demographic information.
25bioRxiv preprint first posted online Aug. 15, 2018; doi: http://dx.doi.org/10.1101/385054. The copyright holder for this preprint
(which was not peer-reviewed) is the author/funder, who has granted bioRxiv a license to display the preprint in perpetuity.
It is made available under a CC-BY-ND 4.0 International license.
Figures and figure legends
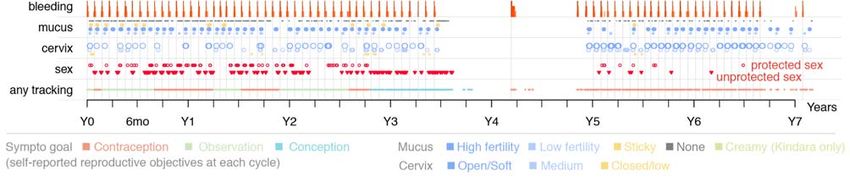
Figure 1: Menstrual history of two app users
Menstrual history of two long term Kindara (A) and Sympto (B) users. Time is shown in years as relative to the first
observation of each user. Kindara user is seeking to achieve pregnancy and show a long anovulatory episode during which
her overall temperature profile is lower. She returns to more regular, ovulatory cycles in her last year of tracking, as indicated
by the bleeding frequency and the temperature profiles. The Sympto user has used the app to avoid pregnancy and observe
her cycle for almost 3 years, before trying to conceive, which she likely achieves after 9 cycles (her reported reproductive
objective switches from “contraception” to “conception” – line “any tracking” at the bottom). 9 months later, the user reports
bleeding, which likely indicates post-partum bleeding (lochia). After another 9 months, probably as she stops breastfeeding,
she logs menstrual observations and returns to using the app to avoid pregnancy.
26bioRxiv preprint first posted online Aug. 15, 2018; doi: http://dx.doi.org/10.1101/385054. The copyright holder for this preprint
(which was not peer-reviewed) is the author/funder, who has granted bioRxiv a license to display the preprint in perpetuity.
It is made available under a CC-BY-ND 4.0 International license.
Figure 2: Demographics and tracking behavior of users
(A) Users’ age at registration (left), reported height (middle-left), weight (middle-right) and menarche age of users (right).
(B) Cycle selection flowchart. Methods provide extensive description of the inclusion/exclusion criteria. Standard cycles are
finished, complete cycles, typical of a non-pregnant, non-peri-menopausal, non-nursing user, that have at least 8 days with
FAM observations (Kindara) or that are detected as ovulatory cycles according to the Sympto implementation of the STM
rules. Cycles with reliable ovulation estimation are cycles for which the ovulation day could be reliably estimated by the
HMM framework developed for this study (Methods).
(C) Cycle-specific tracking frequencies (top: Sympto, bottom: Kindara). 39,896 (Sympto) + 719,182 (Kindara) standard
cycles were used (Methods). Dashed lines indicate median values.
27bioRxiv preprint first posted online Aug. 15, 2018; doi: http://dx.doi.org/10.1101/385054. The copyright holder for this preprint
(which was not peer-reviewed) is the author/funder, who has granted bioRxiv a license to display the preprint in perpetuity.
It is made available under a CC-BY-ND 4.0 International license.
Figure 3: User observations overview
(A) Examples of observations: the 5th tracked cycle (top) and 66th cycle (middle) cycle of two different
Sympto users. Observations of the 19th cycle (bottom) of a Kindara user.
(B) ΔBBT (variation from the 25% percentile of temperature in this cycle) values are shown on each day
of the cycle, from the end of the cycle. Opacity of the dots reflects the number of observations. The
median value: thick blue line. 10, 25, 75 and 90 percentiles of ΔBBT: translucent blue bands.
28bioRxiv preprint first posted online Aug. 15, 2018; doi: http://dx.doi.org/10.1101/385054. The copyright holder for this preprint
(which was not peer-reviewed) is the author/funder, who has granted bioRxiv a license to display the preprint in perpetuity.
It is made available under a CC-BY-ND 4.0 International license.
(C) Frequency of bleeding observations, for the end (left) and beginning (right) of cycles. The Sympto
app only starts a new cycle on the first recording of heavy bleeding (score 3/3, dark red) after a post-
ovulatory infertile phase, thus all cycles present heavy bleeding at the start of the cycle (hashed dark red
bar).
(D) Frequency of cervical mucus observations from the end of cycles (top: S, bottom: K). (Kindara)
Little quantity of watery mucus (dashed line) and little or medium quantity of egg-white like mucus
(solid line) are considered as ‘low fertility’ mucus (light blue) while large quantities of egg-white like
and medium or large quantities of watery mucus are considered as ‘high fertility’ mucus (dark blue) (B-
D) 39,896 (S) + 719,182 (K) standard cycles were used (Methods)
29bioRxiv preprint first posted online Aug. 15, 2018; doi: http://dx.doi.org/10.1101/385054. The copyright holder for this preprint
(which was not peer-reviewed) is the author/funder, who has granted bioRxiv a license to display the preprint in perpetuity.
It is made available under a CC-BY-ND 4.0 International license.
Figure 4: Modeling framework for the estimation of ovulation and menstrual states
(A) Modeling framework for the estimation of ovulation timing. (Top) Schematics of the 10-states HMM which discretizes
the menstrual hormonal events (HM: Heavy Menses, LM: Light Menses, LE: Low Estrogen, HE: high Estrogen, Ovu:
Ovulation, Rise: progesterone/BTT Rise, HP: High Progesterone, EP: Estrogen Peak in luteal phase, LP: Low Progesterone).
Arrows indicate possible state-transition; arrow thickness is not representative of actual transition probabilities (Methods).
(Bottom) Examples of menstrual state estimation for the 2rd and 3rd cycle of 2 users. (Top of each chart) Original user
observations as in Fig. 2A. (Middle of each chart) Colored squares HMM-labeled line) represent the most likely sequence of
HMM states given the observations (Methods). (Bottom of each chart) Normalized probabilities of each state on each day of
the cycle (Methods).
(B) (Top) Cycle length and estimated ovulation day. (Bottom) Luteal phase duration, computed as the number of days
30bioRxiv preprint first posted online Aug. 15, 2018; doi: http://dx.doi.org/10.1101/385054. The copyright holder for this preprint
(which was not peer-reviewed) is the author/funder, who has granted bioRxiv a license to display the preprint in perpetuity.
It is made available under a CC-BY-ND 4.0 International license.
between the ovulation day (excluded) and the1st day of the next cycle (excluded). Vertical lines indicate median values.
80,708 (K) + 24,119 (S) cycles with reliable ovulation estimation were used (Methods).
(C) Average estimated state probabilities by cycle-day counting from estimated ovulation aggregated by total cycle length (in
bins of 3 units) for all cycles with reliable ovulation estimation.
31You can also read