Surface Activity of Humic Acid and Its Sub-fractions from For- est Soil
←
→
Page content transcription
If your browser does not render page correctly, please read the page content below
Preprints (www.preprints.org) | NOT PEER-REVIEWED | Posted: 29 June 2021 doi:10.20944/preprints202106.0702.v1

 Article

 Surface Activity of Humic Acid and Its Sub-fractions from For-
 est Soil
 Shijie Tian1, Weiqiang Tan1*, Xinyuan Wang1, Tingting Li2, Fanhao Song2, Nannan Huang2

 1 School of Environmental and Municipal Engineering, Qingdao University of Technology, Qingdao 266033,
 China; 2064983040@qq.com (S.T); 2219565207@qq.com (X.W)
 2 State Key Laboratory of Environmental Criteria and Risk Assessment, Chinese Research Academy of Envi-

 ronmental Sciences, Beijing 100012, China; litingting193@163.com (T.L); sonfh@craes.org.cn (F.S);
 nan625420052@163.com (N.H)
 * Correspondence: tanweiqiang@qut.edu.cn

 Abstract: Surface activity of humic acid (HA) and its six sub-fractions isolated from forest soil were
 characterized by surface tension measurements, dynamic light scattering, and laser doppler electro-
 phoresis. The surface tension of HA and its sub-fractions reduced from 72.4 mN·m-1 to 36.8 mN·m-
 1 in exponential model with the increasing concentration from 0 to 2000 mg·L-1. The critical micelle
 concentration (CMC) and Z-average particle size ranged from 216-1024 mg·L-1 and 108.2-186.9 nm
 for HA and its sub-fractions, respectively. The CMC have related with alkyl C, O-alkyl C, aromatic
 C, and carbonyl C (p < 0.05), respectively, and could be predicted with the multiple linear regression
 equation of CMC, CMC = 18896–6.9×C–296×alkyl C–331×aromatic C–17019×H/C+4054× HB/HI (p <
 0.05). The maximum particle size was 5000 nm after filtered by a membrane with pore size of 450
 nm, indicating HA and its sub-fractions could progressed self-assembly at pH 6.86. The aggregate
 sizes of number-base particle size distributions were mainly in six clusters including 2 ± 1 nm, 5 ± 2
 nm, 10 ± 3 nm, 21 ± 8 nm, 40 ± 10 nm, and > 50 nm analyzed by Gaussian model that maybe due to
 the inconsistency of the components and structures of the HA sub-fractions, requiring further study.
 It is significance to explore the surface activity of HA and its sub-fractions, which is helpful to clarify
 the environmental behavior of HA.

 Keywords: Humic acid; Surface tension; CMC; Gaussian model

 1. Introduction
 Humic acid (HA) is a complex and heterogeneous mixture of aromatic and aliphatic
 organic compounds with organic supramolecular systems existing in waters, soils, and
 sediments [1-3]. Similar to synthetic surfactants, HA can form a micelle-like structure at
 high concentrations because of the amphiphilic properties with hydrocarbon chains as
 hydrophobic fractions, and carboxylic and nonionic polar portions as hydrophilic frac-
 tions [4-8]. Synthetic surfactants have many applications and high consumption rates in
 different fields including household cleaning detergents, personal care products, textiles
 and pesticide formulations, etc. [3, 9-11]. Previous researches documented that the engi-
 neered surfactants were toxic to microorganisms, plants (e.g., Sorghm bicolour, Helianthuus
 annuus, Phaseolus aureus, etc.), and aquatic organisms (e.g., D. magna , P. phosphorem etc )
 [12-14]. As a natural surfactant, HA might have possible usage as an environment-friendly
 substitution of synthetic surfactants [15-18].
 The concentration at which the micelle formation occurs is defined as the critical mi-
 celle concentration (CMC) that is an important parameter to describe a surfactant [5]. HAs
 showed a large range of CMC from several hundred to thousands. For example, the CMC
 was 7400 mg·L-1 for commercial Aldrich HA [4], 800-3300 mg·L-1 of soil HA from southern
 Chile of uncultivated pasture areas of Collipulli, Andisols Ralun, Nueva Braunau, Fru-

 © 2021 by the author(s). Distributed under a Creative Commons CC BY license.
Preprints (www.preprints.org) | NOT PEER-REVIEWED | Posted: 29 June 2021 doi:10.20944/preprints202106.0702.v1

 tillar, Osorno, Vilcun and Temuco [19]. 400-4040 mg·L-1 of HA derived from waste com-
 post [5, 7], 289-777 mg·L-1 of soil HA sub-fractions from Nagano and Hyogo Prefecture,
 Japan [20]. The inconsistent CMC could be attributed to the complicated composition and
 structure of HAs, such as the hydrophobic group, the hydrophilic group, electrolyte, and
 temperature, etc. [21]. The separation of HA into sub-fractions was a powerful method to
 characterize the structure of humic substances, as well as to clarify the potential interac-
 tion mechanisms between HA and contaminants [1, 2, 22-24]. However, the sub-fractions
 of HA have not been widely used to investigate on surface activity of HA, including CMC
 and surface tension.
 The multiple regression models were powerful method to model on the various re-
 search areas [25], including intention to obtain of mammogram [26], heating value of bio-
 mass fuels [27], and students’ lessons scores [28] etc. Multiple regression equations were
 widely applied to investigate influence factors of CMC value, quantitively. For example,
 Liang, et al. [29] indicated the CMC have a significant linear correlation with alkyl C, and
 the sum content of N and S base on six samples of HAs derived from lignocelluloses waste,
 lignocelluloses plus food wastes, and Aldrich HA (Eq. S1) [17]. The significant linear rela-
 tionships between CMC with alkyl C percentage and molecule weight (MW) were re-
 ported by Adani, et al. [30] with HA isolated from lignocelluloses waste, lignocelluloses
 plus food wastes, maize plant residue, as well as Aldrich HA (Eq. S2) [30]. The regression
 equation was also documented by Salati, et al. [3] according to 13 samples of HA from
 biomass such as urban green wastes, lignocelluloses waste, and green wastes, etc. (Eq. S3)
 [3]. The soil is the greatest source of HA, and the possible regression equations should be
 modified base on HA from soil because of the lack of data of HAs from the soil.
 Dynamic light scattering (DLS) is applied to characterize the aggregation size of HAs
 base on Brownian motion of particles in an aqueous solution [31-33]. The average sizes of
 HAs, name as Z-average diameters ranging from 185-280 nm for Aldrich HA [32], from
 210 to 280 nm for Elliott Soil HA ranged from International Humic Substances Society
 (IHSS) [34], and 185 nm for HA derived from Irish moss peat [35] base on DLS analysis.
 In addition, Z-average diameters are affected by many factors, such as cation concentra-
 tion, pH, salinity, etc. [36]. However, Z-average diameter could not reflect the truly poly-
 modal character of HA, because its calculations assume the sample is monomodal. Gauss-
 ian distribution model is a common quantitative method in complex multicomponent sys-
 tems, which can distinguish overlapped and hidden peaks in the spectral analysis includ-
 ing XPS, FTIR, 13C NMR, etc. [37-39]. However, the Gaussian distribution model had not
 been utilized to analyze particle size distributions (PSD) of HA sub-fractions according to
 DLS analysis.
 Therefore, six sub-fractions of Chinese standard HA from forest soil were applied to
 explore the relationship between properties of HAs with their surfactant activity. The ob-
 jectives were 1) to determine the various surface activity for HA sub-fractions; 2) to mod-
 ify and update the possible multiple linear regression equation of CMC with data of soil
 HA, and 3) to visit the distribution characterization of hydrodynamic radii of HAs sub-
 fractions by Gaussian distribution model.

 2. Materials and Methods

 2.1. Isolation and purification of HA and its sub-fractions
 Chinese standard HA was isolated and purified from the surface soil of Jiufeng
 Mountain Forest, Beijing, China. The sample soil type is yellow earths. The carbon and
 nitrogen content of soil was 2.95% and 0.39%, respectively. Briefly, the soil was sieved
 before through 2 mm mesh. Isolation and purification of HA were performed according
 to procedures recommended by the IHSS. Detailed information on the method has been
 previously reported [2]. The HA sub-fractions named as HA1-HA6 were isolated with
 0.02 mol·L-1 Na4P2O7, 0.05 mol·L-1 Na4P2O7, 0.1 mol·L-1 Na4P2O4, 0.05 mol·L-1 NaOH, 0.1
 mol·L-1 NaOH, and 0.25 mol·L-1 NaOH in sequence with a solid to solution ratio of 1:10
 (w: v) for 24 hrs. The Si and Cl- in the solution of HA sub-fractions were purified with 0.1
Preprints (www.preprints.org) | NOT PEER-REVIEWED | Posted: 29 June 2021 doi:10.20944/preprints202106.0702.v1

 mol·L-1 HCl and 0.3 mol·L-1 HF, as well as dialysis membranes with 1 KD (Spectra/Por6,
 Standard, RC, USA). All solutions were prepared in Milli-Q water (Millipore, USA), and
 all chemicals were AR grade unless mentioned otherwise. Detailed information on isola-
 tion and fractionation of humic substance are described elsewhere [1].

 2.2. Surface tension measurements
 The surface tension of HA and its sub-fractions were measured with the model
 Dataphysics DCAT21 (DataPhysics Instruments GmbH, Filderstadt, Germany.) with Wil-
 helmy method [40]. The Pt plate was cleaned by washing with 0.1 mol·L-1 HCl solution
 and then Milli-Q water in sequence, and finally held in an alcoholic flame for more than
 500oC for 1 min. The stock solution for both HA and its sub-fractions was ca. 5000 mg·L -1
 at pH 6.86 with 0.1 mol·L-1 K2HPO4/KH2PO4 as a buffer and 0.1 mol·L-1 NaCl as back-
 ground. The solutions for detecting were prepared by mixing the stock solutions with the
 appropriate volume of solution with both 0.1mol·L-1 K2HPO4/KH2PO4 and 0.1mol·L-1 NaCl.
 All solutions were filtered 0.45 μm membrane and regulated at 25 ± 0.5 °C by a thermostat
 bath equipped with a circulator pump in the surface tension measurement experiment.
 The exponential model was surface tension vs. the concentration of HA sub-fractions were
 fitted with an exponential model (Eq. 1):

 = + (1)

 Where γ0 is the surface tension of aqueous solution at c=0, γplateaus is the value of the
 surface tension reduction curve plateaus, Δγ is the maximum γ variation that correspond-
 ing to the concentration (c), and A is the reach of γplateaus rate (γ per milligram).
 The critical micellar concentration (CMC) of HA and its sub-fractions were calculated
 from the surface tension vs. log concentration plot. The CMC was established according
 to the interaction of the two lines describing premicellar and postmicellar regimes base on
 the surface tension of HA and its sub-fractions.

 2.3. DLS and Zeta potential methodology
 The DLS measurement, with an operational range of 0.6~6000 nm was performed
 using the Malvern Zetasizer ZS instrument (Malvern Instruments Ltd, UK) equipped with
 a He-Ne laser of 633 nm. The attenuator was adjusted to automatically respond to produce
 the optimum laser intensity based on the sample condition of HA sub-fractions. To reduce
 the possible light scattering, the detector position was set at an angle of 173°. The solutions
 of HA sub-fractions were poured into a cuvette with a plastic cap to avoid the volatiliza-
 tion at a concentration of 2000 mg·L-1 with 0.1mol·L-1 K2HPO4/KH2PO4 and 0.1mol·L-1 NaCl
 at pH = 6.86. Equilibrium time was retained inside the instrument for two minutes to reach
 a constant temperature of 25 °C before detection. All solutions were filtered 0.45 μm mem-
 brane, twelve replicates were determined to reduce the statistic error, and 2 mins intervals
 were recorded for each replicate. The HA aggregation size was collected in PSD of inten-
 sity, volume, and number recorder according to the International Standard ISO13321,
 Methods for Determination of PSD.
 The zeta potential of the HA solutions was measured at scattered light detected at an
 angle of 13°. The zeta potential was estimated from the electrophoretic mobility of parti-
 cles according to Henry's equation and Smoluchowski approximation [41]. HA and its
 sub-fractions were determined at concentration of 2000 mg·L-1 with 0.1mol·L-1
 K2HPO4/KH2PO4 and 0.1 mol·L-1 NaCl at pH = 6.86.

 2.4. Gaussian distribution model
 Gaussian distribution model was applied to fit the PSD curves of HA sub-fractions
 with a second-derivative method. The number-based PSD curve was accomplished by use
 of the residual of the second derivative, and “Peak types” of fitting functions were set as
 “Gaussian” in GM to analyze the HA sub-fractions. Fitting peaks were optimized by mod-
 ifying peak height, width, and shape until the correlation coefficient (R2) value between
Preprints (www.preprints.org) | NOT PEER-REVIEWED | Posted: 29 June 2021 doi:10.20944/preprints202106.0702.v1

 the original spectra and fitted curves was close to 1.0 corresponding to minimal variance
 (Eq. 2).
 ( )

 = + (2)
 ( ) /

 Where B is the baseline, A is the Gaussian peak area, w is Gaussian peak of width at
 half-height, x is size of HA sub-fractions aggregates, μ is the location at the center of the
 peak of number-base PSDs of HA sub-fractions.

 3. Results
 The HA and its sub-fractions were characterized and reported previously as Chinese
 standard HA including elemental analysis, 13C-NMR, etc. The content of carbon (C), hy-
 drogen (H), and nitrogen (N) increased from 540.3-593.8 g·kg-1, from 33.8-66.0 g·kg-1, from
 28.2-39.9 g·kg-1, while the content of oxygen (O) decrease from 286.5-372.1 g·kg -1 from
 HA1-HA6. The alkyl C, O-alkyl C, aromatic C and carbonyl C ranged 17.7-30.0%, 16.7-
 23.94%, 30.4-43.2%, 14.4-23.9%, respectively for HA sub-fractions [42]. According to the
 13C-NMR spectra of HA and its sub-fractions (Table 1).

 Table 1. The CMC values, elemental analysis, and 13C NMR in area of HAs isolations from biomass and soil.

 C H N O O- CMCb CMCc
 Alkyl Aromatic Carbonyl
 Source (g·kg - (g·kg - (g·kg - (g·kg - Alkyl HB/HI (mg·L - (mg·L- References
 C (%) C (%) C(%)
 1 ) 1 ) 1 ) 1 ) C (%) 1 ) 1 )
 Food wastes +
 green wastes Quagliotto,
 599 66.6 59.9 270.0 45.2 21.1 21.6 12.1 2.01 403 497
 (1/v/v) (15 d et al. [7]
 composted)
 Urban green
 Montoneri,
 wastes no 579 60.7 45.5 231.3 49.5 21.6 14.2 14.6 1.76 970 906
 et al. [43]
 composted
 Green wastes
 Savarino, et
 (start of aerobic 650 58.5 45.5 247.0 48.9 25.1 16.1 9.9 1.86 770 625
 al. [44]
 digestion)
 Green wastes (7 d Savarino, et
 635 58.5 57.1 247.0 44.6 24.6 17.4 12 1.69 750 846
 digested) al. [44]
 Green wastes (60 d Savarino, et
 604 50.8 42.3 302.0 43.5 26.6 19.3 10.5 1.69 730 892
 digested) al. [44]
 Food + green
 wastes (1/1-w/w) Savarino, et
 645 54.3 51.6 245.0 55.1 23.2 11 10.4 1.97 999 1057
 start of aerobic al. [44]
 digestion
 Food + green
 Savarino, et
 wastes (1/1-w/w) 627 62.7 53.3 257.0 53.8 24.4 12 8.8 1.98 1010 1005
 al. [44]
 7 d digested
 Food + green
 wastes Savarino, et
 617 55.5 49.4 277.6 48.8 22.2 16.5 12.5 1.88 980 831
 (1/1-w/w)60 d al. [44]
 digested
 Maize plant Adani, et al.
 548 64 41 342.0 26.8 42.3 21.1 9.9 0.92 1986 1950
 residues [30]

 HA-1 540.3 35.8 28.2 372.1 17.7 19.1 41.3 22.0 1.44 1016 977 a

 HA-2 542.5 33.8 28.5 368.8 16.8 16.7 43.2 23.2 1.50 1024 910 a
Preprints (www.preprints.org) | NOT PEER-REVIEWED | Posted: 29 June 2021 doi:10.20944/preprints202106.0702.v1

 HA-3 541.6 39.2 36.2 362.3 19.9 17.1 39.1 23.9 1.44 833 941 a

 HA-4 567.2 52.9 42.7 307.3 25.6 22.1 31.9 20.4 1.35 779 741 a

 HA-5 579.8 60.7 38.4 299.0 29.9 25.3 30.4 14.4 1.52 343 372 a

 HA-6 593.8 66.0 39.9 286.5 30.0 23.9 30.4 15.7 1.52 216 136 a

 HA 570.1 52.1 36.4 303.6 23.39 21.5 34.0 21.2 1.34 551 671 a

 a. data from this work.
 b. CMC value experimentally determined.
 c. Calculated by using the multiple regression model: CMC = 18896–6.9×C–296×alkyl C–331×aromatic C–17019×H/C+4054×HB/HI.
 in which CMC is given in mg·L−1, C is given in g·k g−1, alkyl C and aromatic C in% of the total 13C-NMR area, HB/HI: ratio
 between hydrophobic vs. hydrophilic C, in which, HI = percentage of hydrophilic carbon calculated as the sum of the13C CP
 MAS NMR area of (45-110) + (160-220) ppm and HB = percentage of hydrophobic carbon calculated as the sum of the13C CP
 MAS NMR area of (0-45) + (110-160) ppm.

 3.1. Surfactant properties of humic acid and its sub-fractions
 The surface tension decreased with the increase of the concentrations of HA sub-frac-
 tions from 0-2000 mg·L-1 at pH 6.86 with 0.1 mol·L-1 phosphate and NaCl as background
 )(Figure 1). Two stages were clearly observed for both HA and its sub-fractions with
 surface tension from 45.6-72.4(Figure 1). The surface tensions decreased rapidly from 72.4
 to 36.8 mN·m-1 with the concentrations of HA sub-fractions from 0 to 2000 mg·L-1. After
 200 mg·L-1 HA sub-fractions were added, the surface tensions decreased gradually to 45.6-
 65.6 mN·m-1 (Figure 1). The reducing surface tension of the aqueous solution increases the
 concentrations of HA sub-fractions. The same experimental phenomena have been re-
 ported before that samples were Aldrich HA, Suwannee River HA from IHSS, organic
 compost, and soil, etc. [4, 5, 19, 30, 44, 45]. For example, the surface tension of HA sub-
 fractions at about 2000 mg/L was comparable with Aldrich HA (~50 mN·m-1) [4], Elliott
 soil HA (46 mN·m-1) [29], as well as HAs from surface soil of southern Chile (~45 mN·m-1)
 [19]. This phenomenon could be attributed to the self-assembly into an aggregation of HA
 as a natural surfactant, and the variation of HA aggregation size was also discussed in
 section 3.3 (Figure. 1).

 1.0

 0.8
 γ/γ0×100

 0.6

 0.4
 0 500 1000 1500 2000
 concentration (mg·L-1)

 Figure 1. The reduction rate of surface tension with the concentration of HA1, HA6, and HA (■
 HA1, ► HA, ◄ HA6. The solid lines were fitted with exponential function).

 The curves of surface tension vs. concentration of HA sub-fractions were well fitted
 by the least squares method using an exponential model with R2 from 0.945 to 0.996 (Eq.
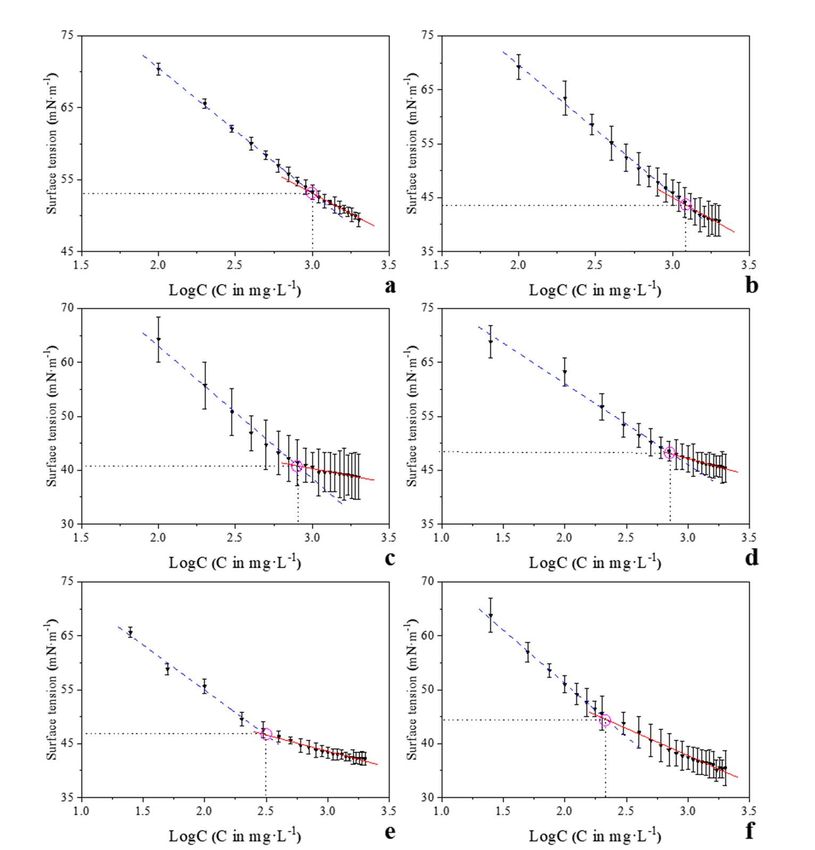
Preprints (www.preprints.org) | NOT PEER-REVIEWED | Posted: 29 June 2021 doi:10.20944/preprints202106.0702.v1

 1). The Δγ ranged from 22.9-35.7 mN·m-1 in order to, HA6 > HA3 > HA2 > HA5 > HA4 >
 HA1. Previous researchers reported that the Δγ of surfactant was related to due to carbon
 atoms in a straight-chain hydrophobic group [21]. Therefore, the difference Δγ of HA sub-
 fractions may be due to it’s the content of carbon atoms in a straight-chain hydrophobic
 group. The A ranged from 0.0018 to 0.0075 for HA1-HA6, among HA5-HA6 > HA1-4 that
 suggest the later isolated HAs had more efficiency reach γplateaus (Table 1).

 3.2. The CMC of HA and its sub-fractions
 The CMC is an important index to measure the surface activity of HA. The CMC of
 HA sub-fractions ranged from 216-1024 mg·L-1 according to surface tension detected by
 Wilhelmy method, in order of HA1 ≈ HA2 > HA3 > HA4 > HA5 > HA6 (Figure 2). This
 result consistent with previous research reports, HA derived from urban green wastes
 (970 mg·L-1) [43], green waste (730-770 mg·L-1) [44], green and food waste (403-1010 mg·L-
 1) [44], southern Chile soil of uncultivated pasture areas (800-3300 mg·L-1) [19], Nagano

 and Hyogo Prefecture soil of Japan (289-777 mg·L-1) [20].
Preprints (www.preprints.org) | NOT PEER-REVIEWED | Posted: 29 June 2021 doi:10.20944/preprints202106.0702.v1

 Figure 2. Surface tension versus HA and its sub-fractions concentrations (mg·L -1). CMC was calcu-
 lated from the intersection of the premicellar and postmicellar straight lines (a. HA1; b. HA2; c.
 HA3; d. HA4; e. HA5; f. HA6; g. HA. ┄ premicellar; — postmicellar).

 Table 2. Fitting exponential function surface tension values of HA sub-fractions.

 γ (mN m-1) Δγ (mN m-1) A (%) R2

 HA-1 49.6(65.6)a 23.45 0.0019 0.995
 HA-2 40.0(63.4) a 33.16 0.0018 0.995
 HA-3 39.1(55.7)a 34.07 0.0035 0.998
 HA-4 46.2(56.7) a 25.86 0.0040 0.992
 HA-5 43.2(49.5)a 28.77 0.0075 0.980
 HA-6 36.8(45.6)a 33.95 0.0057 0.973
 HA 45.8(55.9)a 25.80 0.0047 0.998
 a. Surface tension at a concentration of 200mg·L-1 of HA sub-fractions;
 b. γ0 is the value where the decrease curve plateaus;
 c. γ1 is the total solution surface tension decrease value;
 d. A is the efficiency in surface tension reduction (γ per milligrams).

 To compare the performance of HA in reducing surface tension, it is necessary to
 distinguish between the A and Δγ of an aqueous solution. No correlation was obtained
 between CMC and Δγ for HA sub-fractions. The concentration-forming micelles (CMC)
 have no relationship with Δγ for HA and its sub-fractions. The insignificant correlation
 might be attributed to the different structures or composition of HAs regulating micelle
 formation and maximum reduction in tension, which should be further investigated [21].
 There was significant relationship for CMC with alkyl C with R2 0.872 (p < 0.05), O-
 alkyl C with R2 0.748 (p < 0.05), aromatic C with R2 0.781 (p < 0.05), and carbonyl C with R2
 0.764 (p < 0.05), respectively in Figure S1. The results also consistent with previous re-
 searchers, Quadri, et al. [5] discovered the value of CMC related to the content of alkyl C
 for the HA isolated from organic compost. The significant correlation should be attributed
 to the increase of the free energy of the water/surfactant-like system and the reduction of
 anticipating the process of micellization by a greater content of alkyl chains and aromatic
 HA molecule [5].
 The CMC obtained was significantly relationship for N with R2 = 0.538(p < 0.5). This
 result was also reported by Quadri, et al. [5], who focused on lignocelluloses waste com-
 post. The researcher considers that maybe amide molecules mutual repulsion polar
 groups, thereby reducing the work required for micellization [46]. The CMC also correla-
 tion relationship for C (R2 = 0.900, p < 0.5, n = 7) and H (R2 0.912, p < 0.5, n = 7) those
 represents the degree of condensation between HA molecules [47]. The result suggests
 CMC of HA maybe not only with the hydrophobic group but also with the condensation
 degree of molecules.
 Multiple regression models were applied to calculate the CMC according to the pa-
 rameters of HAs including, C, alkyl C, aromatic C, H/C, and HB/HI, the HI was the per-
 centage of hydrophilic carbon calculated as the sum of (45-110 ppm) and (160-220 ppm),
 and HB was the percentage of hydrophobic carbon calculated as the sum of (0-45 ppm)
 and (110-160 ppm) in 13C NMR. Sixteen samples were used to update the CMC prediction
 equation, including HA derived from soil, green waste, and maize plant residues [29, 30,
 43, 44]. For the 16 samples, the contents of C, alkyl C, aromatic C, H/C, and HB/HI ranged
 from 540-650 g·kg-1, 16.8-55.1%, 16.7-42.3%, 0.06-0.12, 0.92-2.01, respectively. Equation 3
 was obtained as CMC = 18896–6.9×C–296×alkyl C–331×aromatic C–
 17019×H/C+4054×HB/HI. The H/C can indicate the degree of intermolecular condensation
 of HA [48]. Therefore, the equation suggests that the value of CMC was not only related
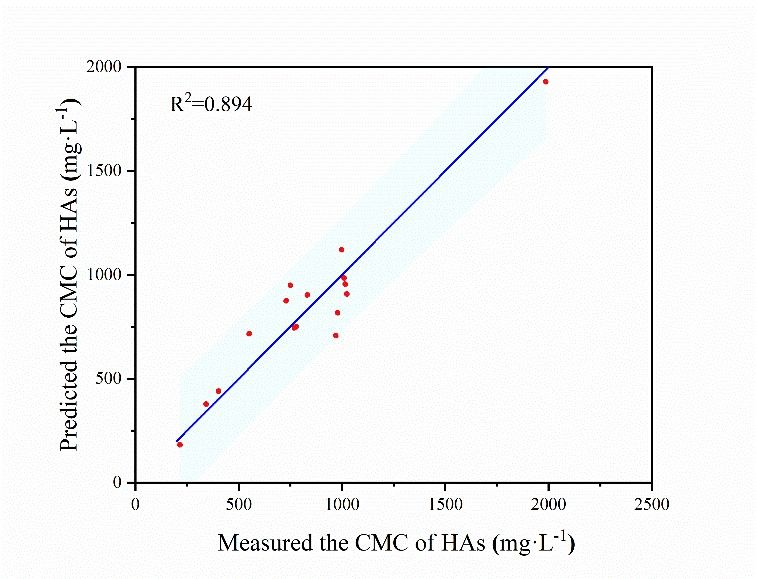
Preprints (www.preprints.org) | NOT PEER-REVIEWED | Posted: 29 June 2021 doi:10.20944/preprints202106.0702.v1

 to the hydrophobic fractions of HA but also related to the degree of intermolecular con-
 densation.
 The obtained model was quite qualified for the prediction of the CMC of HAs sam-
 ples in biomasses and soil. Compared to previous reports, the model added a new sample
 source, soil HA. The R2 (0.909) and n (16) of model were greater than previous reports. For
 example, HAs derived from lignocelluloses waste, lignocelluloses plus food wastes, and
 Aldrich HA (Eq. S1, n = 6, R2 = 0.77) [5], lignocelluloses waste, lignocelluloses plus food
 wastes, maize plant residue, as well as Aldrich HA (Eq. S2, n = 7, R2 = 0.90) [30], urban
 green wastes, lignocelluloses waste, and green wastes, etc. (Eq. S3, n = 13, R2 = 0.878) [3]
 (Table S1). The average absolute error (AAE) of CMC was 12.95%, indicating the predicted
 results were close to the measured results, and the average biased error (ABE) of CMC
 was 0.47%, showing the accuracy of model prediction [49]. The predicted CMCs were
 within the 95% prediction intervals of HAs samples (Figure 3) that suggests predicted
 results were credible. The model proposed indicates that the hydrophobicity/hydrophilic-
 ity group and degree condensation of the HA molecule was the principal responsible for
 the CMC.

 Figure 3. Predicted CMC of HA sub-fractions versus their observed CMC of HAs isolated from
 biomass and soil with a 95% confidence interval.

 3.3. HA sub-fractions Zeta potential and size characteristic
 The value of the zeta potential (ζ) became more negative from -4.2 to -46.7 mV as the
 concentration of HA increased from 10 to 2000 mg·L-1 at pH = 6.86 (Figure S2). The nega-
 tive relationship between ζ and the concentration of HAs was also observed for Aldrich
 HA detected by Esfahani, et al. [32]. Previous researches documented that the colloidal
 was stability when ζ were less than -30 mV in an aqueous solution. The ζ less than -30
 indicated the stable colloidal at a concentration of 2000 mg·L-1 for HA sub-fraction at pH
 = 6.86. Therefore, the concentration of 2000 mg·L-1 was used to investigate the possible
 effects of pH and variation of PSDs for both HA and its sub-fractions. The ζ of HA and its
 sub-fractions ranged from -44.2 to -50.2 mV at pH 6.86 with concentration at 2000 mg/L,
 in order of HA1 > HA3 > HA2 > HA5 > HA6 > HA4. The ζ were significantly related to the
 content of carboxylic groups in HA and its sub-fractions (p < 0.20). The relationship be-
 tween ζ and the content of the carboxylic group was observed for HA derived from Ren-
 dzic Leptosol and Suwannee River HA from IHSS, indicating the carboxylic group was
 the main factor that controlled the surface charge of HA [50].
 The particle size of HA aggregation previously reported as Z-average diameter
 ranged from 108 to 187 nm for HA and its sub-fractions according to intensity-based PSDs.
 The range of Z-average sizes of HA sub-fractions was comparable to 185-280 nm of HA
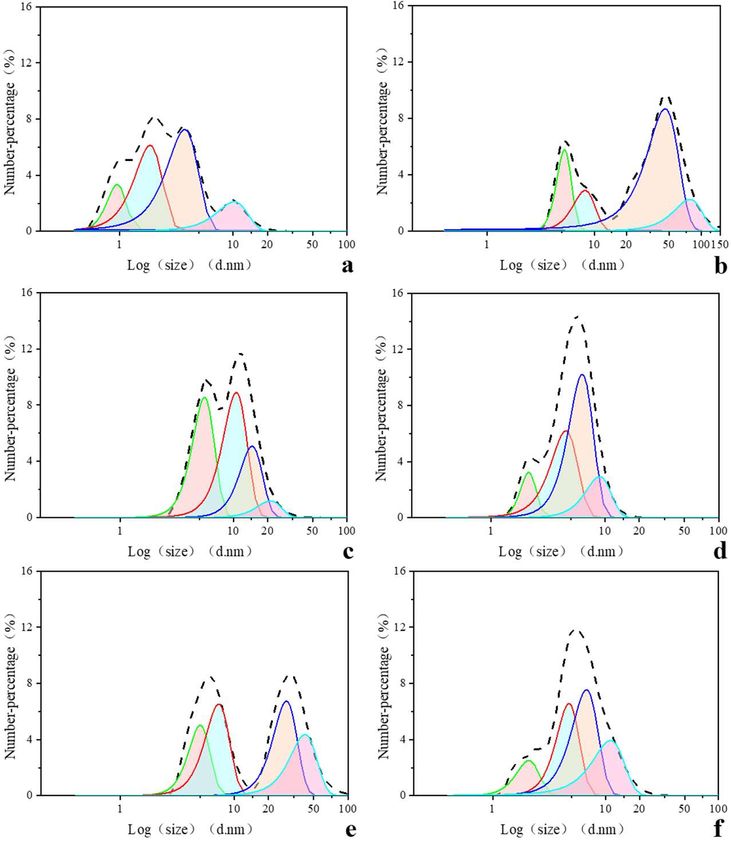
Preprints (www.preprints.org) | NOT PEER-REVIEWED | Posted: 29 June 2021 doi:10.20944/preprints202106.0702.v1

 derived from peat [35], Aldrich HA [32], and Suwannee River HA from IHSS [34]. Inten-
 sity-, volume-, and number-based PSDs were obtained for both HA and its subfractions
 by DLS. Three peaks were observed in intensity-based PSDs of HA and its sub-fractions,
 about 10 nm, 280 nm, and 5000 nm (Figure S3). The largest size of HA sub-fractions (~5000
 nm) was due to the abiotic self-assembled of HA molecules after filtered with 0.45 μm
 (equal to 450 nm) membrane (Figure S3-4). The larger aggregation for HA (more than 1000
 nm) was also reported by Esfahani, et al. [32], who observed the aggregation of Suwannee
 River HA from IHSS and Aldrich HA in intensity-based PSDs. In addition, the intensity
 based on Z-average diameter was comparable to other reports in the literature, while Z-
 average was based on a monomodal hypothesis that cannot fully reflect the truly poly-
 modal character of HA [32, 36, 51].

 Table 3. Assignments and relative area of Gaussian fitting peaks from number-based PSDs of HA sub-fractions with
 its Z-average size at concentrations of 2000 mg·L-1.

 Peak 1 W Percent Peak 2 W Percent Peak 3 W Percent Peak 4 W Percent
 (nm) (nm) (%) (nm) (nm) (%) (nm) (nm) (%) (nm) (nm) (%)
 HA1 1.0 0.44 3.30 1.9 1.23 16.85 3.8 2.75 44.69 10.2 7.44 35.16
 HA2 5.3 1.97 2.46 8.2 4.58 2.85 45.9 36.16 67.73 78.1 55.46 26.96
 HA3 5.6 2.91 18.60 10.6 6.08 40.37 14.6 7.93 30.29 21.1 12.36 11.00
 HA4 2.1 0.80 3.51 4.5 18.91 24.08 6.3 3.67 50.87 9.0 5.43 21.55
 HA5 5.0 2.58 4.90 7.3 4.20 10.36 28.7 16.18 41.18 41.8 26.47 43.56
 HA6 2.1 1.15 3.43 4.8 2.58 20.22 6.8 4.21 37.82 11.0 8.25 38.54
 W - the peak width at half-height;
 Peak - peak center location;
 Percent - peak area percentage.
Preprints (www.preprints.org) | NOT PEER-REVIEWED | Posted: 29 June 2021 doi:10.20944/preprints202106.0702.v1

 Figure 4. Gaussian fitting peaks of number PSDs of six sub-fractions for HA at concentrations of
 2000 mg·L-1 (a. HA1; b. HA2; c. HA3; d. HA4; e. HA5; f. HA6. ┄ measurement curve. ■ peak1; ■
 peak2; ■ peak3; ■ peak4).

 The number-base PSDs can reflect the aggregation distribution characteristics of HA
 sub-fractions. The size distributions of HA1-6 were 0.6-15.7 nm, 3.6-122 nm, 3.1-24.4 nm,
 1.5-13.5 nm, 3.1-68.1 nm, 1.3-18.2 nm, respectively according to number-based PSDs (Fig-
 ure 4). The size distributions of HA2 and HA5 were 3-5 times wider than that of other sub-
 fractions. The larger distributions were like to the complexity of HA structure of HA2 and
 HA5, which should be further studied in the future. Three peaks and a clear shoulder
 were observed in number-based PSDs of HA1 including the maximum peak (~2.0 nm)
 with shoulder (~1 nm), the second maximum peak (~3.6 nm), and the third maximum peak
 (~10.1 nm). Two peaks, the maximum peak (~5.6 nm) and the second maximum peak
 (~43.8 nm) were observed in number-based PSDs of HA2. Two primary peaks, the maxi-
 mum peak (~5.6 nm) and the second maximum peak (11.7 nm) were observed in number-
 based PSDs of HA3. One primary peak (~5.6 nm) with shoulder (~2.0 nm) was observed
 in number-based PSDs of HA4. Two primary peaks including the maximum peak (~32.7
 nm), the second maximum peak (~6.5 nm) were observed in number-based PSDs of HA5;
 One primary peak, maximum peak (~4.85 nm) that have a clear shoulder (~1.5 nm) were
 observed in number-based PSDs of HA6. Those shoulders were likely due to overlapping
 aggregation for HA1, HA4, and HA6 (Figure 4).
 Gaussian peak fitting was applied to identify the possible information of overlapping
 PSDs for both HA and its sub-fractions. The contributions of individual four peaks were
 identified in number-based PSD of HA sub-fractions using Gaussian peak fitting with R2
 ranged from 0.990 to 0.999. According to Gaussian peak fitting of number-based PSDs, six
 clusters of peaks center location were obtained for 2 ± 1 nm, 5 ± 2 nm, 10 ± 3 nm, 21 ± 8
Preprints (www.preprints.org) | NOT PEER-REVIEWED | Posted: 29 June 2021 doi:10.20944/preprints202106.0702.v1

 nm, 40 ± 10 nm, and > 50 nm (name as C1-6) for both HA and its sub-fractions. Four Gauss-
 ian peaks located in C1 including peak 1 of HA1 with a number percentage of 3.3%, peak
 2 of HA1 with number percentage of 16.85%, peak 1 of HA4 with number percentage of
 3.51%, peak 1 of HA6 with number percentage of 3.43%. Eight Gaussian peaks located in
 C2 including peak 1 of HA1 with number percentage of 44.69%, peak 1 of HA2 with num-
 ber percentage of 2.46%, peak 1 of HA3 with number percentage of 18.6%, peak 2 of HA4
 with number percentage of 24.08%, peak 3 of HA4 with number percentage of 50.87%,
 peak 1 of HA5 with number percentage of 4.90%, peak 2 of HA6 with number percentage
 of 20.22%, peak 3 of HA6 with number percentage of 67.82%. Six Gaussian peaks located
 in C3 including peak 4 of HA1 with number percentage of 35.16%, peak 2 of HA2 with
 number percentage of 2.85%, peak 2 of HA3 with number percentage of 40.37%, peak 4 of
 HA4 with number percentage of 21.55%, peak 2 of HA5 with number percentage of
 10.36%, peak 4 of HA6 with number percentage of 38.54%. Three Gaussian peaks located
 in C4 including peak 3 of HA3 with a number percentage of11.00%, peak 4 of HA3 with
 number percentage of 30.29%, peak 3 of HA5 with a number percentage of 41.18%. Two
 Gaussian peaks located in C5 including peak 3 of HA2 with a number percentage of
 67.73%, peak 4 of HA5 with number percentage of 43.56%. One Gaussian peak located in
 C6 including peak 4 of HA2 with a number percentage of 26.96% (Figure 4). The C2 (~5
 nm) has the maximum number percentage for Gaussian peak 33.92%, while C6 (~78 nm)
 has the minimum number percentage of 4.49%. According to previous studies, the aver-
 age size of HA is affected by cation concentration and type, pH, salinity, and residence
 time [36]. The HA sub-fractions represent different fractions of soil humic substances
 those have different structures. Therefore, the difference in the structure of HA sub-frac-
 tions may be the cause of difference on the Gaussian peaks of number-base PSDs, which
 need further study.
 The Gaussian peak with the maximum size appeared for 45.9 nm, and the minimum
 size appeared for 5.3 nm in number-based PSDs. The maximum value of peak width at
 half-height of Gaussian peak was observed from HA 2 with the width of 55.46 nm, and
 the highest Gaussian peak was observed for HA 2 with a number percentage of 67.73%.
 (Figure S5). A previous study reported that the hydrodynamic radii were related to mo-
 lecular mass according to the analysis of Aldrich HA and two other HSs derived from
 peat and compost with ultrafiltration combined with DLS [52]. The various distribution
 of Gaussian peaks should be attributed to the complex structure and complicated confor-
 mation of HA molecules.
 The maximum values of peak width at half-height were 7.44 nm (HA1), 55.46 nm
 (HA2), 12.36 nm (HA3), 18.91 nm (HA4), 26.47 nm (HA5), 8.25 nm (HA6), respectively.
 The full width at half maxima of HA2 and HA5 was greater than that of other HA sub-
 fractions (Figure. 4), it suggests the aggregate size distribution of HA2 and HA5 is more
 extensive wider than other HA sub-fractions. This may be due to the inconsistency of the
 components and structures of the HA sub-fractions, requiring further study.

 4. Conclusion

 The surface tension of HA and its sub-fractions reduced from 72.4 mN·m -1 to 36.8
 mN·m-1 with the increasing concentration from 0 to 2000 mg·L-1 with exponential model.
 The difference maximum surface tensions of HA sub-fractions may be due to it’s the con-
 tent of carbon atoms in a straight-chain hydrophobic group. The CMC of HA sub-fractions
 ranged from 216-1024 mg·L-1, fitting the new multiple linear regression equation to pre-
 dicted and analyzed CMC of HA. The updated multiple linear regression equation, CMC
 = 18896–6.9×C–296×alkyl C–331×aromatic C–17019×H/C+4054× HB/HI was documented to
 predicted CMC of HAs reported by previous researchers and HA subfractions. This
 model suggests that besides the hydrophilic/hydrophobic groups of HA, the degree of
 intermolecular condensation also has an important effect on the CMC of HA. The maxi-
 mum particle size was 5000 nm after filtered by a membrane with pore size of 450 nm,
 indicating HA and its sub-fractions could progressed self-assembly at pH 6.86. The main
 PSDs of soil HA aggregates was distributed in the region within 100 nm. The aggregate
Preprints (www.preprints.org) | NOT PEER-REVIEWED | Posted: 29 June 2021 doi:10.20944/preprints202106.0702.v1

 sizes of number-base PSDs were mainly in six clusters including 2 ± 1 nm, 5 ± 2 nm, 10 ±
 3 nm, 21 ± 8 nm, 40 ± 10 nm, and > 50 nm analyzed by Gaussian model. However, the
 micellar structure of HA sub-fractions aggregates is still not clearly understood, and fur-
 ther studies are required by experiment condition, such as temperature, pH etc. The pos-
 sible CMC prediction and aggregate size could be helpful to understand hyperfine struc-
 ture of HAs and the predict the environmental behaviors of HA in aquatic systems.

 Materials: The following are available online at www.mdpi.com/xxx/s1, Figure S1: title, Table S1:
 title, Video S1: title.
 Author Contributions: Conceptualization, BY; Methodology, BY, TS Validation, TS; Data Curation,
 TS, WX, LT, SF, HN; Writing – Original Draft Preparation, TS.; Writing – Review & Editing, BY, TW.
 Funding: This work was financially supported by the National Natural Science Foundation of China
 (Nos. 41703123), and the Fundamental Research Funds for the Central Public-interest Scientific In-
 stitution (No. 2019YSKY-006).
 Data Availability Statement: The data presented in this study are available upon request from the
 corresponding author.
 Institutional Review Board Statement: Informed consent was obtained from all subjects involved
 in the study.
 Informed Consent Statement: Not applicable.
 Conflicts of Interest: The authors declare no conflict of interest.
Preprints (www.preprints.org) | NOT PEER-REVIEWED | Posted: 29 June 2021 doi:10.20944/preprints202106.0702.v1

 Appendix A

 References
 1. Bai, Y.; Wu, F.; Xing, B.; Meng, W.; Shi, G.; Ma, Y.; Giesy, J. P., Isolation and characterization of Chinese standard fulvic acid sub-fractions
 separated from forest soil by stepwise elution with pyrophosphate buffer. Scientific Reports 2015, 5, 8723. https://doi.org/10.1038/srep08723.
 2. Li, T.; Song, F.; Zhang, J.; Liu, S.; Xing, B.; Bai, Y., Pyrolysis characteristics of soil humic substances using TG-FTIR-MS combined with
 kinetic models. Science of The Total Environment 2020, 698, 134237. https://doi.org/10.1016/j.scitotenv.2019.134237.
 3. Salati, S.; Papa, G.; Adani, F., Perspective on the use of humic acids from biomass as natural surfactants for industrial applications.
 Biotechnology Advances 2011, 29, (6), 913-22. https://doi.org/10.1016/j.biotechadv.2011.07.012.
 4. Guetzloff, T. F.; Rice, J. A., Does humic acid form a micelle? Science of the Total Environment 1994, 152, (1), 31-35.
 https://doi.org/10.1016/0048-9697(94)90548-7.
 5. Quadri, G.; Chen, X.; Jawitz, J. W.; Tambone, F.; Genevini, P.; Faoro, F.; Adani, F., Biobased surfactant-like molecules from organic wastes:
 the effect of waste composition and composting process on surfactant properties and on the ability to solubilize tetrachloroethene (PCE).
 Environmental Science & Technology 2008, 42, (7), 2618-2623. https://doi.org/10.1021/es702144t.
 6. Kerner, M.; Hohenberg, H.; Ertl, S.; Reckermann, M.; Spitzy, A., Self-organization of dissolved organic matter to micelle-like microparticles
 in river water. Nature 2003, 422, (6928), 150-154. https://doi.org/10.1038/nature01469.
 7. Quagliotto, P.; Montoneri, E.; Tambone, F.; Adani, F.; Gobetto, R.; Viscardi, G., Chemicals from wastes: compost-derived humic acid-like
 matter as surfactant. Environmental Science & Technology 2006, 40, (5), 1686-1692. https://doi.org/10.1021/es051637r.
 8. Sierra, M.; Rauen, T.; Tormen, L.; Debacher, N.; Soriano-Sierra, E., Evidence from surface tension and fluorescence data of a pyrene-
 assisted micelle-like assemblage of humic substances. Water Research 2005, 39, (16), 3811-3818.
 https://doi.org/10.1016/j.watres.2005.07.005.
 9. Ying, G., Fate, behavior and effects of surfactants and their degradation products in the environment. Environment International 2006, 32,
 (3), 417-431. https://doi.org/10.1016/j.envint.2005.07.004.
 10. Savarino, P.; Montoneri, E.; Biasizzo, M.; Quagliotto, P.; Viscardi, G.; Boffa, V., Upgrading biomass wastes in chemical technology. Humic
 acid‐like matter isolated from compost as chemical auxiliary for textile dyeing. Journal of Chemical Technology & Biotechnology:
 International Research in Process, Environmental & Clean Technology 2007, 82, (10), 939-948. https://doi.org/10.1002/jctb.1767.
 11. Schwitzguébel, J.-P.; Aubert, S.; Grosse, W.; Laturnus, F., Sulphonated Aromatic Pollutants: Limits of Microbial Degradability and Potential
 of Phytoremediation. Environmental Science & Pollution Research International 2002. https://doi.org/10.1007/BF02987317.
 12. Garcıa, M.; Ribosa, I.; Guindulain, T.; Sanchez-Leal, J.; Vives-Rego, J., Fate and effect of monoalkyl quaternary ammonium surfactants in
 the aquatic environment. Environmental Pollution 2001, 111, (1), 169-175. https://doi.org/10.1016/S0269-7491(99)00322-X.
 13. Diodovich, C.; Ferrario, D.; Casati, B.; Malerba, I.; Marafante, E.; Parent-Massin, D.; Gribaldo, L., Sensitivity of human cord blood cells to
 tetrachloroethylene: cellular and molecular endpoints. Archives of Toxicology 2005, 79, (9), 508-514. https://doi.org/10.1007/s00204-005-
 0662-8.
 14. Moran, M. J.; Zogorski, J. S.; Squillace, P. J., Chlorinated solvents in groundwater of the United States. Environmental Science & Technology
 2007, 41, (1), 74-81.
 15. Holmberg, K., Natural surfactants. Current Opinion in Colloid & Interface Science 2001, 6, (2), 148-159. https://doi.org/10.1016/S1359-
 0294(01)00074-7.
 16. Diallo, M. S.; Abriola, L. M.; Weber, W. J., Solubilization of nonaqueous phase liquid hydrocarbons in micellar solutions of dodecyl alcohol
 ethoxylates. Environmental Science & Technology 1994, 28, (11), 1829-1837. https://doi.org/10.1021/es00060a012.
 17. Das, P.; Mukherjee, S.; Sen, R., Improved bioavailability and biodegradation of a model polyaromatic hydrocarbon by a biosurfactant
 producing bacterium of marine origin. Chemosphere 2008, 72, (9), 1229-1234. https://doi.org/10.1016/j.chemosphere.2008.05.015.
 18. Ke, L.; Bao, W.; Chen, L.; Wong, Y. S.; Tam, N., Effects of humic acid on solubility and biodegradation of polycyclic aromatic hydrocarbons
 in liquid media and mangrove sediment slurries. Chemosphere 2009, 76, (8), 1102-1108. https://doi.org/10.1016/j.chemosphere.2009.04.022.
Preprints (www.preprints.org) | NOT PEER-REVIEWED | Posted: 29 June 2021 doi:10.20944/preprints202106.0702.v1

 19. Urdiales, C.; Sandoval, M. P.; Escudey, M.; Pizarro, C.; Knicker, H.; Reyes-Bozo, L.; Antilén, M., Surfactant properties of humic acids
 extracted from volcanic soils and their applicability in mineral flotation processes. Journal of Environmental Management 2018, 227, 117-
 123. https://doi.org/10.1016/j.jenvman.2018.08.072.
 20. Kawahigashi, M.; Fujitake, N., Surface-active properties of particle size fractions in two humic acids. Soil Science and Plant Nutrition 1998,
 44, (4), 497-505. https://doi.org/10.1134/S1061933X09050226.
 21. Rosen, M. J.; Kunjappu, J. T., Surfactants and interfacial phenomena. John Wiley & Sons: 2012.202-272
 22. Song, F.; Wu, F.; Feng, W.; Liu, S.; He, J.; Li, T.; Zhang, J.; Wu, A.; Amarasiriwardena, D.; Xing, B., Depth-dependent variations of
 dissolved organic matter composition and humification in a plateau lake using fluorescence spectroscopy. Chemosphere 2019, 225, 507-
 516. https://doi.org/10.1016/j.chemosphere.2019.03.089.
 23. Song, F.; Wu, F.; Guo, F.; Wang, H.; Feng, W.; Zhou, M.; Deng, Y.; Bai, Y.; Xing, B.; Giesy, J. P., Interactions between stepwise-eluted
 sub-fractions of fulvic acids and protons revealed by fluorescence titration combined with EEM-PARAFAC. Science of The Total
 Environment 2017, 605, 58-65. https://doi.org/10.1016/j.scitotenv.2017.06.164.
 24. Zhang, J.; Song, F.; Li, T.; Xie, K.; Yao, H.; Xing, B.; Li, Z.; Bai, Y., Simulated photo-degradation of dissolved organic matter in lakes
 revealed by three-dimensional excitation-emission matrix with regional integration and parallel factor analysis. Journal of Environmental
 Sciences 2020, (4). https://doi.org/10.1016/j.jes.2019.11.019.
 25. Myers, J. L.; Well, A.; Lorch, R. F., Research design and statistical analysis. Routledge: 2010;
 26. Aiken, L. S.; West, S. G.; Pitts, S. C.; Baraldi, A. N.; Wurpts, I. C., Multiple linear regression. Handbook of Psychology, Second Edition
 2012, 2. https://doi.org/10.1002/9781118133880.hop202018.
 27. Qian, X., Statistical Analysis and Evaluation of the Advanced Biomass and Natural Gas Co-Combustion Performance. 2019.
 28. Uyanık, G. K.; Güler, N., A study on multiple linear regression analysis. Procedia-Social and Behavioral Sciences 2013, 106, 234-240.
 https://doi.org/10.1016/j.sbspro.2013.12.027.
 29. Liang, Y.; Britt, D. W.; McLean, J. E.; Sorensen, D. L.; Sims, R. C., Humic acid effect on pyrene degradation: finding an optimal range for
 pyrene solubility and mineralization enhancement. Applied Microbiology and Biotechnology 2007, 74, (6), 1368-1375.
 https://doi.org/10.1007/s00253-006-0769-8.
 30. Adani, F.; Tambone, F.; Davoli, E.; Scaglia, B., Surfactant properties and tetrachloroethene (PCE) solubilisation ability of humic acid-like
 substances extracted from maize plant and from organic wastes: A comparative study. Chemosphere 2010, 78, (8), 1017-1022.
 https://doi.org/10.1016/j.chemosphere.2009.11.039.
 31. Allahbakhsh, A.; Bahramian, A. R., Self-assembly of graphene quantum dots into hydrogels and cryogels: Dynamic light scattering, UV–
 Vis spectroscopy and structural investigations. Journal of Molecular Liquids 2018, 265, 172-180.
 https://doi.org/10.1016/j.molliq.2018.05.123.
 32. Esfahani, M. R.; Stretz, H. A.; Wells, M. J., Abiotic reversible self-assembly of fulvic and humic acid aggregates in low electrolytic
 conductivity solutions by dynamic light scattering and zeta potential investigation. Science of the Total Environment 2015, 537, 81-92.
 https://doi.org/10.1016/j.scitotenv.2015.08.001.
 33. Braun, J.; Renggli, K.; Razumovitch, J.; Vebert, C., Dynamic light scattering in supramolecular materials chemistry. Supramolecular
 Chemistry: From Molecules to Nanomaterials 2012. https://doi.org/10.1002/9780470661345.smc039.
 34. Palmer, N. E.; von Wandruszka, R., Dynamic light scattering measurements of particle size development in aqueous humic materials.
 Fresenius' Journal of Analytical Chemistry 2001, 371, (7), 951-954. https://doi.org/10.1007/s002160101037.
 35. Pinheiro, J.; Mota, A.; d'Oliveira, J.; Martinho, J., Dynamic properties of humic matter by dynamic light scattering and voltammetry.
 Analytica Chimica Acta 1996, 329, (1-2), 15-24. https://doi.org/10.1016/0003-2670(96)00097-9.
 36. Baalousha, M.; Motelica-Heino, M.; Le Coustumer, P., Conformation and size of humic substances: Effects of major cation concentration
 and type, pH, salinity, and residence time. Colloids and Surfaces A: Physicochemical and Engineering Aspects 2006, 272, (1-2), 48-55.
 https://doi.org/10.1007/s002160101037.
Preprints (www.preprints.org) | NOT PEER-REVIEWED | Posted: 29 June 2021 doi:10.20944/preprints202106.0702.v1

 37. Liu, F.; Wei, X.; Xie, R.; Wang, Y.; Li, W.; Li, Z.; Li, P.; Zong, Z., Characterization of oxygen-containing species in methanolysis products
 of the extraction residue from Xianfeng lignite with negative-ion electrospray ionization Fourier transform ion cyclotron resonance mass
 spectrometry. Energy & Fuels 2014, 28, (9), 5596-5605. https://doi.org/10.1021/ef501414g.
 38. Liu, S. S.; Zhu, Y. R.; Liu, L. Z.; He, Z. Q.; Giesy, J. P.; Bai, Y. C.; Sun, F. H.; Wu, F. C., Cation-induced coagulation of aquatic plant-
 derived dissolved organic matter: Investigation by EEM-PARAFAC and FT-IR spectroscopy. Environmental Pollution 2018, 234, 726-734.
 https://doi.org/10.1016/j.envpol.2017.11.076.
 39. Song, F.; Wang, X.; Li, T.; Zhang, J.; Bai, Y.; Xing, B.; Giesy, J. P.; Wu, F., Spectroscopic analyses combined with Gaussian and Coats-
 Redfern models to investigate the characteristics and pyrolysis kinetics of sugarcane residue-derived biochars. Journal of Cleaner Production
 2019, 237, 117855. https://doi.org/10.1016/j.jclepro.2019.117855.
 40. Zhao, J.; Guo, Q.; Huang, W.; Zhang, T.; Wang, J.; Zhang, Y.; Huang, L.; Tang, Y., Shape Tuning and Size Prediction of Millimeter-Scale
 Calcium-Alginate Capsules with Aqueous Core. Polymers 2020, 12, (3), 688. https://doi.org/10.3390/polym12030688.
 41. Instruments, M., Zetasizer Nano Series User Manual-MAN0317 Issue 1.0. In Malvern Instruments Ltd., England, 2003.
 42. Fei, G.; Shuai, Q. A.; Lei, X. A.; Yb, A.; Bx, C., Thermal degradation features of soil humic acid sub-fractions in pyrolytic treatment and
 their relation to molecular signatures. Science of The Total Environment 2020, 749. https://doi.org/10.1016/j.scitotenv.2020.142318.
 43. Montoneri, E.; Boffa, V.; Quagliotto, P.; Mendichi, R.; Chierotti, M.; Roberto, G.; Medana, C., Humic acid-like matter isolated from green
 urban wastes. Part I: structure and surfactant properties. Bioresources 2008, 3, (1), 123-141. https://doi.org/10.1007/s00226-007-0175-0.
 44. Savarino, P.; Montoneri, E.; Musso, G.; Boffa, V., Biosurfactants from urban wastes for detergent formulation: surface activity and washing
 performance. Journal of Surfactants and Detergents 2010, 13, (1), 59. https://doi.org/10.1007/s11743-009-1133-7.
 45. Chilom, G.; Bruns, A. S.; Rice, J. A., Aggregation of humic acid in solution: Contributions of different fractions. Organic Geochemistry
 2009, 40, (4), 455-460. https://doi.org/10.1016/j.orggeochem.2009.01.010.
 46. Holger; Lippold; and; Uta; Gottschalch; and; Hermann; Kupsch, Joint influence of surfactants and humic matter on PAH solubility. Are
 mixed micelles formed? Chemosphere 2008, 70, (11), 1979-1986. https://doi.org/10.1016/j.chemosphere.2007.09.040.
 47. Hattori, K., Chemical and biological studies on environmental humic acidsI. Composition of elemental and functional groups of humic acids.
 Soil Science and Plant Nutrition 1988. https://doi.org/10.1080/00380768.1988.10416472.
 48. Dai, J. Y.; Ran, W.; Xing, B. S.; Gu, M.; Wang, L. S., Characterization of fulvic acid fractions obtained by sequential extractions with pH
 buffers, water, and ethanol from paddy soils. Geoderma 2006, 135, 284-295. https://doi.org/10.1016/j.geoderma.2006.01.003.
 49. Qian, X.; Lee, S.; Soto, A.-m.; Chen, G., Regression model to predict the higher heating value of poultry waste from proximate analysis.
 Resources 2018, 7, (3), 39. https://doi.org/10.3390/resources7030039.
 50. Jovanović, U. D.; Marković, M. M.; Cupać, S. B.; Tomić, Z. P., Soil humic acid aggregation by dynamic light scattering and laser Doppler
 electrophoresis. Journal of Plant Nutrition and Soil Science 2013, 176, (5), 674-679. https://doi.org/10.1002/jpln.201200346.
 51. Klučáková, M.; Věžníková, K., Micro-organization of humic acids in aqueous solutions. Journal of Molecular Structure 2017, 1144, 33-40.
 https://doi.org/10.1016/j.molstruc.2017.05.012.
 52. Baigorri, R.; Fuentes, M.; González-Gaitano, G.; García-Mina, J. M., Analysis of molecular aggregation in humic substances in solution.
 Colloids and Surfaces A: Physicochemical and Engineering Aspects 2007, 302, (1-3), 301-306.
 https://doi.org/10.1016/j.colsurfa.2007.02.048.
You can also read