Estimating submarine groundwater discharge in Jeju volcanic island (Korea) during a typhoon (Kong rey) using humic fluorescent dissolved organic ...
←
→
Page content transcription
If your browser does not render page correctly, please read the page content below
www.nature.com/scientificreports
OPEN Estimating submarine groundwater
discharge in Jeju volcanic
island (Korea) during a typhoon
(Kong‑rey) using humic‑fluorescent
dissolved organic matter‑Si mass
balance
Hyung‑Mi Cho1, Tae‑Hoon Kim2*, Jae‑Hong Moon3, Byung‑Chan Song3,
Dong‑Woon Hwang4, Taejin Kim5 & Dong‑Hoon Im4
We examined the residence time, seepage rate, and submarine groundwater discharge (SGD)-driven
dissolved nutrients and organic matter in Hwasun Bay, Jeju Island, Korea during the occurrence of
a typhoon, Kong-rey, using a humic fluorescent dissolved organic matter (FDOMH)-Si mass balance
model. The study period spanned October 4–10, 2018. One day after the typhoon, the residence
time and seepage rate were calculated to be 1 day and 0.51 m day−1, respectively, and the highest
SGD-driven fluxes of chemical constituents were estimated (1.7 × 10⁶ mol day−1 for dissolved
inorganic nitrogen, 0.1 × 10⁶ mol day−1 for dissolved inorganic phosphorus (DIP), 1.1 × 10⁶ mol day−1
for dissolved silicon, 0.5 × 10⁶ mol day−1 for dissolved organic carbon, 1.6 × 10⁶ mol day−1 for dissolved
organic nitrogen, 0.4 × 10⁶ mol day−1 for particulate organic carbon, and 38 × 106 g QS day−1 for
FDOMH). SGD-driven fluxes of dissolved nutrient and organic matter were over 90% of the total
input fluxes in Hwasun Bay. Our results highlight the potential of using the FDOMH-Si mass balance
model to effectively measure SGD within a specific area (i.e., volcanic islands) under specific weather
conditions (i.e., typhoon/storm). In oligotrophic oceanic regions, SGD-driven chemical fluxes from
highly permeable islands considerably contribute to coastal nutrient budgets and coastal biological
production.
Submarine groundwater discharge (SGD) comprises terrestrially derived fresh groundwater and re-circulated
seawater1–3. SGD can be affected by tidal pumping, wave set-up, currents, and density g radients4–6. In particu-
lar, under strong winds of 10 m s−1 (i.e., storms and typhoons), wave pumping rates can increase by orders of
magnitude exceeding the rates of fresh water inputs from runoff and SGD7. In volcanic islands, such as Hawaii
(USA), Jeju Island (Korea), and Mauritius, high rates of SGD occur owing to a high relief and permeability in
addition to poorly developed river drainage systems8–10.
SGD is an important pathway for transporting chemical constituents, such as dissolved organic matter
(DOM), nutrients, radionuclides, and trace elements to the coastal ocean on a regional scale11–15 as well as the
basin2,16 and global scales17. The chemical constituent fluxes via SGD are similar to or often much higher than
those through river discharge into the coastal ocean. SGD may play an especially important role in tropical islands
(e.g., Jeju Island, Hawaii, Mauritius, Balearic Islands) that are dominated by substantial precipitation and highly
permeable rocks13,18–21. For example, in Jeju island, SGD-driven fluxes of dissolved inorganic nitrogen (DIN)
and organic nitrogen (DON) in Hwasun Bay are larger than those through large rivers around the world, such as
1
Department of Ocean Sciences, Inha University, 100 Inha‑ro, Incheon 22212, Republic of Korea. 2Department
of Oceanography, Faculty of Earth Systems and Environmental Sciences, Chonnam National University,
Gwangju 61186, Republic of Korea. 3Department of Earth and Marine Sciences, Jeju National University,
Jeju 63243, Republic of Korea. 4Marine Environment Research Division, National Institute of Fisheries Science,
Busan 46083, Republic of Korea. 5Department of Oceanography, Pukyong National University, 45 Yongso‑ro,
Nam‑gu, Busan 48513, Republic of Korea. *email: thkim80@jnu.ac.kr
Scientific Reports | (2021) 11:941 | https://doi.org/10.1038/s41598-020-79381-0 1
Vol.:(0123456789)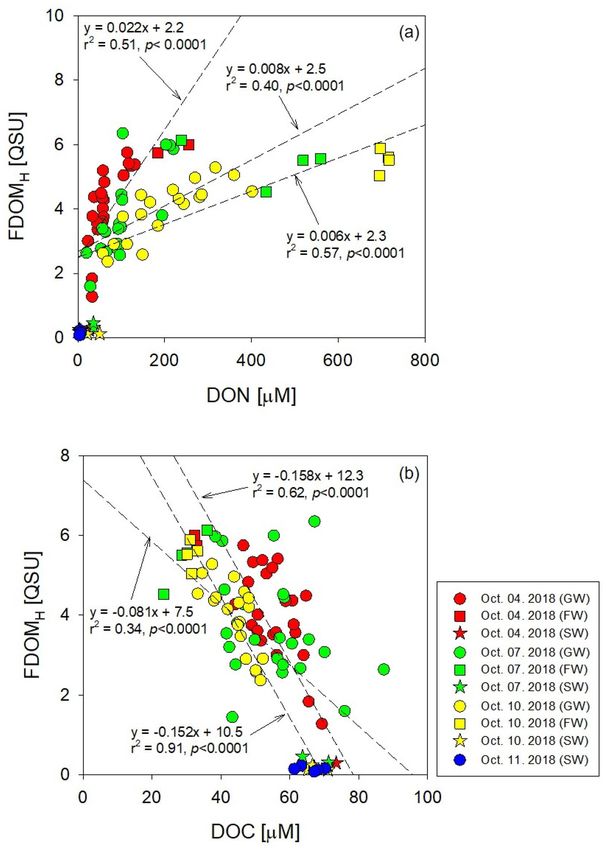
www.nature.com/scientificreports/
the Delaware, Colorado, and Stikine22. Excess nutrient inputs through SGD in Bangdu Bay and Jocheon harbor,
Jeju Island, have resulted in green tides of Ulva spp. (U. conglobata and U. pertusa)23–25.
SGD is an invisible phenomenon; therefore, direct estimation is difficult. Several studies have attempted to
measure SGD using hydrological processes26,27, seepage measurements4,9, and geochemical tracers such as Ra
isotopes2,3 and 222Rn5. In addition, dissolved silicon (DSi) can be used as a geochemical tracer for determining
SGD when it shows a conservative behavior in coastal aquifers28,29.
Fluorescent dissolved organic matter (FDOM), an active part of DOM absorbing ultraviolet and short visible
light, represents considerable portions of the DOM pool in land and coastal w ater30,31. According to its origin
and optical properties, there are mainly two types of FDOM, i.e., humic-like FDOM (FDOMH) and protein-like
FDOM (FDOMP), in coastal environments31. Recent studies show that SGD could be a hidden source of FDOM
in coastal oceans22,32 33. A previous study applied FDOM as a tracer owing to its spectral characteristics to identify
groundwater-driven DOM in the coral reefs of Hawaii34. In Jeju Island, SGD enhanced the inventory of FDOMH
in coastal seawater by 2–3 times; furthermore, F DOMH exhibits conservative behavior during all seasons32.
This study aimed to estimate SGD in a volcanic island, Jeju Island, using FDOMH and Si mass balance model
for the first time. Furthermore, it compares the SGD and the associated flux of nutrients and DOM before and
after a typhoon.
Results and discussion
Origin and behavior of nutrients and organic matter in Hwasun Bay during the typhoon. The
concentrations of DIN in the brackish groundwater of Hwasun Bay ranged from 30 to 280 μM on October 4
(avg.: 187 ± 78 μM, n = 27), 29 to 294 μM on October 7 (avg.: 160 ± 85 μM, n = 26), and 60 to 290 μM on October
10 (avg.: 196 ± 80 μM, n = 26), which were significantly higher than those in seawater (avg.: 2.9 ± 2.9 μM, n = 14)
but lower than those in fresh groundwater (avg.: 308 ± 9 μM, n = 10) (Supplementary Fig. S1a).
The concentrations of dissolved inorganic phosphorus (DIP) in the brackish groundwater of Hwasun Bay
ranged from 0.5 to 3.6 μM on October 4 (avg.: 1.1 ± 0.7 μM), 0.2 to 3.0 μM on October 7 (avg.: 1.1 ± 0.6 μM), and
0.1 to 2.4 μM on October 10 (avg.: 1.2 ± 0.6 μM), which were similar to those in seawater and fresh groundwater
after the typhoon (Supplementary Fig. S1b).
The concentrations of DSi in the brackish groundwater of Hwasun Bay ranged from 44 to 186 μM on October
4 (avg.: 102 ± 41 μM), 57 to 146 μM on October 7 (avg.: 98 ± 27 μM), and 83 to 319 μM on October 10 (avg.:
163 ± 78 μM), which were significantly higher than those in seawater (avg.: 6.5 ± 2.0 μM) but lower than those
in fresh groundwater (avg.: 226 ± 85 μM) (Supplementary Fig. S1c).
The concentrations of dissolved organic carbon (DOC) in the brackish groundwater of Hwasun Bay ranged
from 44 to 72 μM on October 4 (avg.: 57 ± 7 μM), 26 to 87 μM on October 7 (avg.: 53 ± 14 μM), and 33 to 54 μM
on October 10 (avg.: 45 ± 6 μM), which were significantly lower than those in seawater (avg.: 67 ± 4 μM) but
higher than those in fresh groundwater (avg.: 31 ± 3 μM) (Supplementary Fig. S1d).
The concentrations of DON in the brackish groundwater of Hwasun Bay ranged from 24 to 132 μM on Octo-
ber 4 (avg.: 63 ± 32 μM), 20 to 220 μM on October 7 (avg.: 105 ± 60 μM), and 58 to 402 μM on October 10 (avg.:
202 ± 95 μM), which were significantly higher than those in seawater (avg.: 12 ± 12 μM) but lower than those in
fresh groundwater (avg.: 502 ± 213 μM). DON concentrations in groundwater increased by more than 2 times
after the typhoon (Supplementary Fig. S1e).
The plots of DIN, DSi, DOC, and DON concentrations versus salinity show conservative mixing for salinity
ranging from 0 to 34 in Hwasun Bay (Fig. 1). These results indicate that the sink and source of nutrients and DOM
are negligible in this bay, perhaps owing to rapid seepage rates along the coast of Jeju Island (0.14–0.82 m day−1)9.
The concentrations of DIN, DIP, DSi, and DON were higher in groundwater than those in seawater, whereas DOC
concentrations were lower in groundwater than those in the bay seawater during all sampling periods (Fig. 1). In
addition, the average concentrations of DSi and DON in groundwater increased after the typhoon (Fig. 1). The
increase in DSi appears to be due to enhanced silicate weathering rates and DON appears to originate from the
soil matrix after typhoons. Previous studies reported that extreme weather, such as typhoon, induced mechanical
weathering and increased sediment and soil supply to c hannels35–37.
The FDOMH intensities in the brackish groundwater of Hwasun Bay ranged from 1.3 to 5.7 QSU on October 4
(avg.: 4.0 ± 1.1 QSU), 1.4 to 6.3 QSU on October 7 (avg.: 3.7 ± 1.3 QSU), and 2.4 to 5.3 QSU on October 10 (avg.:
3.9 ± 0.9 QSU), which were significantly higher than those in seawater (avg.: 0.2 ± 0.1 QSU) but lower than those
in fresh groundwater (avg.: 5.6 ± 0.5 QSU) (Supplementary Fig. S1g). The FDOMH intensities, indicating humic
sources such as terrestrial, anthropogenic, and agricultural sources31, decreased with increasing salinity in all
sampling campaigns (Fig. 2). However, in the high salinity zone, FDOMH showed deviations from the seawater
and the fresh groundwater mixing line in the subterranean estuary, which might be a result of infiltration and
transformation of marine organic matter in the beach sediments during tidal i nundation12,33. However, the non-
conservative FDOM behavior in this saline zone differs from the lower salinity zone where F DOMH generally
behaves conservatively. This conservative behavior is highly dependent on the balance between freshwater supply
rates and mixing relative to the biological production rate of FDOM.
FDOMH showed good positive correlations with DON (Fig. 3a) and good negative correlations with DOC
(Fig. 3b). Coble38 reported similar correlations between DOC and DON and peak C for the “humic-like” com-
ponent, which were observed in all seasons in Hwasun Bay22. These high concentrations of nutrients and DON
in groundwater can be mainly attributed to terrestrial sources, including agricultural activity or domestic waste-
water, whereas DOC showed positive correlations with salinity, implying a marine origin.
The concentrations of particulate organic carbon (POC) in the brackish groundwater of Hwasun Bay ranged
from 6.0 to 56 μM on October 4 (avg.: 21 ± 13 μM), 4 to 73 μM on October 7 (avg.: 31 ± 20 μM), and 5.0 to 40 μM
on October 10 (avg.: 20 ± 14 μM), which were lower than those in seawater (avg.: 36 ± 30 μM) but higher than
Scientific Reports | (2021) 11:941 | https://doi.org/10.1038/s41598-020-79381-0 2
Vol:.(1234567890)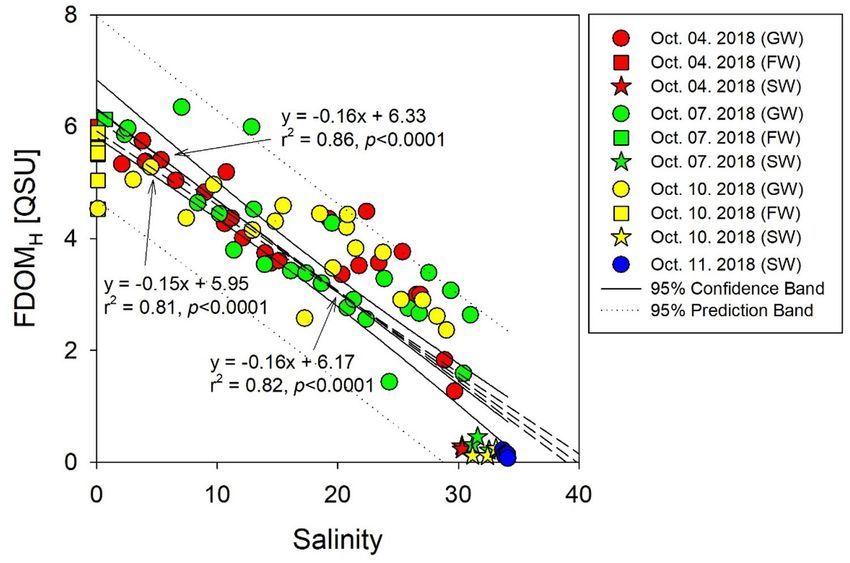
www.nature.com/scientificreports/

                                 Figure 1.  Scatter plots of (a) dissolved inorganic nitrogen (DIN), (b) dissolved inorganic phosphorus (DIP), (c)
                                 dissolved silicon (DSi), (d) dissolved organic carbon (DOC), and (e) nitrogen (DON) versus salinity in Hwasun
                                 Bay. Red, green, and yellow dots indicate samples collected on October 4, 2018 (before the typhoon), October 7,
                                 2018 (one day after the typhoon), and October 10, 2018 (4 days after the typhoon) in Hwasun Bay. This figure
                                 was drawn with sigma plot software (ver. 10.0).

Scientific Reports |   (2021) 11:941 |               https://doi.org/10.1038/s41598-020-79381-0                                                  3

                                                                                                                                           Vol.:(0123456789)
www.nature.com/scientificreports/
Figure 2. Correlation between humic-like fluorescent dissolved organic matter ( FDOMH) and salinity of
groundwater samples in Hwasun Bay during all sampling campaigns. The solid lines and dotted lines show the
95% confidence interval and 95% prediction interval for the regression line, respectively. This figure was drawn
with sigma plot software (ver. 10.0).
those in fresh groundwater (avg.: 11 ± 10 μM) except for one day after the typhoon. Exceptionally high concentra-
tions of POC in fresh groundwater were observed during the typhoon (avg: 83 ± 33 μM) (Supplementary Fig. S1f).
This result shows that short-term episodic storm events could increase current sediment delivery loads, thereby
increasing POC delivery in volcanic islands.
Estimating SGD in Hwasun Bay using FDOMH and Si mass balance models. Ra isotopes and
222
Rn have served as the most powerful tools for gauging the magnitude and mechanism of SGD because Ra
isotopes and 222Rn are chemically conservative in seawater and enriched in g roundwater2,39–41. Although it has
received less attention than radioisotope tracers, DSi is also a useful tracer for determining SGD when DSi is
highly enriched in fresh groundwater and it shows a conservative behavior in coastal a quifers28,29. In this study,
the concentrations of DSi in fresh groundwater showed the highest values in fresh groundwater samples and
exhibited good negative linear correlations with salinity. Thus, DSi is expected to be a good tracer for estimating
SGD flux.
In this study, we applied FDOMH as a tracer to estimate SGD flux. Although DOM characteristics vary
depending upon the various environments and FDOM is known to account for 20–70% of DOM (generally
represented by DOC), it has the highest values in coastal regions, where freshwater inputs are d ominant31. In this
study area, F
DOMH showed strong negative correlation with salinity and overwhelmed by the overall dilution of
the terrestrial F
DOMH relative to the internal production rate of FDOM. Thus, it has been used as a good SGD
tracer in areas with high SGD rate in volcanic i slands32,34. All previous studies conducted in Jeju Island consist-
ently showed good negative correlation between F DOMH and salinity22,32, which indicates apparent recalcitrant
FDOMH sources from terrestrial inputs. Thus, we assumed that terrestrial origin FDOMH behaves conservatively
in the subterranean estuary, and fresh groundwater flux was calculated using F DOMH as a tracer also with DSi.
In the steady state, the mass balance of FDOMH and Si could be expressed as follows:
FDOMH FDOMH FDOMH
FDiff + CGW × ABott × ψSGD − CEX × VS × Mix = 0 (1)
Si Si Si
FDiff + CGW × ABott × ψSGD − CEX × VS × Mix = 0 (2)
where the terms on the left side of the equation indicate input fluxes arising from diffusion from sediments
(first term) and submarine groundwater flow (second term) and mixing with open ocean water (third term).
The diffusion from sediments was calculated for an area (1.90 × 10⁷ m2) in Hwasun Bay via the regeneration
rates of F DOMH (1.4 × 10⁵ μg QS m−2 day−1) and Si (5 mmol m−2 day−1) in sediments42,43. SGD flux was calcu-
lated based on average concentrations of FDOMH (4.03 ± 1.13 g QS m−3 on October 4, 3.68 ± 1.34 g QS m−3 on
October 7, and 3.93 ± 0.89 g QS m−3 on October 10) and Si (102 ± 41 mmol m−3 on October 4, 98 ± 27 mmol m−3
Scientific Reports | (2021) 11:941 | https://doi.org/10.1038/s41598-020-79381-0 4
Vol:.(1234567890)www.nature.com/scientificreports/
Figure 3. Scatter plots of humic-like fluorescent dissolved organic matter (FDOMH) versus (a) dissolved
organic nitrogen (DON) and (b) carbon (DOC). This figure was drawn with sigma plot software (ver. 10.0).
on October 7, and 163 ± 78 mmol m−3 on October 10) in groundwater, an area of the bay, and the unknown
seepage rate of groundwater (m d ay−1).
Mixing with open ocean water was evaluated based on the differences in concentration between bay seawa-
ter and open ocean water for F DOMH (0.12 ± 0.06 g QS m −3 on October 4, 0.14 ± 0.12 g QS m
−3 on October 7,
and 0.08 ± 0.06 g QS m −3 on October 10) and Si (3 ± 2 mmol m−3 on October 4, 4 ± 1 mmol m−3 on October 7,
and 4 ± 2 mmol m−3 on October 10), the water volume of the bay, and the unknown exchange rate between bay
seawater and open ocean water.
We estimated the seepage rate of groundwater and water residence times simultaneously by solving Eqs. (1
and 2) for the unknown SGD (ΨSGD) terms and water residence time (T W = 1/λMix). The water residence time
and seepage rate of groundwater calculated using these simultaneous equations were 0.9, 1.0, and 1.0 days with
uncertainties of approximately 90% and 0.30, 0.51, and 0.26 m day−1 with uncertainties of approximately 105% on
October 4, 7, and 10, respectively. The large uncertainties show that the FDOMH deviations of both the seawater
Scientific Reports | (2021) 11:941 | https://doi.org/10.1038/s41598-020-79381-0 5
Vol.:(0123456789)www.nature.com/scientificreports/
Fluxes
× 106 mol day−1 × 10⁶ g QS d
ay−1
Sampling date SGD flux (× 10 m day )
6 3 −1
DIN DIP DSi DOC DON POC FDOMH
4th October, 2018 (before the typhoon) 5.7 1.1 0.07 0.5 0.3 0.4 0.1 24
7th October, 2018 (one day after the
9.7 1.7 0.1 1.1 0.5 1.6 0.4 38
typhoon)
10th October, 2018 (4 days after the
4.9 1.0 0.06 0.8 0.2 1.4 0.1 21
typhoon)
Table 1. Fluxes of dissolved inorganic nutrients and organic matter via SGD in Hwasun Bay of Jeju Island
during each sampling campaign. The calculated SGD-derived nutrient and organic matter fluxes have
combined uncertainties ranged from 110 to 125%.
and the freshwater end member mixing-line may not be determinant in this calculation. In addition, our estima-
tion already included the uncertainty of FDOMH intensities in groundwater samples. The water residence time
in this study was slightly lower than that (2.5 days) calculated using the tidal prism model, whereas the seepage
rate of groundwater in this study was relatively higher than that (0.12 m day−1) obtained using the 222Rn-Si mass
balance model13 although this study was conducted on the same survey area as that employed by Kim et al.13.
In general, the main driving forces of SGD were affected by hydraulic gradients between the land and ocean,
tidal and wave pumping, convection-driven processes, and precipitation1,5,44. In particular, during storms and
typhoons, wave pumping rates can increase by orders of magnitude exceeding the rates of fresh water inputs from
runoff and SGD7. According to the Korea Meteorological Administration (KMA, https://web.kma.go.kr/eng/
index.jsp), the amount of rainfall three days before each sampling campaign in Hwasun Bay was 3.4, 337, and
0 mm on October 4, 7, and 10, respectively. Thus, the difference in the seepage rate of groundwater appears to be
associated with heavy rainfall and wave pumping arising from the typhoon and/or the uncertainties associated
with different methods. Previous studies have reported that there were approximately 50% to > 100% uncertainties
associated with SGD estimation using 222Rn and Ra tracers45–47 owing to the natural variability of isotope tracers
in the groundwater endmember and loss by mixing with outer-bay water in coastal regions.
SGD‑driven nutrient and organic matter fluxes in Hwasun Bay. The SGD-driven fluxes of DIN,
DIP, DSi, DOC, DON, POC, and FDOMH were calculated by multiplying the average concentration with uncer-
tainty in groundwater by the SGD (5.7 × 10⁶ m3 day−1 on October 4, 9.7 × 10⁶ m3 day−1 on October 7, and 4.9 × 10⁶
m3 day−1 on October 10 with combined uncertainties of 105%) using the F DOMH-Si mass balance model for
Hwasun Bay (Table 1). In this calculation, DIP showed non-conservative behavior and determined which con-
centrations were highly dispersed with the highest uncertainties (~ 57%). The highest SGD-driven fluxes of nutri-
ents and DOM were obtained one day after the typhoon and were higher than those (0.3 × 10⁶ mol day−1 for DIN,
0.003 × 10⁶ mol day−1 for DIP, 0.2 × 10⁶ mol day−1 for DSi, 0.1 × 10⁶ mol day−1 for DOC, and 0.1 × 10⁶ mol day−1
for DON) reported by Kim et al.13 and Kim et al.22.
The input fluxes of nutrients can be attributed to diffusion from bottom sediments as well as SGD in Hwasun
Bay. The diffusion fluxes of DIN, DIP, DSi, DOC, and DON from bottom sediments were calculated by multiply-
ing the area of Hwasun Bay by the previously reported rates of regeneration of nutrients and diffusive DOM fluxes
from bottom s ediments42,48–50. The estimated diffusion fluxes of DIN, DIP, DSi, DOC, and DON from bottom
sediments were approximately 0.03 × 10⁶, 0.01 × 10⁶, 0.10 × 10⁶, 0.04 × 10⁶, and 0.004 × 10⁶ mol day−1, respectively.
The fluxes of DIN, DIP, DSi, DOC, and DON through SGD, based on the overall nutrient fluxes into the bay,
contribute approximately 98%, 88%, 89%, 89%, and 100% of the total fluxes, respectively. Thus, SGD appears to
be an important pathway as a nutrient and DOM source in Hwasun Bay.
The fluxes of DOC through SGD in Hwasun Bay were one order of magnitude higher than diffusion fluxes
of DOC and higher than the fluxes of POC through SGD (Table 1). This result indicates that SGD-derived DOC
in Hwasun Bay could be the most important source of carbon. However, in situ production by biological activi-
ties rather than by SGD in this bay may play an important role in determining the carbon budget, which can be
confirmed by the concentrations of DOC in groundwater being lower than those in the bay seawater and the
negative correlations between DOC and F DOMH (Fig. 3b).
The fluxes of FDOMH through SGD (24 × 106 g QS d ay−1 on October 4, 38 × 106 g QS day−1 on October 7, and
21 × 106 g QS d ay−1 on October 10 with combined uncertainties of ~ 110%; Table 1) in Hwasun Bay were one
order of magnitude higher than the diffusion fluxes of FDOMH and two orders of magnitude higher than those
in Jochun B ay32 (northern part of Jeju Island; 0.1 ~ 0.4 × 10⁶ g QS d ay−1) owing to the relatively low SGD flux
(4.1–6.9 × 10⁴ m3 day−1), calculated using the 222Rn mass balance model25. The fluxes of FDOMH through SGD
into the bay contribute approximately 80% of the total input fluxes. These results highlight the possibility of SGD
being an important hidden source of F DOMH in the volcanic island. In oligotrophic oceanic regions, coral reefs
are highly productive ecosystems that should be protected from the damaging effects of solar UV radiation51.
Thus, SGD-derived F DOMH could be beneficial to the sustenance of coral ecosystems considering their ability
to protect coral reefs from bleaching under harmful UV radiation in surface w ater51,52. In the last three decades,
seaweeds have replaced corals, leading to the global decline of coral reefs in association with ocean acidifica-
tion and changing nutrient d ynamics53. However, high loads of F DOMH arising from SGD provides favorable
conditions for coral ecology.
Scientific Reports | (2021) 11:941 | https://doi.org/10.1038/s41598-020-79381-0 6
Vol:.(1234567890)www.nature.com/scientificreports/
Conclusions
The seepage rate of groundwater estimated using an F DOMH-Si mass balance model was approximately 2–4
times higher than that estimated using the 222Rn mass balance model reported by Kim et al.13. This difference
may be attributable to the high level of rainfall and wave pumping owing to the typhoon rather than uncertain-
ties associated with the use of each method. Owing to its several advantages, including relative simplicity, low
cost, chemical conservativeness in seawater, and enrichment in groundwater relative to seawater, the FDOMH-Si
mass balance model can be effective for estimating SGD in coastal areas of a highly permeable zone without any
continuous river or stream discharge. The larger SGD-driven nutrient, DOM, and FDOMH fluxes in Hwasun
Bay during typhoons could play an important role in biogeochemistry linked to oceanic production and carbon
fluxes. Nevertheless, more extensive observations are necessary to evaluate SGD and nutrient fluxes through
SGD depending on geophysical processes.
Materials and methods
Study area and typhoon information. Jeju Island, a volcanic island (area of ~ 1830 km2), is located in
the southern sea of Korea and has a shield volcano named Mountain Halla, with an elevation of 1950 m. The
island is composed mainly of basaltic rocks formed by Cenozoic volcanism. Therefore, although it experiences
high rainfall (1140–1960 mm year−1)54,55, sustained stream flow is rare. According to hydrologic budget analyses,
approximately 50% of the total precipitation (1.5 × 10⁹ m3 year−1) contributes to groundwater recharge54,56.
The study site, Hwasun Bay (area of ~ 19 km2 and a mean depth of ~ 13 m), is located in the southwestern
part of Jeju Island. The residence time of bay seawater, estimated by the tidal prism method, is approximately
2.5 days13. With the absence of continuous rivers or stream discharge into the bay, SGD plays a dominant role in
the transport of terrestrial nutrients, DOM, and trace elements to the o cean13,21–23,57,58.
Typhoon Kong-rey, the 25th typhoon of the year, occurred on 28 September 2018. When the typhoon
approached Jeju Island on October 6, it was categorized as a medium-scale typhoon with a central pressure of
975 hPa, maximum wind speed of 32 m/s, and strong wind radius of 350 km; furthermore, it had a cumulative
precipitation reaching 718.5 mm (KMA, https://web.kma.go.kr/eng/index.jsp).
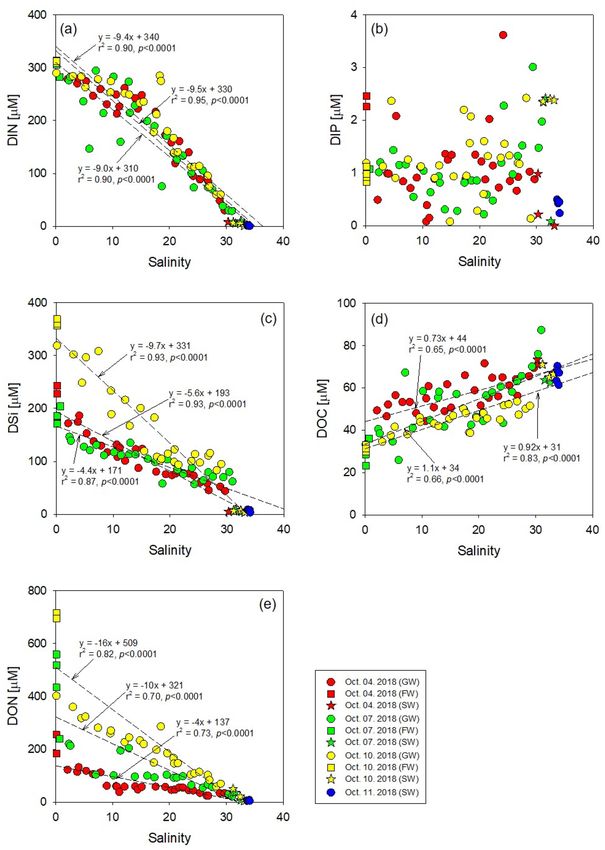
Sampling. Samples of fresh groundwater, brackish groundwater, and coastal seawater of the inner bay (S1,
S2, and S3) were collected on October 4 (before the typhoon), October 7 (one day after the typhoon), and Octo-
ber 10 (4 days after the typhoon) in 2018 in Hwasun Bay to analyze dissolved inorganic nutrients (NO3−, NO2−,
NH4+, Si(OH)4, and PO43−), DOC and DON, and FDOM (Fig. 4). Seawater samples from the outer bay were
collected from five stations (S4–S8) on October 11, 2018 because sampling surveys could not be conducted in
the outer bay during the sampling period because of the typhoon. Fresh groundwater samples were collected
from groundwater wells along the coastline. Brackish groundwater samples were collected from shallow pits dug
into nearshore sandy sediments above porous basaltic rocks. Seawater samples from the inner bay were collected
in the low-tide line using a plastic beaker. Seawater samples from the outer bay were collected in Niskin bottles
attached to a CTD rosette on the R/V A-Ra of Jeju National University, Korea.
Water samples for FDOM, DOC, total dissolved nitrogen (TDN), and dissolved nutrients analyses were col-
lected and filtered immediately in the field using a Whatman 0.7 μm disposable syringe filter. FDOM samples
were stored in pre-combusted amber glass vials and kept refrigerated (< 4 °C) until analysis. The subsamples
for DOC and TDN were transferred into pre-combusted glass ampoules (in the furnace at 500 °C for 4 h) and
acidified with 6 M HCl (pH ~ 2); the ampoules were then flame sealed. The subsamples for dissolved inorganic
nutrients were stored in HDPE bottles (Nalgene) and frozen until analysis. Samples for POC were collected in
1-L of HDPE bottle and were filtered through a 0.7 μm GF/F filter. The filter papers were placed in a petri dish
and frozen for storage.
Analytical methods. Salinity was measured in situ using an YSI Pro Series conductivity probe. Fluores-
cence measurements of FDOM were conducted using a spectrofluorometer (SCINCO FluoroMate FS-2) in the
scan mode. Emission (Em) spectra (250–500 nm) were collected at 2 nm intervals at excitation (Ex) wavelengths
of 250–360 nm (5 nm intervals). Water Raman scattering was eliminated by subtracting the daily fresh distilled
water signals from the sample data. Data intensities, obtained in counts per second (cps), were normalized with
quinine sulfate standards (fluorescence spectra of quinine sulfate standard solution in 0.1 N H
2SO4 at Ex/Em of
350/450 nm) and expressed as parts per billion of quinine sulfate equivalents (ppb QSE). Excitation-emission
matrices (EEMs) for all data with smoothing were obtained using MATLAB with Savitzky-Goray filters. The
PARAFAC model was applied to our 3D EEMS data and validated using split-half analysis and core consistency
test59. Three components were statistically identified as component 1 ( Exmax/Emmax = 300/370 nm), component 2
(Exmax/Emmax = 315/340 nm), and component 3 ( Exmax/Emmax = 340/428 nm) (Supplementary Fig. S2). Accord-
ing to Coble31, component 1 and 3 are indicative of marine FDOMH (peak M) and terrestrial FDOMH (peak C),
respectively, and component 2 is found to be a FDOMP (peak T).
Inorganic nutrients, including NO3−, NO2−, NH4+, Si(OH)4, and PO43− were analyzed using a nutrient auto-
analyzer (Alliance Instruments, FUTURA II +). In this study, we define DIN as the sum of N O3−, NO2−, and N
H4+.
Artificial seawater (salinity: 35) was used as the matrix for the blank and standard. The analytical uncertain-
ties were within 2% for DIN, DIP, and DSi according to certified reference materials (MOOS-1 from National
Research Council, Canada and DSR from University of Miami, USA).
DOC and TDN concentrations were analyzed using a TOC-VCPH analyzer (Shimadzu, Japan). Based on the
calibration curves of acetanilide (C:N = 8), DOC and TDN measurements were standardized. The measured val-
ues of 44 μmol L−1 for DOC (n = 6) and were 32 μmol L−1 for TDN (n = 6) agreed well within 5% for the certified
values. DON concentrations were calculated by subtracting the DIN concentrations from TDN concentrations.
Scientific Reports | (2021) 11:941 | https://doi.org/10.1038/s41598-020-79381-0 7
Vol.:(0123456789)www.nature.com/scientificreports/
Figure 4. A map showing the study site, Hwasun Bay of Jeju Island, and sampling locations of seawater (circle)
and groundwater (triangle) in October 2018. This figure was drawn using Adobe Illustrator Version 24.1.3.
Prior to analyzing POC, filter papers were dried at 50 °C for 12 h to remove moisture from the filter paper.
Then, acid fumigation was conducted with HCl for 12 h in a desiccator to remove inorganic carbon. POC con-
centration was measured using a Thermo Scientific Flash 2000 element analyzer.
Received: 27 July 2020; Accepted: 8 December 2020
References
1. Burnett, W. C., Bokuniewicz, H., Huettel, M., Moore, W. S. & Taniguchi, M. Groundwater and pore water inputs to the coastal
zone. Biogeochemistry 66, 3–33. https://doi.org/10.1023/B:BIOG.0000006066.21240.53 (2003).
2. Kim, G., Ryu, J. W., Yang, H. S. & Yun, S. T. Submarine groundwater discharge (SGD) into the Yellow Sea revealed by 228Ra and 226Ra
isotopes: Implications for global silicate fluxes. Earth Planet. Sci. Lett. 237(1–2), 156–166. https: //doi.org/10.1016/j.epsl.2005.06.011
(2005).
3. Moore, W. S., Sarmiento, J. L. & Key, R. M. Submarine groundwater discharge revealed by 228Ra distribution in the upper Atlantic
Ocean. Nat. Geosci. 1, 309–311. https://doi.org/10.1038/ngeo183 (2008).
4. Taniguchi, M. Tidal effects on submarine groundwater discharge into the ocean. Geophys. Res. Lett. https: //doi.org/10.1029/2002G
L014987 (2002).
5. Kim, G. & Hwang, D. Tidal pumping of groundwater into the coastal ocean revealed from submarine 222Rn and CH4 monitoring.
Geophys. Res. Lett. 29(14), 1678. https://doi.org/10.1029/2002GL015093 (2002).
6. Taniguchi, M. et al. Submarine groundwater discharge: Updates on its measurement techniques, geophysical drivers magnitudes
and effects. Front. Environ. Sci. 7, 141. https://doi.org/10.3389/fenvs.2019.00141 (2019).
7. Sawyer, A. H., Shi, F., Kirby, J. T. & Michael, H. A. Dynamic response of surface water-groundwater exchange to currents, tides,
and waves in a shallow estuary. J. Geophys. Res. Oceans 118(4), 1749–1758. https://doi.org/10.1002/jgrc.20154 (2013).
8. Garrison, G. H., Glenn, C. R. & McMurtry, G. M. Measurement of submarine groundwater discharge in Kahana Bay, O’ahu Hawai’i.
Limnol. Oceanogr. 48(2), 920–928. https://doi.org/10.4319/lo.2003.48.2.0920 (2003).
Scientific Reports | (2021) 11:941 | https://doi.org/10.1038/s41598-020-79381-0 8
Vol:.(1234567890)www.nature.com/scientificreports/
9. Kim, G., Lee, K.-K., Park, K.-S., Hwang, D.-W. & Yang, H.-S. Large submarine groundwater discharge (SGD) from a volcanic
island. Geophys. Res. Lett. 30(21), 2098. https://doi.org/10.1029/2003GL018378 (2003).
10. Povinec, P. P. et al. Isotopic, geophysical and biogeochemical investigation of submarine groundwater discharge: IAEA-UNESCO
intercomparison exercise at Mauritius Island. J. Environ. Radioact. 104, 24–45. https: //doi.org/10.1016/j.jenvra d.2011.09.009 (2012).
11. Burnett, W. C. et al. Groundwater-derived nutrient inputs to the upper Gulf of Thailand. Cont. Shelf Res. 27, 176–190. https://doi.
org/10.1016/j.csr.2006.09.006 (2007).
12. Santos, I. R., Burnett, W. C., Dittmar, T., Suryaputra, I. G. N. A. & Chanton, J. Tidal pumping drives nutrient and dissolved organic
matter dynamics in a Gulf of Mexico subterranean estuary. Geochim. Cosmochim. Ac. 73, 1325–1339. https://doi.org/10.1016/j.
gca.2008.11.029 (2009).
13. Kim, G., Kim, J. S. & Hwang, D. W. Submarine groundwater discharge from oceanic islands standing in oligotrophic oceans:
Implications for global biological production and organic carbon fluxes. Limnol. Oceanogr. 56, 673–682. https://doi.org/10.4319/
lo.2011.56.2.0673 (2011).
14. Beck, A. J. et al. Importance of geochemical transformations in determining submarine groundwater discharge-derived trace metal
and nutrient fluxes. Appl. Geochem. 22, 477–490. https://doi.org/10.1016/j.apgeochem.2006.10.005 (2007).
15. Charette, M. A. & Sholkovitz, E. R. Oxidative precipitation of groundwater-derived ferrous iron in the subterranean estuary of a
coastal bay. Geophys. Res. Lett. 29(10), 851–854. https://doi.org/10.1029/2001GL014512 (2002).
16. Rodellas, V., Garcia-Orellana, J., Masqué, P., Feldman, M. & Weinstein, Y. Submarine groundwater discharge as a major source
of nutrients to the Mediterranean Sea. Proc. Natl. Acad. Sci. USA 112(13), 3926–3930. https://doi.org/10.1073/pnas.1419049112
(2015).
17. Cho, H.-M. et al. Radium tracing nutrient inputs through submarine groundwater discharge in the global ocean. Sci. Rep. 8, 2439.
https://doi.org/10.1038/s41598-018-20806-2 (2018).
18. Basterretxea, G. et al. Submarine groundwater discharge to the coastal environment of a Mediterranean island (Majorca, Spain):
Ecosystem and biogeochemical significance. Ecosystems 13(5), 629–643. https://doi.org/10.1007/s10021-010-9334-5 (2010).
19. Povinec, P. P. et al. Isotopic, geophysical and biogeochemical investigation of submarine groundwater discharge: IAEA-UNESCO
intercomparison exercise at Mauritius Island. J. Environ. Radioactiv. 104, 24–45. https://doi.org/10.1016/j.jenvrad.2011.09.009
(2012).
20. Moosdorf, N., Stieglitz, T., Waska, H., Dürr, H. H. & Hartmann, J. Submarine groundwater discharge from tropical islands: A
review. Grundwasser 20(1), 53–67. https://doi.org/10.1007/s00767-014-0275-3 (2015).
21. Cho, H.-M. & Kim, G. Large temporal changes in contributions of groundwater-borne nutrients to coastal waters off a volcanic
island. Ocean. Sci. J. 52(3), 337–344. https://doi.org/10.1007/s12601-017-0033-4 (2017).
22. Kim, T. H., Kwon, E., Kim, I., Lee, S. A. & Kim, G. Dissolved organic matter in the subterranean estuary of a volcanic island Jeju:
Importance of dissolved organic nitrogen fluxes to the ocean. J. Sea Res. 78, 18–24. https://doi.org/10.1016/j.seares.2012.12.009
(2013).
23. Hwang, D. W., Lee, Y. W. & Kim, G. Large submarine groundwater discharge and benthic eutrophication in Bangdu Bay on volcanic
Jeju Island, Korea. Limnol. Oceanogr. 50, 1393–1403. https://doi.org/10.4319/lo.2005.50.5.1393 (2005).
24. Cho, H.-M., Kim, G. & Shin, K.-H. Tracing nitrogen sources fueling coastal green tides off a volcanic island using radon and
nitrogen isotopic tracers. Sci. Total Environ. 665, 913–919. https://doi.org/10.1016/j.scitotenv.2019.02.212 (2019).
25. Kwon, H. K., Kang, H., Oh, Y. H., Park, S. R. & Kim, G. Green tide development associated with submarine groundwater discharge
in a coastal harbor, Jeju, Korea. Sci. Rep. 7, 6325. https://doi.org/10.1038/s41598-017-06711-0 (2017).
26. Cherkauer, D. S. & Taylor, R. W. The spatially continuous determination of groundwater flow to surface water bodies: application
to the connecting channels between Lakes Huron and Erie. J. Hydrol. 114, 349–369. https://doi.org/10.1016/0022-1694(90)90065
-6 (1990).
27. Oberdorfer, J. A., Valentino, M. A. & Smith, S. B. Groundwater contribution to the nutrient budget of Tomales Bay, California.
Biogeochemistry 10, 199–216. https://doi.org/10.1007/BF00003144 (1990).
28. Kim, G. & Swarzenski, P. W. Submarine groundwater discharge (SGD) and associated nutrient fluxes to the coastal ocean. In
Carbon and Nutrient Fluxes in Continental Margins (eds Liu, K.-K. et al.) 529–538 (Springer, Berlin, 2010).
29. Oehler, T. et al. DSi as a tracer for submarine groundwater discharge. Front. Mar. Sci. 6, 563. https://doi.org/10.3389/fmars
.2019.00563(2019).
30. Kirk, J. T. O. Adsorption of light within the aquatic medium. In Light and Photosynthesis in Aquatic Ecosystems 3rd edn 70–82
(Cambridge University Press, Cambridge, 2011).
31. Coble, P. G. Marine Optical Biogeochemistry: The chemistry of ocean color. Chem. Rev. 107, 402–418. https://doi.org/10.1021/
cr050350+ (2007).
32. Kim, J. & Kim, G. Inputs of humic fluorescent dissolved organic matter via submarine groundwater discharge to coastal waters off
a volcanic island (Jeju, Korea). Sci. Rep. 7(1), 1–9. https://doi.org/10.1038/s41598-017-08518-5 (2017).
33. Suryaputra, I. G., Santos, I. R., Huettel, M., Burnett, W. C. & Dittmar, T. Non-conservative behavior of fluorescent dissolved organic
matter (FDOM) within a subterranean estuary. Cont. Shelf Res. 110, 183–190. https://doi.org/10.1016/j.csr.2015.10.011 (2015).
34. Nelson, C. E. et al. Fluorescent dissolved organic matter as a multivariate biogeochemical tracer of submarine groundwater dis-
charge in coral reef ecosystems. Mar. Chem. 177, 232–243. https://doi.org/10.1016/j.marchem.2015.06.026 (2015).
35. Hilton, R. G. et al. Tropical-cyclone-driven erosion of the terrestrial biosphere from mountains. Nat. Geosci. 1(11), 759–762 (2008).
36. Dadson, S. J. et al. Links between erosion, runoff variability and seismicity in the Taiwan orogen. Nature 426(6967), 648–651. https
://doi.org/10.1038/nature02150 (2003).
37. Milliman, J. D. & Kao, S. J. Hyperpycnal discharge of fluvial sediment to the ocean: impact of super-typhoon Herb (1996) on
Taiwanese rivers. J. Geol. 113(5), 503–516 (2005).
38. Coble, P. G. Characterization of marine and terrestrial DOM in seawater using excitation–emission matrix spectroscopy. Mar.
Chem. 51, 325–346 (1996).
39. Moore, W. S. Large groundwater inputs to coastal waters revealed by 226Ra enrichments. Nature 380, 612–614. https://doi.
org/10.1038/380612a0 (1996).
40. Charette, M. A., Buesseler, K. O. & Andrews, J. E. Utility of radium isotopes for evaluating the input and transport of groundwater-
derived nitrogen to a Cape Cod estuary. Limnol. Oceanogr. 46, 456–470. https://doi.org/10.4319/lo.2001.46.2.0465 (2001).
41. Cho, H. M. & Kim, G. Determining groundwater Ra end-member values for the estimation of the magnitude of submarine ground-
water discharge using Ra isotope tracers. Geophys. Res. Lett. 43(8), 3865–3871. https://doi.org/10.1002/2016GL068805 (2016).
42. Jung, H. Y. & Cho, K. J. SOD and inorganic nutrient fluxes from sediment in the downstream of the Nagdong River. Korean J. Ecol.
Environ. 36, 322–335 (2003).
43. Kim, J., Cho, H. M. & Kim, G. Significant production of humic fluorescent dissolved organic matter in the continental shelf waters
of the northwestern Pacific Ocean. Sci. Rep. 8(1), 1–8. https://doi.org/10.1038/s41598-018-23299-1 (2018).
44. Simmons, G. M. Jr. Importance of SGD (SGWD) and seawater cycling to material flux across sediment/water interfaces in marine
environments. Mar. Ecol. 84, 173–184 (1992).
45. Burnett, W. C., Peterson, R., Moore, W. S. & de Oliveira, J. Radon and radium isotopes as tracers of submarine groundwater dis-
charge—results from the Ubatuba, Brazil SGD assessment intercomparison. Estuar. Coast. Shelf Sci. 76(3), 501–511. https://doi.
org/10.1016/j.ecss.2007.07.027 (2008).
Scientific Reports | (2021) 11:941 | https://doi.org/10.1038/s41598-020-79381-0 9
Vol.:(0123456789)www.nature.com/scientificreports/
46. Lee, Y. W., Hwang, D. W., Kim, G., Lee, W. C. & Oh, H. T. Nutrient inputs from submarine groundwater discharge (SGD) in
Masan Bay, an embayment surrounded by heavily industrialized cities, Korea. Sci. Total Environ. 407(9), 3181–3188. https://doi.
org/10.1016/j.scitotenv.2008.04.013 (2009).
47. Su, N., Du, J., Moore, W. S., Liu, S. & Zhang, J. An examination of groundwater discharge and the associated nutrient fluxes into
the estuaries of eastern Hainan Island, China using 226Ra. Sci. Total Environ. 409(19), 3909–3918. https://doi.org/10.1016/j.scito
tenv.2011.06.017 (2011).
48. Kim, D. H. & Park, C. K. Estimation of nutrients released from sediments of Deukryang Bay. J. Korean Environ. Sci. Soc. 7, 425–431
(1998).
49. Maher, D. & Eyre, B. D. Insights into estuarine benthic dissolved organic carbon (DOC) dynamics using δ13C-DOC values, phos-
pholipid fatty acids and dissolved organic nutrient fluxes. Geochim. Cosmochim. Ac. 75(7), 1889–1902. https://doi.org/10.1016/j.
gca.2011.01.007 (2011).
50. Tyler, A. C., McGlathery, K. J. & Anderson, I. C. Macroalgae mediation of dissolved organic nitrogen fluxes in a temperate coastal
lagoon. Estuar. Coast. Shelf Sci. 53(2), 155–168. https://doi.org/10.1006/ecss.2001.0801 (2001).
51. Zepp, R. G. et al. Spatial and temporal variability of solar ultraviolet exposure of coral assemblages in the Florida Keys: Importance
of colored dissolved organic matter. Limnol. Oceanogr. 53, 1909–1922. https://doi.org/10.4319/lo.2008.53.5.1909 (2008).
52. Otis, D. B., Carder, K. L., English, D. C. & Ivey, J. E. CDOM transport from the Bahamas Banks. Coral Reefs 23(1), 152–160. https
://doi.org/10.1007/s00338-003-0356-8 (2004).
53. Andreas, T. D. et al. Seaweed allelopathy against coral: surface distribution of a seaweed secondary metabolite by imaging mass
spectrometry. J. Chem. Ecol. 38(10), 1203–1214. https://doi.org/10.1007/s10886-012-0204-9 (2012).
54. Hahn, J., Lee, Y., Kim, N., Hahn, C. & Lee, S. The groundwater resources and sustainable yield of Cheju volcanic island, Korea.
Environ. Geol. 33(1), 43–53 (1997).
55. Koh, D.-C., Plummer, L. N., Busenberg, E. & Kim, Y. Evidence for terrigenic SF6 in groundwater from basaltic aquifers, Jeju Island,
Korea: implications for groundwater dating. J. Hydrol. 339, 93–104. https://doi.org/10.1016/j.jhydrol.2007.03.011 (2007).
56. Won, J. H., Lee, J. Y., Kim, J. W. & Koh, G. W. Groundwater occurrence on Jeju Island, Korea. Hydrogeol. J. 14(4), 532–547 (2006).
57. Kim, I. & Kim, G. Large fluxes of rare earth elements through submarine groundwater discharge (SGD) from a volcanic island,
Jeju, Korea. Mar. Chem. 127(1–4), 12–19. https://doi.org/10.1016/j.marchem.2011.07.006 (2011).
58. Jeong, J., Kim, G. & Han, S. Influence of trace element fluxes from submarine groundwater discharge (SGD) on their inventories
in coastal waters off volcanic island, Jeju, Korea. Appl. Geochem. 27(1), 37–43. https://doi.org/10.1016/j.apgeochem.2011.08.014
(2012).
59. Stedmon, C. A. & Bro, R. Characterizing dissolved organic matter fuorescence with parallel factor analysis: A tutorial. Limnol.
Oceanogr. 6, 572–579 (2008).
Acknowledgements
We would like to thank all MBL members for their help during the field sampling. This work was supported by
the project titled “Improvement of management strategies on marine disturbing and harmful organisms (No.
20190518)” funded by the Ministry of Oceans and Fisheries, Korea, and by the National Research Foundation
(NRF) funded by the Korean government (NRF-2019R1C1C1002197). This work was supported by INHA UNI-
VERSITY Research Grant (2020). This research was also supported by the Basic Science Research Program to
Research Institute for Basic Science (RIBS) of Jeju National University through the National Research Foundation
of Korea (NRF) funded by the Ministry of Education (2019R1A6A1A10072987).
Author contributions
T.H.K. conceived and designed this study. H.M.C. performed the chemical measurement of FDOM, the PARA-
FAC modeling, and the data analysis under the supervision of T.H.K. J.H.M., D.W.H., and T.J.K., and B.C.S. and
D.H.I. contributed to the sample collection and the chemical measurement of DOC, DON, POC, and inorganic
nutrients. H.M.C. and T.H.K. wrote the manuscript.
Competing interests
The authors declare no competing interests.
Additional information
Supplementary Information The online version contains supplementary material available at https://doi.
org/10.1038/s41598-020-79381-0.
Correspondence and requests for materials should be addressed to T.-H.K.
Reprints and permissions information is available at www.nature.com/reprints.
Publisher’s note Springer Nature remains neutral with regard to jurisdictional claims in published maps and
institutional affiliations.
Open Access This article is licensed under a Creative Commons Attribution 4.0 International
License, which permits use, sharing, adaptation, distribution and reproduction in any medium or
format, as long as you give appropriate credit to the original author(s) and the source, provide a link to the
Creative Commons licence, and indicate if changes were made. The images or other third party material in this
article are included in the article’s Creative Commons licence, unless indicated otherwise in a credit line to the
material. If material is not included in the article’s Creative Commons licence and your intended use is not
permitted by statutory regulation or exceeds the permitted use, you will need to obtain permission directly from
the copyright holder. To view a copy of this licence, visit http://creativecommons.org/licenses/by/4.0/.
© The Author(s) 2021
Scientific Reports | (2021) 11:941 | https://doi.org/10.1038/s41598-020-79381-0 10
Vol:.(1234567890)You can also read