Autism Spectrum Disorder Surveillance in Québec - INSPQ
←
→
Page content transcription
If your browser does not render page correctly, please read the page content below
Une production du

Autism Spectrum Disorder
Surveillance in Québec
Autism Spectrum Disorder
Surveillance in Québec

Bureau d’information et d’études en santé des populations

October 2017
AUTHORS
Fatoumata Binta Diallo
Louis Rochette
Éric Pelletier
Unité surveillance des troubles mentaux et des maladies neurologiques
Bureau d’information et d’études en santé des populations
Institut national de santé publique du Québec
Alain Lesage
Unité surveillance des troubles mentaux et des maladies neurologiques
Bureau d’information et d’études en santé des populations
Institut national de santé publique du Québec
and
Institut universitaire en santé mentale de Montréal

WITH THE COLLABORATION OF
Manon Noiseux
Direction de santé publique – Surveillance de l’état de santé de la population
Centre de santé et de services sociaux de la Montérégie-Centre
Mélina Rivard
Département de psychologie – Laboratoire ÉPAULARD
Université du Québec à Montréal
Alexis Beauchamp-Châtel
Centre intégré de santé et de services sociaux de l’Est-de-l’Île-de-Montréal
Université de Montréal

PAGE LAYOUT
Sylvie Muller
Bureau d’information et d’études en santé des populations

TRANSLATOR
Stevenson&Writers

LINGUISTIC REVISION
Émilie Pelletier

This publication has been translated from Surveillance du trouble du spectre de l’autisme au Québec with
funding from the Public Health Agency of Canada.

This document is available in its entirety in electronic format (PDF) on the Institut national de santé publique du
Québec Web site at: http://www.inspq.qc.ca.

Reproductions for private study or research purposes are authorized by virtue of Article 29 of the Copyright Act. Any
other use must be authorized by the Government of Québec, which holds the exclusive intellectual property rights for
this document. Authorization may be obtained by submitting a request to the central clearing house of the Service de
la gestion des droits d’auteur of Les Publications du Québec, using the online form at
http://www.droitauteur.gouv.qc.ca/en/autorisation.php or by sending an e-mail to droit.auteur@cspq.gouv.qc.ca.

Information contained in the document may be cited provided that the source is mentioned.

Legal Deposit – 3rd quarter 2018
Bibliothèque et Archives nationales du Québec
ISBN: 978-2-550-79621-3 (French PDF)
ISBN: 978-2-550-81771-0 (PDF)
© Gouvernement du Québec (2018)
Autism Spectrum Disorder Surveillance in Québec

Table of contents
List of tables .......................................................................................................................................... III
List of figures......................................................................................................................................... III
List of acronyms and initialisms ........................................................................................................... V
Highlights ................................................................................................................................................ 1
1      Introduction .................................................................................................................................... 3
2      Methodology ................................................................................................................................... 5
       2.1       Data sources .......................................................................................................................... 5
       2.2       Identification of cases ............................................................................................................ 5
       2.3       Periods studied and comparisons ......................................................................................... 6
       2.4       Definition of socio-economic level......................................................................................... 6
       2.5       Definition of medical services ................................................................................................ 7
       2.6       Calculation of mortality .......................................................................................................... 7
       2.7       Report published by the Direction de santé publique of the Agence de la santé et
                 des services sociaux de la Montérégie ................................................................................. 7
3      Results............................................................................................................................................. 9
       3.1       Prevalence of ASD ................................................................................................................. 9
       3.2       Incidence rate of ASD .......................................................................................................... 13
       3.3       Prevalence of ASD according to material and social disadvantage index related to
                 the living environment at birth ............................................................................................. 13
       3.4       Concomitant diseases identified among children with ASD ............................................... 15
       3.5       Number of medical consultations for children with ASD..................................................... 18
       3.6       Profile of use of health services ........................................................................................... 18
       3.7       Hierarchical profile of use of mental health services ........................................................... 19
       3.8       Measuring excess mortality ................................................................................................. 21
4      Discussion..................................................................................................................................... 23
5      Conclusion .................................................................................................................................... 27
References ........................................................................................................................................... 29

Institut national de santé publique du Québec                                                                                                               I
Autism Spectrum Disorder Surveillance in Québec
List of tables
Table 1 Diagnosis codes for ASD .................................................................................................... 6
Table 2 Adjusted number and prevalence, annual and lifetime, of diagnosed ASD among
1- to 17-year-olds, by Réseau territorial de services (RTS), Québec, 2014-2015 ........... 11
Table 3 Prevalence of concomitant disease for persons with or without diagnosed ASD in
the first year of life or in their lifetime, 1- to 17-year-olds, Québec, 2014-2015 .............. 15
Table 4 Number of medical consultations for persons aged 1 to 24 years with or without
diagnosed ASD in Québec in 2014-2015.......................................................................... 18
Table 5 Proportion of incident cases according to age and the specialization of the doctor
making a first diagnosis, Québec, 2014-2015 .................................................................. 19
Table 6 Hierarchical profiles of use of mental health services for persons with or without
diagnosed ASD, 1 to 24 years old, 2014-2015 ................................................................. 20
Table 7 Number and mortality rate by cause of death for persons aged 1 to 24 years with
or without diagnosed ASD, Québec, 1996-2011 .............................................................. 21
List of figures
Figure 1 Annual adjusted diagnosed ASD prevalence for 1- to 17-year-olds, by gender,
Québec, 2000-2001 to 2014-2015 .................................................................................... 10
Figure 2 Lifetime adjusted diagnosed ASD prevalence for 1- to 17-year-olds, by gender,
Québec, 2000-2001 to 2014-2015 .................................................................................... 10
Figure 3 Lifetime prevalence (per 1 000) of diagnosed ASD for 4- to 17-year-olds, by
region, Québec, 2014-2015 (data from QICDSS and MEES) ........................................... 12
Figure 4 Incidence rate of diagnosed ASD among 1- to 24-year-olds according to gender
and age, Québec, 2000-2001 and 2014-2015 .................................................................. 13
Figure 5 Lifetime prevalence of diagnosed ASD among 1- to 17-year-olds, according to
material and social disadvantage, related to the living environment at birth,
Québec, 2014-2015 .......................................................................................................... 14
Figure 6 Hierarchical profiles of use of medical services for mental health reasons for
persons with diagnosed ASD, 1 to 24 years old, by age group, Québec, 2014-
2015 ................................................................................................................................... 20
Institut national de santé publique du Québec IIIAutism Spectrum Disorder Surveillance in Québec
List of acronyms and initialisms
ICD International Classification of Diseases
DSM Diagnostic and Statistical Manual of Mental Disorders
INSPQ Institut national de santé publique du Québec
MED-ÉCHO Maintenance et exploitation des données pour l’étude de la clientèle hospitalière
MEES Ministère de l’Éducation et de l’Enseignement supérieur (previously named the
Ministère de l’Éducation, du Loisir et du Sport)
MSSS Ministère de la Santé et des Services sociaux
RAMQ Régie de l’assurance maladie du Québec
QICDSS Québec Integrated Chronic Disease Surveillance System
ADHD Attention Deficit or Hyperactivity Disorder
PDD Pervasive Developmental Disorders
ASD Autism Spectrum Disorder
Institut national de santé publique du Québec VAutism Spectrum Disorder Surveillance in Québec Highlights This report discusses the prevalence and the incidence rate of autism spectrum disorder (ASD). It also demonstrates the capability of the Québec Integrated Chronic Disease Surveillance System (QICDSS) to identify the comorbidities associated with ASD and the profile of health services utilization. These estimates were obtained from a longitudinal study covering the period from April 1, 2000, to March 31, 2015, for all persons eligible for health coverage between the ages of 1 and 24 years. To be considered to have ASD, the individual must have had at least one medical visit or hospitalization with a principal diagnosis of ASD. The results show a constant growth in ASD over time. In 2014-2015, there were nearly 17 000 persons in Québec between the ages of 1 and 17 who have been diagnosed with ASD. The prevalence of ASD varies considerably from one region to another, varying from 0.7% to 1.8% among persons aged 4 to 17 years. The lifetime prevalence measured by the QICDSS (1.4%) is relatively close to that of the Ministère de l’Éducation et de l’Enseignement supérieur (1.3%), making it possible to use linked medical and administrative sources to track ASD. The material disadvantage index does not show a clear relationship with the prevalence of ASD while the social disadvantage index suggests a linear increase in the rate of prevalence of ASD going from the very advantaged to the very disadvantaged. The study of concomitant physical and mental illnesses during the first year of life and throughout life indicates, in general, a greater prevalence in persons with ASD when compared to the general population without ASD. Pediatricians and psychiatrists are the medical professionals most often consulted by persons with ASD. The types of professionals consulted change depending on the age of the person with ASD. The study of the hierarchical profile of the services used reveals that, with the passage into adulthood, specialized services for mental health decrease and are provided by family doctors. With 75 deaths observed over a period of 15 years, the mortality rate among persons with ASD is three times higher than in the general population without ASD. The information contained in this report provides an unprecedented view of ASD in Québec based on the new monitoring indicators developed under the framework of the QICDSS and offers many new paths for future research. These include, notably, the exploration of the etiology of ASD, the higher mortality observed with this disorder, and the study of the variation in health services availability and the prevalence of ASD. Institut national de santé publique du Québec 1
Autism Spectrum Disorder Surveillance in Québec

1        Introduction
Infantile autism was described for the first time by Léo Kanner in 1943 as an affective disorder of
communication and relationship that does not impact intelligence (Kanner, 1943). In 1944, Hans
Asperger described the disorder as “autistic psychopathy” characterized by quirks and intellectual
abilities ranging from debility to genius (Asperger, 1944). Much later, this little-known definition was
revived by Lorna Wing who summarized the previous work and proposed the definition of Asperger’s
syndrome (Wing, 1981). In 1994, the Diagnostic and Statistical Manual of Mental Disorders (DSM-4)
proposed the term “pervasive developmental disorders” (PDD) (American Psychiatric Association,
1994), which was revised in 2013 in the 5th edition of the manual (DSM-5). With the goal of addressing
the dimensional aspect of this disorder, DSM-5 introduced the notion of autism spectrum disorder
(ASD). ASD is defined as a neurodevelopmental condition which is expressed as a deficit in social
interactions, unusual development of social communications and a characteristic of limited and
repetitive behaviours, interests, and activities (American Psychiatric Association, 2013). It combines a
group of conditions including autism disorder, Asperger’s syndrome, and non-specific pervasive
developmental disorders.

Investigations of the prevalence of ASD show that it has been increasing constantly since the middle
of the 1960s. The risk of having ASD is presently estimated at 1% (Anagnostou et al., 2014). The
United States Centers for Disease Control and Prevention’s (CDC) Autism and Developmental
Disabilities Monitoring (ADDM) Network estimates ASD prevalence of ASD at 14.6 per 1,000 children
aged 8 years in 2012 (Centers for Disease Control and Prevention, 2016). This prevalence varied
widely among the regions, ranging from 12.2 per 1,000 children in South Carolina to 24.4 per
1 000 children in New Jersey (where both education and health care records were analyzed): there
was therefore a 2-fold variation in prevalence rates. In Québec, the monitoring performed on the
database from the ministry of education (MEES; Ministère de l’Éducation et de l’Enseignement
supérieur) has shown a prevalence of ASD of 11.2 per 1 000 children in 2012-2013 (Noiseux, 2016).
The increase in the prevalence of ASD is attributed largely to changes in the definition, to more
accurate diagnosis, to a better awareness among communities and professionals, and to better
approaches to detection and services (Anagnostou et al., 2014; Bello, 2007; Chaste & Leboyer, 2012;
Duchan & Patel, 2012; Herbert, 2010; Levy, Mandell, & Schultz, 2009).

ASD is being observed early, in the first years of a child’s life, and parents often detect symptoms
before the age of three. Boys are more likely to be affected than girls (a ratio of 4 to 5 boys for 1 girl
according to studies). Many factors are cited as causes in the scientific literature to explain the origin
of this disorder: genetic factors (Kochman, Bach, Dereux, Arens, & Garcin, 2010; Levy et al., 2009),
obstetric and neonatal conditions (Gardener, Spiegelman, & Buka, 2009, 2011; Kolevzon, Gross, &
Reichenberg, 2007; Sandin et al., 2012), socioeconomic status (SES) (Lehti et al., 2015; Rai et al.,
2012), and place of residence (Leonard et al., 2011). Some hypotheses related to environmental
factors, such as vaccination, have been refuted (Fombonne, Zakarian, Bennett, Meng, & McLean-
Heywood, 2006), but physical and social environmental factors cannot be discounted and are the
subject of continuing research.

ASD is often accompanied by numerous medical and psychiatric conditions (Simonoff et al., 2008).
Children with ASD have a higher number of medical visits, are medicated for longer periods of time,
have a greater need for treatment and follow-up for emotional, developmental, and behavioural
problems, and they are much more likely to require physical therapy or language therapy than are
children without autism (Gurney, McPheeters, & Davis, 2006). The number of deaths observed is two
to three times higher in populations with ASD than in the general population of the same age and
gender (Treating Autism, 2013; Woolfenden, Sarkozy, Ridley, Coory, & Williams, 2012). Even if

Institut national de santé publique du Québec                                                                3
Autism Spectrum Disorder Surveillance in Québec

improvements occur during development, ASD is a lifelong condition. When children are diagnosed
later in life, the access to specialized services is also delayed with, as a consequence, a potential for
decreased capabilities, impairment in quality of life, and profound dissatisfaction among families in
the policies and services available (Fombonne, 2003).

The objective of this document is to estimate, in Québec, the prevalence and the incidence rate of
ASD, the socioeconomic determinants, the concomitant diseases, the utilization of services, and the
mortality among children and adolescents based on the linked medical and administrative data. A
secondary objective is to compare the results on prevalence obtained with those published in a
report by the Direction de la santé publique de la Montérégie using data from the MEES to establish
whether the linked medical and administrative databases can be used as a source of information for
monitoring ASD in Québec.

4                                                                   Institut national de santé publique du Québec
Autism Spectrum Disorder Surveillance in Québec

2        Methodology
2.1      Data sources

Estimates were produced using data from linked administrative databases of the Régie de
l’assurance maladie du Québec (RAMQ) and the Ministère de la Santé et des Services sociaux du
Québec (MSSS), which together form the Québec Integrated Chronic Disease Surveillance System
(QICDSS) (Blais et al., 2014). The QICDSS contains information sourced from: a) claims from doctors
that compile all medical procedures billed to RAMQ; b) registration files for all persons covered by
health insurance (FIPA), which contain demographic data as well as the period of their eligibility for
health insurance; c) hospitalization records MED-ÉCHO (Maintenance et exploitation des données
pour l’étude de la clientèle hospitalière) that record the principal and secondary diagnoses associated
with a hospital admission; and d) files on death of the Registre des événements démographiques.

The International Classification of Diseases, Ninth Revision (ICD-9) was used to code diagnoses in
the physician billing database for the entire observation period. In the hospitalization database, the
ICD-9 was used for the period up to March 31, 2006, and the tenth revision (ICD-10) was used
thereafter.

2.2      Identification of cases

The population under study for any given year is composed of all children under 17 years of age who
have received a principal diagnosis of ASD between the years 2000 and 2015 and who are eligible for
coverage under the health insurance regime of Québec. The population aged 18 to 24 was also
analyzed since this condition persists for their entire lifetime. Individuals who have received a
principal diagnosis of ASD during the period of observation are considered to be prevalent cases with
the disorder. Individuals who have received a first principal diagnosis of ASD are considered to be
incident cases for the year under study.

To be considered to have ASD, the individual must have had at least one medical visit or a
hospitalization with a principal diagnosis of ASD (codes 299.0, 299.1, 299.8, and 299.9 of the ICD-9
or their equivalent in ICD-10-CA). General practitioners, pediatricians, psychiatrists, or other medical
specialists may make the diagnoses found in the files of RAMQ and MED-ÉCHO. Table 1 describes
the different ASD diagnoses associated with the different codes found in ICD-9 and ICD-10-CA.

Subjects are considered to be afflicted with a concomitant disease when they have had at least one
medical visit or hospitalization with one of the diagnosis codes mentioned in Table 3. A systematic
scan and review of the literature guided the choice of concomitant diseases to be studied.

Institut national de santé publique du Québec                                                               5
Autism Spectrum Disorder Surveillance in Québec

Table 1           Diagnosis codes for ASD

     Categories of                        Description
                          ICD-9                             ICD-10-CA            Description ICD-10-CA
    mental disorders                        ICD-9
                          299.0         Autistic disorder     F84.0                  Childhood autism
                                         Disintegrative                       Other childhood disintegrative
                          299.1                               F84.3
                                          psychosis                                      disorder
                                                              F84.1                   Atypical autism
                                                              F84.2                  Rett’s syndrome
                                        Other specified                    Overactive disorder associated with
    Autism spectrum                       pervasive           F84.4        mental retardation and stereotyped
                          299.8
     disorder (ASD)                     developmental                                  movements
                                          disorders           F84.5                Asperger’s syndrome
                                                                             Other pervasive developmental
                                                              F84.8
                                                                                    disorders (PDD)
                                          Unspecified
                                           pervasive                       Pervasive developmental disorder,
                          299.9                               F84.9
                                         developmental                                unspecified
                                            disorder

The indicator used to evaluate the degree of ASD in the population was the lifetime prevalence. The
individual only had to meet the inclusion criteria once during the period of observation in order to be
considered a prevalent case of ASD. This choice of lifetime prevalence allows us to demonstrate the
chronic and widespread nature of this mental disorder. This is calculated in a cumulative fashion over
the course of years and thus includes both recent cases and much older ones. The annual
prevalence, which gives a better representation of the workload on health services (which includes
only individuals who met the inclusion criteria during the year) was also calculated and will be
presented.

2.3       Periods studied and comparisons

The estimates were obtained from a longitudinal study. The period covered by the data begins
January 1, 1996. The period of this analysis begins April 1, 2000, and ends March 31, 2015.

The comparisons over time and between regions are made with measured data adjusted for age. The
measured data is obtained by direct standardization based on the age structure of the population of
Québec in 2001. The ranges of ages considered are: 1-4 years, 5-9 years, 10-14 years, and 15-
17 years. The identification of concomitant diseases among persons with ASD and in the general
population was done in the first year of life (even though ASD may have been identified later in life)
and during their lifetime.

2.4       Definition of socio-economic level

The estimation of socio-economic level is based on geographic indices of social and material
disadvantage (Pampalon, Gamache, & Hamel, 2010). The quintile 1 represents the most advantaged
regions and, inversely, the quintile 5 represents the most disadvantaged. The measure of
disadvantage was realized using the most recent census data at the time of the period studied.
Children born from 2000-2001 and 2003-2004 were attributed indices from the census of 2001;
children born from 2004-2005 and 2008-2009 from the census of 2006; and children born from 2009-
2010 and 2014-2015 from the census of 2011. The analyses were performed jointly and separately

6                                                                       Institut national de santé publique du Québec
Autism Spectrum Disorder Surveillance in Québec
for the material component and for the social component. The material component is defined by the
level of schooling attained, employment, and revenue, while the social component is associated with
variations in family structure and marital state. Roughly 94% of Québec’s population in the QICDSS
were given an index of disadvantage in 2014-2015 (most recent files available).
2.5 Definition of medical services
The service utilization profiles are constructed based on the location where the services are provided
and according to the specialization of the doctor involved: family doctor (general practitioner),
pediatrician, psychiatrist, or other specialist. Information regarding service sites was collected in the
physicians’ claims database, which classifies institutions. Consequently, private physicians’ offices
have been distinguished from public institutions and, within hospitals, outpatient, emergency, and
psychiatric consultations have been differentiated. Information on the vocation of a hospital in which
an individual stayed derives from the hospitalization database.
2.6 Calculation of mortality
The calculation of the number of deaths is based on the mortality data from 1996 to 2011 among
persons between 1 and 24 years of age. The analysis of causes of death takes into account deaths
occurring during a given year of persons meeting the case definition during the same year. Overall
excess mortality by main cause of death for persons with ASD were calculated using age-adjusted
mortality rate ratios and are presented according to the status of the person, either suffering or not
suffering from an ASD.
2.7 Report published by the Direction de santé publique of the Agence de la
santé et des services sociaux de la Montérégie
Since 2007, a regional public health agency has been monitoring ASD using data on handicapped
students or those with special needs supplied by the MEES (Noiseux, 2016). The Montérégie is
compared to 17 other administrative regions and to Québec as a whole. The student handicapped by
ASD is one who has received a diagnosis from a physician or psychologist who has developed
expertise in the field and is part of a multidisciplinary team whose overall evaluation has concluded
with one of the following diagnoses: autistic disorder, Rett’s syndrome, childhood disintegrative
disorder, Asperger’s syndrome, and unspecified ASD. School commissions account for students with
ASD who have a code 50. In order to be coded as such, the student must not only be identified as
having ASD, but must also have serious limitations and support measures put in place to mitigate
them. The data analyzed covers the school years 2000-2001 to 2014-2015. The rate of prevalence of
ASD is calculated as follows: the total number of students with ASD for a given school year divided
by the total number of students for the school year multiplied by 10 000.
Institut national de santé publique du Québec 7Autism Spectrum Disorder Surveillance in Québec 3 Results 3.1 Prevalence of ASD The annual prevalence of ASD in children aged 1 to 17 has been growing strongly from 1 per 1 000 in 2000-2001 to more than 4 per 1 000 in 2014-2015 (Figure 1). This prevalence differs according to the sex and the age of the child. It was 7.3 and 1.8 per 1 000 among boys and girls, respectively, in 2014-2015. In 2014-2015, there were 16 490 children from 1 to 17 years old who had been diagnosed with ASD since 2000. The lifetime prevalence is 12 per 1 000 (Figure 2); or 19 per 1 000 among boys and 5 per 1 000 among girls, equivalent to a ratio of nearly 4 boys to each girl. Table 2 presents the number of people from 1 to 17 with ASD, as well as the adjusted annual prevalence and the lifetime prevalence according to the Réseau territorial de services (RTS) for the year 2014-2015. The 99% confidence intervals make it easier to evaluate the territorial variations. There is a large difference between the different RTSs ranging from 0 to 7.2 per 1 000 for the annual prevalence and from 6.7 to 17.3 per 1 000 for the lifetime prevalence. Figure 3 shows the regional lifetime prevalence of ASD among children from 4 to 17 years old taken from data provided by the MEES and presented in the report from the Direction de la santé publique de la Montérégie and the lifetime prevalence data from QICDSS. The lifetime prevalence measured by the QICDSS is relatively close to that of the MEES for many regions. The prevalence for Québec as a whole remains identical in the two sources (13.6 in the QICDSS versus 13.2 in the MEES). Institut national de santé publique du Québec 9
Autism Spectrum Disorder Surveillance in Québec

Figure 1                                       Annual adjusted diagnosed ASD prevalence for 1- to 17-year-olds, by gender,
                                               Québec, 2000-2001 to 2014-2015

                                       8

                                       7
     Adjusted prevalance (for 1 000)

                                       6

                                       5

                                       4
                                                                                                                              Female
                                       3
                                                                                                                              Male
                                       2                                                                                      All
                                       1

                                       0

                                                                        Year

Figure 2                                       Lifetime adjusted diagnosed ASD prevalence for 1- to 17-year-olds, by gender,
                                               Québec, 2000-2001 to 2014-2015

                                       25
     Adjusted prevalence (for 1 000)

                                       20

                                       15

                                       10                                                                                     Female
                                                                                                                              Male

                                           5                                                                                  All

                                           0

                                                                         Year

10                                                                                          Institut national de santé publique du Québec
Autism Spectrum Disorder Surveillance in Québec
Table 2 Adjusted number and prevalence, annual and lifetime, of diagnosed ASD among
1- to 17-year-olds, by Réseau territorial de services (RTS), Québec, 2014-2015
Annual prevalence Lifetime prevalence
Réseau territorial de
services (RTS) Prevalence C.I. Prevalence C.I.
Number Number
(per 1 000) at 99% (per 1 000) at 99%
CISSS du Bas-Saint-Laurent 175 5.7 4.6-7.0 335 11.2 9.7-13.0.
CIUSSS du Saguenay—Lac-
175 3.9 3.1-4.7 390 8.9 7.8-10.2.
Saint-Jean
CIUSSS de la Capitale-
350 3.3 2.8-3.8 750 7.3 6.6-8.0
Nationale
CIUSSS de la Mauricie-et-du-
255 3.2 2.7-3.8 615 8.2 7.3-9.1
Centre-du-Québec
CIUSSS de l’Estrie – Centre
275 3.4 2.9-4.0 1 050 13.5 12.4-14.6
hospitalier universitaire
CIUSSS de l’Ouest-de-l’Île-
380 5.4 4.7-6.2 1 050 15.7 14.5-17.1
de-Montréal
CIUSSS du Centre-Ouest-de-
340 5.6 4.8-6.4 845 14.6 13.3-16.0
l’Île-de-Montréal
CIUSSS du Centre-Sud-de-
200 5.5 4.5-6.7 540 16.4 14.5-18.5
l’Île-de-Montréal
CIUSSS du Nord-de-l’Île-de-
430 5.4 4.7-6.1 1 025 13.8 12.7-15.1
Montréal
CIUSSS de l’Est-de-l’Île-de-
495 5.6 4.9-6.4 1 180 14.2 13.1-15.4
Montréal
CISSS de l’Outaouais 295 3.9 3.3-4.6 700 9.9 8.9-10.9
CISSS de l’Abitibi-
80 2.8 2.1-3.8 160 6.1 4.9-7.5
Témiscamingue
CISSS de la Côte-Nord 50 3.2 2.1-4.6 125 7.9 6.2-10.0
CISSS de la Gaspésie 70 6.4 4.6-8.8 120 11.2 8.7-14.3
CISSS des Îles 0 0.0 0.0-0.0 10 6.7 2.6-14.6
CISSS de Chaudière-
225 2.9 2.4-3.5 545 7.6 6.8-8.5
Appalaches
CISSS de Laval 480 5.7 5.0-6.4 1 100 13.6 12.6-14.8
CISSS de Lanaudière 300 3.3 2.8-3.8 830 9.5 8.6-10.4
CISSS des Laurentides 620 5.7 5.1-6.4 1 470 14.4 13.4-15.4
CISSS de la Montérégie-
400 5.6 4.8-6.3 1 065 15.7 14.5-17.0
Centre
CISSS de la Montérégie-Est 680 7.2 6.5-7.9 1 550 17.3 16.2-18.6
CISSS de la Montérégie-
420 4.6 4.0-5.2 1 340 15.6 14.5-16.8
Ouest
QUÉBEC 6 720 4.6 4.5-4.7 16 940 12.3 12.0-12.5
Institut national de santé publique du Québec 11Autism Spectrum Disorder Surveillance in Québec
Figure 3 Lifetime prevalence (per 1 000) of diagnosed ASD for 4- to 17-year-olds, by
region, Québec, 2014-2015 (data from QICDSS and MEES)
Montérégie 20,5
18,3
14,4
Montréal 16,2
15,2
Laurentides
16,0
Estrie 6,1
15,5
Health region
Laval 17,2
15,2
13,2
Québec
13,6
8,8
Bas-St-Laurent 12,5
Gaspésie–Îles-de-la- 9,4
Madeleine 11,7 MEES
8,0
Outaouais 11,2 QICDSS
Lanaudière 12,6
10,4
7,5
Saguenay–Lac-St-Jean 9,7
8,5
Mauricie-Centre-du-Québec
8,7
Chaudière-Appalaches 8,5
8,4
Côte-Nord 7,3
8,3
Capitale-Nationale 9,2
7,9
6,6
Abitibi
7,0
0,0 5,0 10,0 15,0 20,0 25,0
99% confidence interval.
12 Institut national de santé publique du QuébecAutism Spectrum Disorder Surveillance in Québec
3.2 Incidence rate of ASD
In 2014-2015 there were 2 758 new cases of ASD among persons 17 years old and under (these
results were not presented). The incidence rate is 1.9 per 1 000 children. Boys are most often
diagnosed and this at a rate almost four times that of girls.
For 2000-2001, as for 2014-2015, the first diagnosis is often made before the age of 5 and the
majority are diagnosed before the age of 10 (Figure 4).
Figure 4 Incidence rate of diagnosed ASD among 1- to 24-year-olds according to gender
and age, Québec, 2000-2001 and 2014-2015
4
3
Incidence (for 1 000)
2
1
0
01-04 05-09 10-14 15-17 18-24
Age group
2000-2001 Female 2000-2001 Male 2014-2015 Female 2014-2015 Male
3.3 Prevalence of ASD according to material and social disadvantage index
related to the living environment at birth
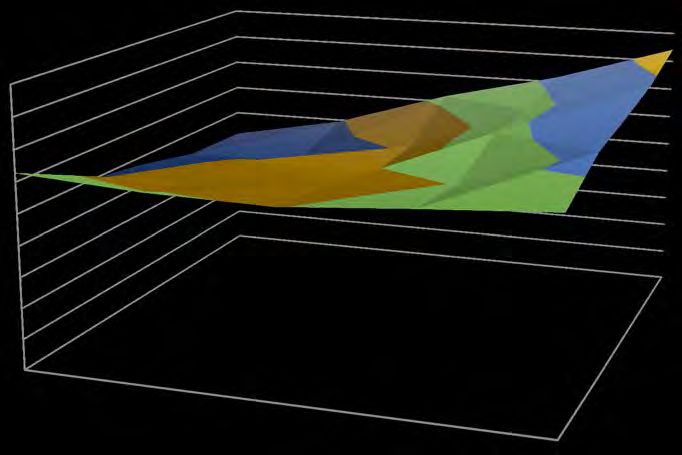
Figure 5 shows the prevalence of ASD according to the material and social disadvantage index at
birth. A complex relationship between the types of disadvantage is observed. A peak is observed in
both those who are very disadvantaged on both indices and those who are very advantaged on the
material index. Taken separately, the material disadvantage index does not show a clear relationship
with the prevalence of ASD while the social disadvantage index suggests a linear increase in the rate
of prevalence of ASD going from the very advantaged to the very disadvantaged.
Institut national de santé publique du Québec 13Autism Spectrum Disorder Surveillance in Québec
Figure 5 Lifetime prevalence of diagnosed ASD among 1- to 17-year-olds, according to
material and social disadvantage, related to the living environment at birth,
Québec, 2014-2015
16-18
14-16
12-14
10-12
18 8-10
Lifetime prevalence ( for 1 000)
16
14
12
10
Material disadvantage
8
6 Very disadvantaged
4
2
0
Very advantaged
Very advantaged
Social disadvantage Very disadvantaged
Material Disadvantage Social Disadvantage
14 16
14
12
Lifetime prevalence (for 1 000)
12
Lifetime prevalence (for 1 000)
10
10
8
8
6
6
4
4
2
2
0 0
Very advantaged Very disadvantaged Very advantaged Very disadvantaged
14 Institut national de santé publique du QuébecAutism Spectrum Disorder Surveillance in Québec
3.4 Concomitant diseases identified among children with ASD
Table 3 shows the concomitant diseases diagnosed in people with ASD (in their first year of life and during their lifetime) and in the general
population without ASD for the 2014-2015 period in Québec. The concomitant diseases are presented in the order of their appearance in the
codes of the ICD-9. In most cases, the proportion of subjects with a concomitant disease is greater among people with ASD than in the general
population and this is true for almost all of the diseases studied.
Table 3 Prevalence of concomitant disease for persons with or without diagnosed ASD in the first year of life or in their lifetime,
1- to 17-year-olds, Québec, 2014-2015
First year of life During lifetime
With ASD Without ASD With ASD Without ASD
Concomitant diseases
(n=16 940) (n=1 447 660) (n=16 940) (n=1 447 660)
(ICD-9 codes)
% 99% C.I. (%) 99% C.I. (%) 99% C.I. (%) 99% C.I.
Infectious diseases (000-
26.9 25.8-27.9 21.4 21.3-21.5 68.0 66.4-69.7 54.2 54.0-54.4
139)
Tumours (140-239) 3.3 2.9-3.7 3.1 3.0-3.1 11.3 10.7-12.0 8.7 8.6-8.7
Endocrinological, nutritional
or metabolic diseases, and
7.1 6.6-7.7 3.7 3.7-3.7 24.9 23.9-25.9 12.4 12.3-12.4
immune system problems
(240-279)
Diabetes (250) 0.2 0.1-0.3 0.1 0.1-0.1 1.2 0.9-1.4 0.5 0.5-0.5
Mental disorders (290-319) 8.8 8.2-9.4 3.5 3.5-3.5 85.2 83.4-87.0 25.3 25.2-25.4
Organic psychotic
0.1 0.1-0.2 0.0 0.0-0.0 1.7 1.4-1.9 0.3 0.3-0.3
conditions (290-294)
Problems related to
substance abuse (291-292 0.1 0.0-0.2 0.1 0.0-0.1 2.1 1.8-2.4 0.7 0.6-0.7
and 303-305)
Anxiodepressive disorders
0.9 0.7-1.1 0.5 0.4-0.5 34.2 33.1-35.4 7.7 7.6-7.7
(296 - 300, 311, 313)
Institut national de santé publique du Québec 15Autism Spectrum Disorder Surveillance in Québec
Table 3 Prevalence of concomitant disease for persons with or without diagnosed ASD in the first year of life or in their lifetime,
1- to 17-year-olds, Québec, 2014-2015 (continued)
First year of life During lifetime
With ASD Without ASD With ASD Without ASD
Concomitant diseases
(n=16 940) (n=1 447 660) (n=16 940) (n=1 447 660)
(ICD-9 codes)
% 99% C.I. (%) 99% C.I. (%) 99% C.I. (%) 99% C.I.
Anxiety disorders (300, 313) 0.8 0.6-1.0 0.4 0.4-0.4 32.6 31.5-33.8 7.1 7.1-7.2
Reactive disorders (308,
0.2 0.1-0.3 0.1 0.1-0.1 16.9 16.1-17.7 3.3 3.2-3.3
309)
Schizophrenia (295) 0.0 0.0-0.0 0.0 0.0-0.0 1.1 0.9-1.3 0.1 0.1-0.1
Behavioural disorders (301,
0.6 0.4-0.7 0.2 0.2-0.3 13.2 12.5-13.9 2.2 2.1-2.2
302, 312)
Personality disorders (301) 0.1 0.0-0.1 0.0 0.0-0.0 3.9 3.5-4.3 0.5 0.5-0.5
Attention deficit
0.6 0.4-0.8 0.2 0.2-0.2 42.0 40.7-43.3 9.3 9.2-9.3
hyperactivity disorder (314)
Delayed development (315
5.3 4.8-5.8 1.4 1.4-1.4 57.1 55.6-58.6 8.4 8.3-8.4
and 317-319)
Mental retardation (317-
0.2 0.1-0.3 0.0 0.0-0.0 6.0 5.5-6.5 0.2 0.2-0.2
319)
Inflammatory CNS diseases
0.5 0.4-0.7 0.3 0.3-0.3 1.4 1.2-1.7 0.7 0.7-0.7
(320-327)
Hereditary and
degenerative CNS disorder 0.8 0.6-1.0 0.2 0.2-0.2 2.5 2.2-2.8 0.6 0.5-0.6
(330-337)
Other CNS diseases and
2.4 2.1-2.7 0.6 0.6-0.6 14.8 14.1-15.6 4.5 4.5-4.5
syndromes (340-349)
Epilepsy (345) 1.3 1.1-1.5 0.3 0.3-0.3 8.4 7.9-9.0 1.3 1.3-1.3
Diseases of the peripheral
1.0 0.8-1.3 0.2 0.2-0.3 4.5 4.1-4.9 0.9 0.9-1.0
nervous system (350-359)
16 Institut national de santé publique du QuébecAutism Spectrum Disorder Surveillance in Québec
Table 3 Prevalence of concomitant disease for persons with or without diagnosed ASD in the first year of life or in their lifetime,
1- to 17-year-olds, Québec, 2014-2015 (continued)
First year of life During lifetime
With ASD Without ASD With ASD Without ASD
Concomitant diseases
(n=16 940) (n=1 447 660) (n=16 940) (n=1 447 660)
(ICD-9 codes)
% 99% C.I. (%) 99% C.I. (%) 99% C.I. (%) 99% C.I.
Diseases of the eye and its
15.1 14.4-15.9 9.9 9.9-10.0 42.9 41.6-44.2 27.9 27.8-28.0
appendages (360-379)
Diseases of the ear and
30.0 28.9-31.1 27.8 27.7-27.9 83.1 81.3-84.9 69.6 69.4-69.8
mastoid process (380-389)
Diseases of the circulatory
4.9 4.4-5.3 2.6 2.6-2.7 14.3 13.5-15.0 7.7 7.6-7.7
system (390-459)
Diseases of the respiratory
56.9 55.4-58.4 51.3 51.2-51.5 92.7 90.8-94.6 84.0 83.8-84.2
system (460-519)
Diseases of the digestive
28.3 27.2-29.3 20.2 20.1-20.3 63.3 61.7-64.9 45.5 45.3-45.6
system (520-579)
Diseases of the
genitourinary system (580- 11.3 10.7-12.0 6.8 6.8-6.9 38.4 37.2-39.6 28.1 28.0-28.2
629)
Congenital abnormalities
20.7 19.8-21.6 13.6 13.5-13.7 34.1 32.9-35.3 20.1 20.0-20.2
(740-759)
Other congenital
abnormalities of the 1.8 1.5-2.1 0.5 0.5-0.5 3.7 3.4-4.1 0.7 0.7-0.7
nervous system (742)
Down syndrome (758.0) 0.8 0.7-1.0 0.5 0.5-0.5 2.7 2.3-3.0 0.7 0.7-0.7
Perinatal disorders
50.1 48.7-51.5 44.2 44.1-44.4 51.5 50.1-52.9 44.9 44.8-45.1
(764-779)
Trauma (800-999) 15.2 14.4-16.0 11.7 11.6-11.8 69.0 67.4-70.7 55.5 55.3-55.6
Institut national de santé publique du Québec 17Autism Spectrum Disorder Surveillance in Québec
3.5 Number of medical consultations for children with ASD
Table 4 presents data for the population of Québec, aged 1 to 24 years, who have consulted a
physician at least once in 2014-2015. It shows the number and the reasons for the consultations for
persons with or without ASD. A person with ASD seems to receive, on average, two times more
medical procedures than a person without ASD (5.8 versus 2.7). In addition, the number of
consultations for mental health reasons is greater among those with ASD compared to those without
ASD (2.3 versus 0.2).
Table 4 Number of medical consultations for persons aged 1 to 24 years with or without
diagnosed ASD in Québec in 2014-2015
Persons Persons
with ASD without ASD
(n = 22 100) (n = 2 162 950)
Total number of consultations 127 270 5 761 070
Average number of consultations per patient 5.8 2.7
Total number of consultations for mental
50 900 532 755
health reasons
Average number of consultations for mental
2.3 0.2
health reasons per patient
Total number of consultations for reasons
76 375 5 228 310
other than mental health
Average number of consultations for reasons
3.5 2.4
other than mental health per patient
3.6 Profile of use of health services
Table 5 shows the proportion of incident cases according to age and to the specialization of the
phycisian. Up to the age of 14, pediatricians make the majority of first diagnoses of ASD followed by
psychiatrists (between 5 and 14 years old). After the age of 15, this tendency is reversed.
18 Institut national de santé publique du QuébecAutism Spectrum Disorder Surveillance in Québec
Table 5 Proportion of incident cases according to age and the specialization of the
doctor making a first diagnosis, Québec, 2014-2015
Specialization of doctor who first diagnosed ASD
Age group Other
(Years) Psychiatrist Pediatrician Family physician Total
specialists
n (%) n (%) n (%) n (%) n (%)
01-04 75 (8.2) 644 (70.2) 123 (13.4) 76 (8.3) 918 (100.0)
05-09 221 (20.1) 652 (59.3) 182 (16.6) 45 (4.1) 1 100 (100.0)
10-14 188 (35.7) 259 (49.2) 67 (12.7) 13 (2.5) 527 (100.0)
15-17 104 (48.8) 69 (3.4) 30 (14.1) 10 (4.7) 213 (100.0)
18-24 97 (51.6) 15 (8.0) 66 (35.1) 10 (5.3) 188 (100.0)
3.7 Hierarchical profile of use of mental health services
The hierarchical profile of use of mental health services allows us to take into account the fact that
the same person can consult different professionals or make use of different health services during
the same period. The analysis focused on all of the people who had received a diagnosis of ASD
during their lifetime. The profile of use identifies the patient based on whether they have been
hospitalized, admitted to an emergency department, or consulted a family doctor, a psychiatrist, an
outpatient pediatrician, or if they were seen at a clinic.
Table 6 shows the hierarchical use profile of medical health services for the year 2014-2015. For
persons with ASD, in general, it appears that pediatricians and psychiatrists are consulted most
often, followed by family doctors. This table also clearly shows that very few people with ASD are
hospitalized and that less than 3% go to the emergency room for mental health reasons in a given
year. People with ASD are more likely to use different medical services than people without ASD,
particularly when it comes to reasons of mental health.
Figure 7 shows the hierarchical profile of use of mental health medical services of persons from
1-24 years old with ASD during the year 2014-2015 according to age group. It is clear that the types
of professionals consulted change depending on the age of the person with ASD. As they age,
people with ASD receive fewer services for mental health. Similarly, people without ASD are less
likely to use mental health services.
Institut national de santé publique du Québec 19Autism Spectrum Disorder Surveillance in Québec
Table 6 Hierarchical profiles of use of mental health services for persons with or without
diagnosed ASD, 1 to 24 years old, 2014-2015
With ASD Without ASD
Place of Consultation for Mental Health
Proportion 99% C.I. Proportion 99% C.I.
Hospitalization 1.9 1.7-2.2 0.3 0.2-0.3
Residential care centres 1.2 1.0-1.4 0.1 0.1-0.1
Emergency 2.8 2.5-3.1 0.8 0.8-0.8
Outpatient psychiatrist 17.7 17.0-18.5 1.0 1.0-1.0
Outpatient pediatrician 22.3 21.5-23.1 3.0 2.9 - 3.0
Family doctor’s office 9.2 8.7-9.7 4.0 4.0-4.0
Other specialized doctor 1.5 1.3-1.7 0.2 0.2 - 0.2
No mental health service 43.4 42.3-44.6 90.7 90.5-90.9
Figure 6 Hierarchical profiles of use of medical services for mental health reasons for
persons with diagnosed ASD, 1 to 24 years old, by age group, Québec, 2014-
2015
18-24
15-17
10-14
05-09
01-04
0% 10% 20% 30% 40% 50% 60% 70% 80% 90% 100%
Percentage
Hospitalization Residential care centers Emergency room
Outpatient psychiatrist Outpatient pediatrician Office-based family doctor
Other specialists No mental health services
20 Institut national de santé publique du QuébecAutism Spectrum Disorder Surveillance in Québec
3.8 Measuring excess mortality
Table 7 shows 75 deaths occurring among persons aged 1-24 years with ASD for the period from
1996 to 2011. The death rate from suicide among persons with ASD is two times higher than for the
general population without ASD. The death rate from other causes among persons with ASD is five
times higher than for the general population without ASD.
Table 7 Number and mortality rate by cause of death for persons aged 1 to 24 years
with or without diagnosed ASD, Québec, 1996-2011
Mortality rate
Number and proportion of deaths
Cause of death (Per 100 000 and 99% C.I.)
With ASD Without ASD With ASD Without ASD
9.9 4.1
Suicide 10 (13%) 1 557 (15%)
(3.7-21.2) (3.9-4.4)
21.8 13.8
Trauma 22 (29%) 5 229 (52%)
(11.7-36.8) (13.3-14.3)
Other causes of 42.6 8.7
43 (57%) 3,298 (33%)
death (27.7-62.3) (8.3-9.1)
74.2 26.7
Total 75 (100%) 10 084 (100%)
(54.0-99.3) (26.0-27.3)
Institut national de santé publique du Québec 21Autism Spectrum Disorder Surveillance in Québec 4 Discussion The QICDSS shows that ASDs have risen steadily over the past decade, reaching a lifetime prevalence of 12 per 1 000 persons aged 17 years and younger in 2014 to 2015. This matches with data observed in the literature (between 9 and 14 per 1 000) (Anagnostou et al., 2014; CDC, 2016). Compared with the CDC’s data for 2012 (14.6 per 1 000), the QICDSS shows a slightly lower prevalence for children 8 years old (12.3 per 1 000 in 2012). The incidence rate follows the same growth trend over time and had reached 1.9 per 1 000 in 2014-2015 in Québec. The ratio of ASD between boys and girls, 4 boys per 1 girl, matches that of the literature. If we consider the recent trends in 2014-2015 for the first time a diagnosis is received, it is often made before the age of 5 and, in the great majority of cases, before the age of 10. The great majority of diagnoses of ASD are made by pediatricians and psychiatrists, either doctors specialized in child development or in the diagnosis of mental disorders. The interregional differences in the prevalence of ASD observed in this report (Figure 3) can be explained by many factors such as a school organization or health services that cannot reach everyone in need or because of the socio-economic determinants that influence them (Lesage, 1996; Oswald et al., 2013). This is consistent with an Australian study that justified the low prevalence of ASD in rural areas by a lack of available services (Leonard et al., 2011). This gap between the regions could also be explained by the sensitization of the population to this problem that varies from one region to another, as well as the migration of families with an ASD child to access medical and school services. In 2014-2015, QICDSS and MEES counted 16 010 and 13 275 children aged 4 to 17, respectively, with a diagnosis of ASD. There are 2 735 more cases in the QICDSS data, which could be mostly mild cases (Asperger’s, unspecified ASD) who do not receive services at school. The QICDSS and MEES data are remarkably similar for some regions, but very different for others (Figure 3). The rates reported by the QICDSS for Estrie, Bas-Saint-Laurent, and Outaouais are very high compared to those of the MEES. This underestimation of the TSA rate from the MEES data could be explained, among other things, by the use of a single source of data for the identification of cases, unlike the QICDSS, which is composed of several data files making it possible to record children not declared at MEES. The MEES data may not be exhaustive, and a number of cases are missing: 1) students who do not meet the three criteria of the MEES (the diagnostic assessment performed by qualified personnel, the disability and limitations resulting from the impairment or disorder, and the support measures put in place to mitigate the impairment); 2) students waiting for diagnosis; 3) students with dual diagnosis reported under another disorder code; 4) students not enrolled in a school on September 30, but present in the following months (moving, reclassification during the year, etc.); and 5) students enrolled in a private school. Our work showed a linear relation between social disadvantage and ASD. The prevalence of ASD in underprivileged environments is greater than in affluent areas. The relationship is more complex with material disadvantage, indicating a slight U-shaped relationship. The high prevalence among children from economically well-off families could be attributed to the association of the increasing age of the parent with the risk of genetic abnormalities. Numerous researchers have reported a link between the increased age of parents and ASD (Gardener et al., 2009; Sandin et al., 2012). Gardener et al. (2009) estimated that an increase of five years in maternal age led to a 7% increase in the risk of autism in the child. In fact, parents of children in affluent areas with a high income tend to have children at a later age (due, among other things, to the fact that they are trying to finish their post-secondary studies before becoming parents) (Statistics Canada, 2009). It could also be argued that these better- educated parents are better able to identify the specialized medical and educational services available in the regions, so their children would be diagnosed earlier. This is consistent with the analysis made by Sun and his collaborators that upper-class parents express more concerns than Institut national de santé publique du Québec 23
Autism Spectrum Disorder Surveillance in Québec

those in the lower classes (Sun, Allison, Auyeung, Baron-Cohen, & Brayne, 2014). In addition, the
increase in prevalence in underprivileged environments could be due to the fact that environmental
factors (physical or social) would be more frequent in these environments, and thus explain, at least
in part, this higher prevalence of ASD.

The review of concomitant diseases was examined in two stages, in the first year of life and over the
course of life, and compared with the population without ASD. In general, the results indicate a higher
prevalence of concomitant diseases among people with ASD when compared to the general
population without ASD (Table 3). For purposes of comparison, many studies of ASD-related
diseases corroborate the data in this report (Berenguer-Forner, Miranda-Casas, Pastor-Cerezuela, &
Rosello-Miranda, 2015; Chakrabarti & Fombonne, 2005; Fombonne, 2003; Gurney et al., 2006;
Kohane et al., 2012; Timonen-Soivio et al., 2015; van Steensel, Bogels, & Perrin, 2011; Woolfenden et
al., 2012). The prevalence observed in people with and without ASD may vary by study.

The average number of medical visits among people with ASD is twice as high as in subjects without
ASD, which is expected given the concomitant illnesses identified previously. This observation is
comparable to the results of Gurney et al. (2006). In addition, people with ASD make greater use of
medical mental health services and are hospitalized more often for mental health reasons than the
general population. This was also expected given the higher rates of concomitant illnesses with
different mental disorders previously identified. A review of the hierarchical profile of use of these
mental health services also shows that the majority of people with ASD aged 1 to 24 are supported
by outpatient psychiatrists and pediatricians, but once the patients reach adulthood, these
specialized services for mental health purposes diminish and are provided by family physicians. This
finding echoes the concern raised in the recent literature that the transition to adulthood is associated
with a break in the continuity of care provided by the health system and in the care of people with
ASD (Kuhlthau, Warfield, Hurson, Delahaye, & Crossman, 2015; Watson, Parr, Joyce, May, &
Le Couteur, 2011).

This report supports what is observed in the literature by showing that the proportion of deaths
among people with ASD is twice as high as in the general population (Treating Autism, 2013;
Woolfenden et al., 2012). However, it was not possible, given the small numbers, to enumerate and
compare all of the specific causes of death.

Limitations
The QICDSS constitutes an inestimable source of information for the surveillance of ASDs, however it
is not without limitations. As a linked medical and administrative data file, QICDSS is designed for
administrative purposes, so some useful information may be missing (Blais et al., 2014). For example,
the lack of information about services rendered outside Québec may represent a limit for interregional
comparisons since it could result in underestimating prevalence measurements. This is the case, for
example, in regions bordering Ontario or New Brunswick (Outaouais, Gaspésie-Îles-de-la-Madeleine,
and Abitibi-Témiscamingue), where part of the population receives medical care in the neighbouring
province. Although coverage of QICDSS is almost universal, it excludes Québec residents covered by
federal health programs (refugee claimants, full-time members of the Canadian Forces, eligible
veterans, members of the Royal Canadian Mounted Police, and inmates of federal penitentiaries).
QICDSS does not identify eligible persons who have been seen by a salaried or contracted doctor
(who does not code the patients’ diagnoses), those who have sought health care provided by a
professional other than a physician (in the community or private clinic or in the school environment),
those who used health services without receiving a diagnostic code for relevant mental illness, and
those who did not use health services at all.

24                                                                 Institut national de santé publique du Québec
Autism Spectrum Disorder Surveillance in Québec

In addition, there has been no validation study for ASD, but there are studies showing that, in general,
the diagnosis recorded in the medical file corresponds very well to that recorded for the
administrative databases for other diseases in Québec (Jean et al., 2012; Ouhoummane, 2010).

Institut national de santé publique du Québec                                                             25
Autism Spectrum Disorder Surveillance in Québec

5        Conclusion
This report confirms that diagnosed ASDs have risen steadily in terms of prevalence and incidence
and that they vary considerably across regions. It also demonstrates the QICDSS’s capacity to
identify concomitant diseases and their associated risk factors. Furthermore, the measurement of
health services utilization (for mental and other health reasons) across the life trajectory of this
disorder beginning in the first years of life may shed light on the specific needs of people with ASDs
and on possible deficits in the service offer.

The results of this report have diverse implications. First of all, they provide an unprecedented view of
ASD in Québec based on the new monitoring indicators developed under the framework of the
QICDSS. In addition, they provide numerous paths for future research. These include exploring the
etiology of ASD and the excess mortality in individuals with ASD, and identifying the social
determinants of health that may contribute to the deterioration of the physical and mental health of
people with ASD.

Institut national de santé publique du Québec                                                             27
You can also read