Emission of Air Pollutants from Rice Residue Open Burning in Thailand, 2018 - MDPI
←
→
Page content transcription
If your browser does not render page correctly, please read the page content below
atmosphere
Article
Emission of Air Pollutants from Rice Residue Open
Burning in Thailand, 2018
Agapol Junpen 1,2 , Jirataya Pansuk 3, *, Orachorn Kamnoet 1 , Penwadee Cheewaphongphan 4
and Savitri Garivait 1,2
 1   The Joint Graduate School of Energy and Environment (JGSEE), King Mongkut’s University of Technology
     Thonburi (KMUTT), Bangkok 10140, Thailand; agapol.jun@kmutt.ac.th (A.J.);
     orchorn.kam@kmutt.ac.th (O.K.); savitri@jgsee.kmutt.ac.th (S.G.)
 2   Center of Excellence on Energy Technology and Environment (CEE–PERDO), Ministry of Education,
     Bangkok 10140, Thailand
 3   Faculty of Environment and Resource Studies, Mahidol University, Phutthamonthon,
     Nakhon Pathom 73170, Thailand
 4   National Institute for Environmental Studies (NIES), 16–2 Onogawa, Tsukuba, Ibaraki 305-8506, Japan;
     penwadee.chee@nies.go.jp
 *   Correspondence: jirataya.pan@mahidol.ac.th; Tel.: +66-92-415-4264

 Received: 30 August 2018; Accepted: 12 November 2018; Published: 15 November 2018

 Abstract: Crop residue burning negatively impacts both the environment and human health, whether
 in the aspect of air pollution, regional and global climate change, or transboundary air pollution.
 Accordingly, this study aims to assess the level of air pollutant emissions caused by the rice residue
 open burning activities in 2018, by analyzing the remote sensing information and country specific data.
 This research also aims to analyze the trend of particulate matter 10 microns or less in diameter (PM10 )
 concentration air quality sites in provinces with large paddy rice planting areas from 2010–2017.
 According to the results, 61.87 megaton (Mt) of rice residue were generated, comprising 21.35 Mt
 generated from the irrigated fields and 40.53 Mt generated from the rain-fed field. Only 23.0% of the
 total rice residue generated were subject to open burning—of which nearly 32% were actually burned
 in the fields. The emissions from such rice residue burning consisted of: 5.34 ± 2.33 megaton (Mt) of
 CO2 , 44 ± 14 kiloton (kt) of CH4 , 422 ± 179 kt of CO, 2 ± 2 kt of NOX , 2 ± 2 kt of SO2 , 38 ± 22 kt
 of PM2.5 , 43 ± 29 kt of PM10 , 2 ± 1 kt of black carbon (BC), and 14 ± 5 kt of organic carbon (OC).
 According to the air quality trends, the results shows the higher level of PM10 concentration was due
 to the agricultural burning activities, as reflected in the higher monthly averages of the months with
 the agricultural burning, by around 1.9–2.1 times. The result also shows the effect of government’s
 policy for farmers on the crop burning activities and air quality trends.

 Keywords: biomass open burning; straw burning; air pollution; particulate matter; air quality

1. Introduction
     Thailand is an agricultural country with rice as the main economic crop that is planted spatially
across the country, as illustrated in Figure A1a. Rice plantation covers a total area of approximately
9.73 million hectares (Mha), 15.1% of which are located in the central region, 60.9% in the northeastern
region, 22.6% in the northern region, and 1.4% in the southern region [1]. The central region has the
highest frequency of rice plantation at the rate of 2–3 rounds per year, as well as the highest yield due to
the relatively high abundance of water resource and soil nutrients when compared to other regions [2].
The characteristics of rice cultivation are typical in the region where broadcasting plantation and
machinery harvesting are widely used to reduce the cultivation time [3]. The major crop (in-season

Atmosphere 2018, 9, 449; doi:10.3390/atmos9110449                          www.mdpi.com/journal/atmosphere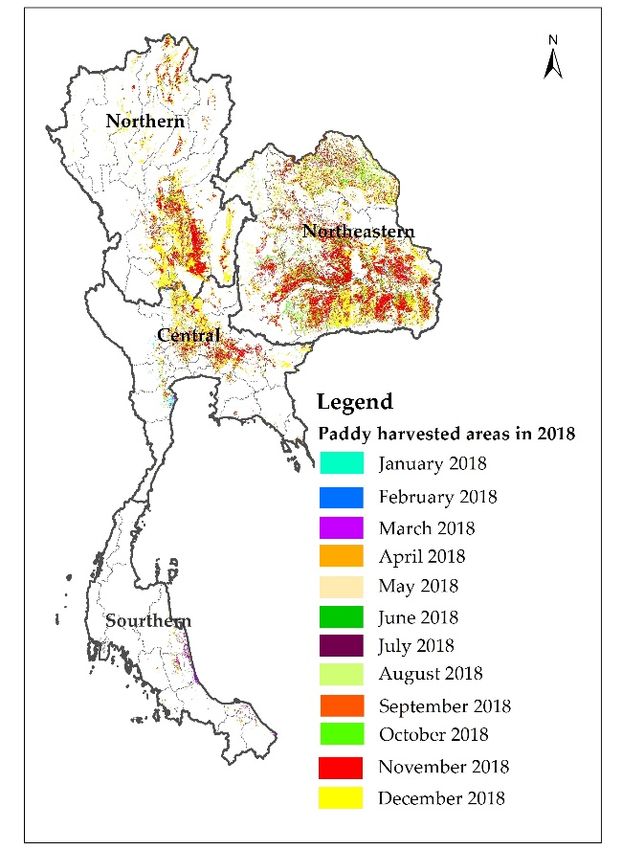
Atmosphere 2018, 9, 449                                                                              2 of 23

rice) is grown from May to October, except in the six southern provinces where the growing season is
from mid-June to February of next year. The off-season rice typically grown in the dry season from
November to April, and from March to mid-June in the southern provinces. The majority of off-season
rice are produced in the central region, which is equipped with an irrigation system that is specifically
designed for rice production [4]. According to the 2017 Agricultural Statistics of Thailand derived
from the Office of Agricultural Economics (OAE) [5], the total rice production in Thailand in 2017
was 31.95 million tons (Mt), comprising 24.07 Mt of in-season rice products and 6.62 Mt of off-season
rice products. The trends of planted area and rice production from in-season rice and off-season rice
plantation in Thailand during 2010–2017, as shown in Table A1.
      Concerning the fact that there is a very short period between harvesting and cultivation of rice
or crop rotation, particularly in the central and lower northern regions of Thailand, rice residue
burning is therefore a common residue management practice amongst Thai farmers. Many farmers
believe that residue burning has beneficial effects on the yields and primarily adopt such practice
in order to remove waste residue, control weeds, and release nutrients for the next crop cycle [6–8].
Nonetheless, agricultural residue burning has negative impacts on the environment, specifically air
pollution and climate change. The incomplete combustion of biomass produces BC, which is the
second largest contributor to global warming after carbon dioxide [9,10]. Furthermore, the emissions
of BC and other types of aerosols also give rise to atmospheric brown clouds in Southeast Asia [11–13],
especially in northern peninsular Southeast Asia [14–17]. In general, atmospheric brown clouds and
their interactions with greenhouse gases can significantly affect the climate, hydrological cycle, glaciers,
agriculture, and human health [16,18,19]. Indeed, rice straw burning is an important source of aerosol
particles, such as coarse particles (PM10 , aerodynamic diameters ≤ 10 microns (µm)) and fine particles
(PM2.5 , aerodynamic diameters ≤ 2.5 µm) [20].
      According to the Pollution Control Department (PCD)–the authority in charge of air quality
assessment in Thailand, in 2017 [21], the PM10 concentration was in the range of 3–268 micrograms per
cubic meter (µg/m3 ), on average, for the 24 h period (daily standard 120 µg/m3 ) and 20–103 µg/m3
for the annual period, which brings the nationwide average to 41 µg/m3 (average standard 50 µg/m3 ).
Since 2012, the PM10 level in all areas across Thailand has been on a declining trend. In addition,
the PM2.5 concentration is reported to be in the range of 2–166 µg/m3 , on average, for the 24 h period
(daily standard 50 µg/m3 ) and in the range of 9–36 µg/m3 , for annual average which brings the
nationwide average to 22 µg/m3 (average standard 25 µg/m3 ). Furthermore, it is reported that in
Chiang Mai, a province situated in the northern region of Thailand where during summer, a large
number of biomass open burning activities could be found, that the number of days which the level of
PM2.5 concentration exceeded the daily standard was reduced by 57 days to 29 days, compared to that
in 2016. In 2017, the PM2.5 annual average was 30 µg/m3 .
      With respect to the foregoing environmental and health effects of rice straw burning,
open-field straw burning is strictly regulated in Thailand and has been banned in some regions.
In 2002, the Association of Southeast Asian Nations (ASEAN) Agreement on Transboundary Haze
Pollution [22], a legally binding environmental agreement, was signed by the member states of the
Association of Southeast Asian nations to reduce haze pollution in Southeast Asia. Accordingly,
in 2012, the government of Thailand prescribed the Pollution Management Plan 2012–2016 [23] to
serve as a guideline for open burning and to promote alternative methods of agricultural residue
management. The Pollution Control Department (PCD) will be responsible for implementing this
environmental quality management plan in collaboration with the local administrative organizations.
Moreover, the government also provides subsidies to farmers in order to encourage the adoption
of soil equipment and farming technology, with the aim to reduce crop residue burning. Similarly,
the Department of Alternative Energy Development and Efficiency (DEDE) has implemented the
renewable energy plan to promote the use of agricultural residues as a raw material for heat and
electricity production [24].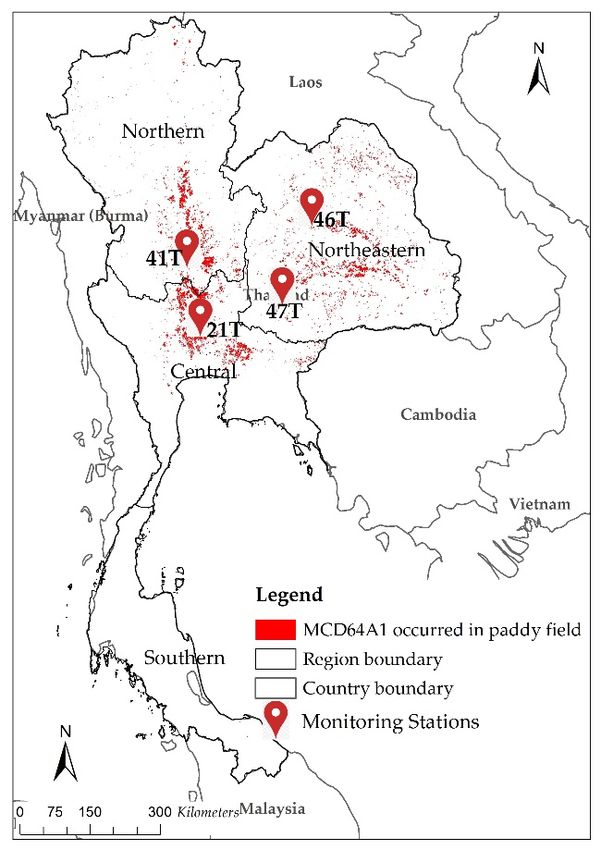
Atmosphere 2018, 9, 449                                                                              3 of 23

     On the contrary, during 2011–2014, the government had been implementing “the Rice Pledging
Scheme” to provide subsidies for the rice farmers [25]. Under this scheme, the government pledged
to purchase rice both in-season and off-season, at 15,000 baht per tonnage—double the market price
at the time before the start of the program. Consequently, a large number of farmers had joined the
program and the off-season rice output increased from 8.86 million tonnages in 2010 to 10.14 million
tonnages and 12.22 million tonnages in 2011 and 2012, respectively [5]. After the end of the program
in 2015–2017, the government had the policy to reduce the off-season rice planted area, and in turn,
promote production of other crops by offering a subsidy of 12,500 baht per hectare to the farmers.
This resulted in a staggering 40% drop of the rice price, in comparison with 2014 [26]. It is observable
that the government’s measure implementation for farmers affects the rice growing area, rice residue
amount, rice residue management, all of which cast direct impact on air quality in each region,
especially the particulate matters which is one of many pollutants that contribute to reduced air
quality. This research, therefore is carried out with the aim to analyze the trend of PM10 concentration
air quality, based on the remote sensing information and air quality data collected from air quality
monitoring stations in area with large rice production from 2010–2017. In addition, this research
also aims to assess the level of air pollutant emissions (CO2 , CH4 , CO, NOX , SO2 , PM2.5 , PM10 , BC,
and OC) caused by the open-space rice straw burning activities in 2018, by analyzing the remote
sensing information and country specific data, in order to present a result as accurate as possible.

2. Materials and Methods

2.1. Assessment of Emissions from Rice Residue Open Burning
     The emissions from biomass open burning can be estimated using the equation developed by
Seiler, W. and Crutzen, P. J. (1980) [27], which represents the relationship between the combustion
process and its emission, as follows:

                                          Ei = M × EFi × 10−6                                           (1)

where Ei is the emission of the air pollutant i (kt); M is the mass of dry matter burned (t of dry matter);
and EFi the emission factor of the air pollutant i (g/kg of dry matter burned).
     The amount of biomass burned is determined using the modified version of the equation provided
in the Revised 1996 Intergovernmental Panel on Climate Change (IPCC) Guidelines for National
Greenhouse Gas Inventories [28] which was also used in the studies of Streets D. G. et al. (2003) [29],
Gadde B. et al. (2009) [8], Cheewaphongphan, P. and Garivait, S. (2013) [2], and Kim Oanh, N. T. et al.
(2018) [30], etc. The equation can be expressed as follows:

                                             M = RRB × α                                                (2)

where RRB is the quantity of rice residue subject to open field burning (t of dry matter); and α is the
fraction of the mass combusted by fire, also known as the combustion factor (unitless).
     Recently, various studies reported the emission factors measured in laboratory or field
measurements, often varied widely in different experiments, as summarized in Table 1. In brackets
are the all emission factors values derived by Kim Oanh, N. T. et al. (2011) [31], except SO2 derived
from Kim Oanh, N. T. et al. (2015) [32]. The field burning experiments were conducted in the
Pathum thani province which is located in the central part of Thailand. Zhang, Y. et al. (2013) [33]
measured the emission factors of CO2 , CO, PM10 , PM2.5 , and OC for burning rice straw residues in
flaming and smoldering combustion in the Pearl River Delta Region, China. Ni, H. et al. (2015) [34]
used the laboratory burn tests which were conducted using a custom-made combustion chamber to
estimate the emission factors of CO2 , CO, PM2.5 , and OC of rice straw residues burning in China.
Hays M. D. et al. (2005) [35] suggested the value of emission factor of PM2.5 and OC from simulated
agricultural fires of surface residuals of rice straw in the Sacramento Valley Region of California,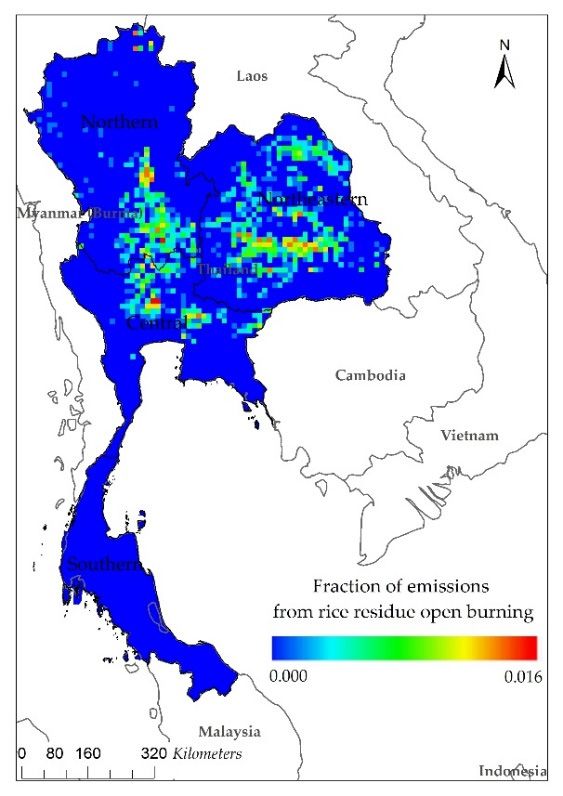
Atmosphere 2018, 9, 449                                                                                                        4 of 23

USA. Andrea, M. O. and Merlet, P. (2001) [36] reported the value of emission factors of CO2 , CH4 ,
NOX , PM2.5 , PM10 , BC, and etc. for agricultural open burning by extrapolation from the best value.
Akagi, S. K. et al. (2011) [37] used the overall averages of emission factors for mechanized agriculture
from Yokelson, R. J. et al. (2011) [38] and manually piled agriculture from Christian, T. et al. (2003) [39].
Yokelson et al. (2011) [38] reported emission factors from airborne measurements of six crop residue
fires related with mechanized agriculture in the Yucatan, Mexico. While, Christian, T et al. (2003) [39]
measured the mostly smoldering emissions from three laboratory fires burning manually piled rice
straw in Indonesian. The emission factors from the manual and mechanical farming are weighted to be
3:14 ratio of manual to mechanized harvesting from applying for the continental scale. Kanokkanjana,
K. and Garivait, S. (2010) [40] developed the emission factor of CO2 , CO, and PM2.5 for rice residue
burning by field experiment in Thailand during 2007 to 2010. However, the emission factors from recent
or local measurements were employed in this study derived from Kim Oanh, N. T. et al. (2011) [31]
and Kim Oanh, N. T. et al. (2015) [32], concerning the fact that it represents the average emission
factor of rice straw burning of Thailand for all emission species focused in this study. The emission
factors were estimated to be 1177 ± 140 g/kg for CO2 , 93 ± 10 g/kg for CO, 0.49 ± 0.21 g/kg for
NOX , 0.51 ± 0.32 g/kg for SO2 , 8.3 ± 2.2 g/kg for PM2.5 , 9.4 ± 3.5 g/kg for PM10 , 0.53 g/kg for BC,
and 3.1 g/kg for OC.

                                    Table 1. Value of emission factors in each trace gas.

                                                             Emission Factor, EF
                    Trace Gases
                                                (G of Trace Gases Per Kg Dry Matter Burned)
                           CO2         (1177 a ), 1105.2 c1 , 1024 c2 , 1393 d , 1515 f , 1585 g , 1185 h , 1160 i
                          CH4                                      9.6 a , 2.7 f , 5.2 f
                           CO              (93 ), 53.2 , 110.6 c2 , 57.2 d , 92 f , 102 g , 132.2 h , 34.7 j
                                                a        c1

                          NOX                          (0.49 a ), 3.83 c1 , 2.62 c2 , 2.5 f , 3.11 g
                           SO2                                           (0.51 b )
                          PM2.5            (8.3 ), 12.1 , 18.3 , 8.5 d 12.95 e , 3.9 f , 6.26 g , 27.63 h
                                                 a       c1        c2

                          PM10                          (9.4 a ), 14.0 c1 , 20.6 c2 , 13.0 f , 3.7 j
                           BC                                       (0.53 a ), 0.69 f
                           OC                         (3.1 a ), 10.53 c1 , 8.77 c2 , 3.3 d , 8.94 e
      Note: in brackets are the all emission factors values used for this study derived by a Kim Oanh, N. T. et al. (2011) [31],
      except SO2 derived from b Kim Oanh, N. T. et al. (2015) [32]; c Zhang, Y. et al. (2013) [33] measured the emission
      factors in c1 flaming and c2 smoldering combustion; d Ni, H. et al. (2015) [34]; e Hays M. D. et al. (2005) [35];
      f Andrea, M. O. and Merlet, P. (2001) [36]; g Akagi S. K. et al. (2011) [37]; h Kanokkanjana, K. and Garivait, S.

      (2010) [40]; i Jenkins, B.M. and Bhatnagar, A.P. (1991) [41]; j Kadam, K.L. et al. (2000) [42].

2.2. Assessment of Rice Residue Subjected to Open Field Burning
     This study assesses the quantity of rice residue that are subjected to open burning by using
Equations (3) and (4), which following the generic methodology that the national greenhouse gas
inventories (IPCC, 2006) [43] uses for estimating of greenhouse gas emissions from fire. The amount
of fuel or agricultural residue that can be burned is given by the burned area and the density of
agricultural residue present on that area. The burned area was estimated from the production between
the rice harvested area and the fraction of the rice residue subjected to open burning [2]. The fuel
density of rice residue can include the rice straw and stubble, which vary as a function of the rice
varieties, paddy field location (this study used the provincial boundaries) and irrigation systems.

                                         RRB =      ∑m ∑r ∑w ( RRGmrw × FBrw )                                                     (3)

                                                         ∑r ∑ p

                                          RRGmrw =                  H Ampw × RD pw                                                 (4)

where:

      RRB is the rice residue subjected to open burning in the field (t);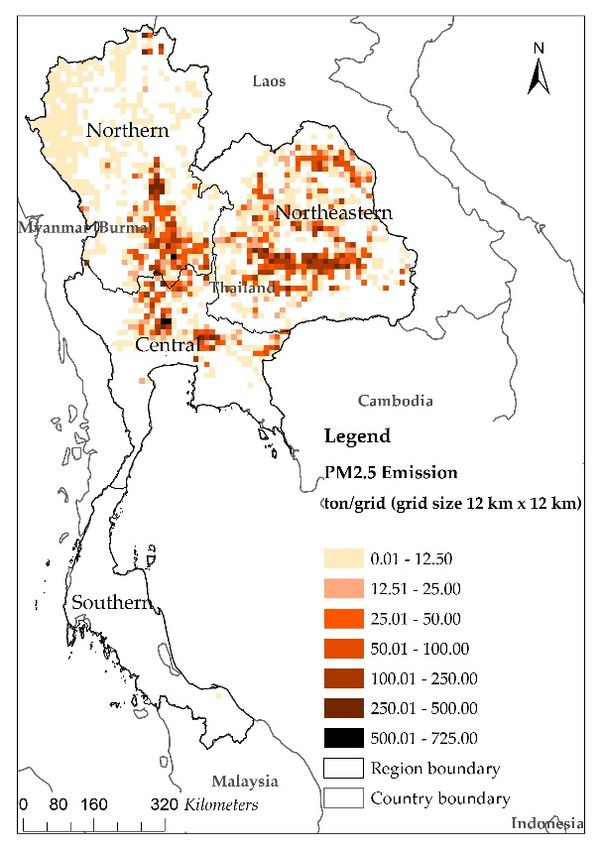
Atmosphere 2018, 9, 449                                                                              5 of 23

      m, r, p, w are months, regions, provinces, and irrigation systems, respectively;
      RRG is the amount of rice residues generated in the field (t);
      H A is the rice harvested area from January to December 2018 (ha);
      RD is the average amount of rice residue per unit area, also known as biomass load (t/ha);
      FB is the fraction of rice residue subjected to open burning (unitless).

      There are three main information points about the assessment of rice residue subjected to open
field burning, which comprise the rice harvested area, the amount of rice residue per unit area, and the
fraction of rice residue subjected to open burning.

2.3. Assessment of Rice Harvested Area (HA)
     The Geo–Informatics and Space Technology Development Agency (GISTDA), Thailand [44] has
developed a system to evaluate the rice plantation areas for forecasting the rice harvested areas and
rice production every two weeks, with the objective to provide information pertaining to farming
production management for the future. This study used this information to assess the spatial and
temporal distribution of rice harvested areas in 2018, which was obtained from the sensor on board
both the Terra and Aqua satellites, known as the Moderate Resolution Imaging Spectroradiometer
(MODIS). The rice plantation areas from September 2017 to August 2018 and forecasted the harvesting
areas from January 2018 to December 2018 was tracked, which corresponded to the mature rice age of
about 4 months after planting. The study further evaluated the spatial and temporal allocation of the
rice harvested areas, as shown in Figure A1b.

2.4. Rice Residue Density (RD)
      This study used the results of Cheewaphongphan P. et al. (2018) [45] which estimated the rice
residue density in each provinces and irrigation systems. Their research developed the average density
of rice residue in 14 rice varieties which reported that the density of rice residue lay in the range of
4.18 ton per hectare (t/ha) to 8.02 t/ha (dried weight), with an average value of 5.81 t/ha. The results
also reported the stubble residue density lay within the range of 1.72 t/ha to 3.41 t/ha, while the straw
residue density was between 2.45 t/ha and 4.61 t/ha. Accordingly, it can be inferred from these results
that the quantity of rice straw to the gross rice residue was approximately 60%.
      According to their results, the average rice residue density in 14 rice varieties was used to
categorize the average rice residue density by province (77 provinces) and irrigation systems (irrigated
field and rain-fed field). The rice residue density of each variety was multiplied by the percentage
share of the planting area for each rice variety in each province, which was obtained from the report
of the OAE on “Rice plantation area, rice harvesting area, product, and yield of rice classified by rice
varieties, regions, and provinces in 2015” [40]. The obtained value of each province was close to the
range of 4.81 t/ha to 7.10 t/ha for irrigated fields, while for rain-fed fields lay within the range of
5.85 t/ha to 6.84 t/ha. The average rice residue density was due to the similarity of the rice varieties
grown in each province which demonstrated the unique characteristics of rice cultivation in each area,
as illustrated in Figure A2a,b.

2.5. The Fraction of Rice Residue Subjected to Open Burning (FB)
     This study used the fraction of rice residue subjected to open burning from the result of
Cheewaphongphan P. et al. (2018) [45]. Their study used the questionnaire survey as a tool to
observe the farming behaviors in Thailand during 2015/2016. A survey was conducted with the
objective to compute the fraction of rice residue subjected to open burning (FB), the fraction of unused
residue left in the field, and the fraction of rice residue used for other purposes as fermentation, animal
feed, mushroom plantation, sold rice straw to baler operator, and baling rice straw for own used.
For sampling distribution of the sample, they collected the questionnaire from the top 16 provinces
(5 provinces from central, 6 provinces from north eastern, 4 provinces from northern, and 1 province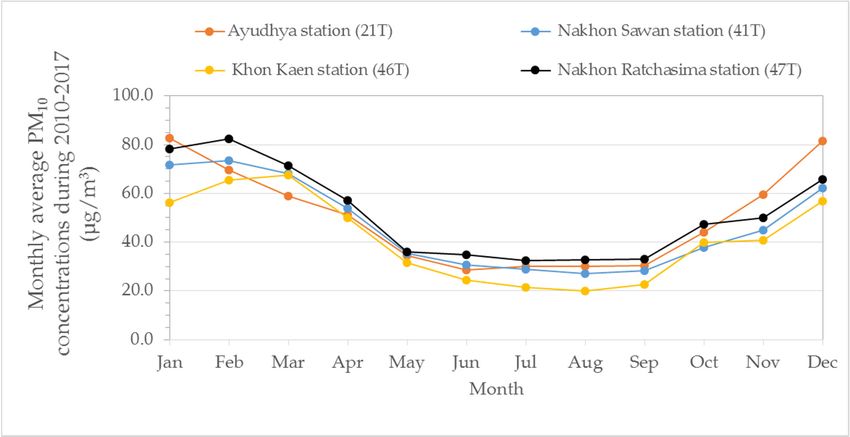
Atmosphere 2018, 9, 449                                                                            6 of 23

from southern) which ranked by the Office of Agricultural economics (OAE) [46] that encountered the
number of farmers who planted the rice in rain-fed and irrigated area (see Figure A1a).
      According to their report, for the rice residue management in irrigated plantation area, nearly
one-half of the rice residue was used for utilization. Approximately, one-fourth of the rice residue
was open burning in the field, and about one-fourth of the rice residue was left in the field.
Meanwhile, the rain-fed plantation area, nearly 60% of the total rice residue was used for utilization,
whereas one-fifth of the rice residue was managed both left in the field and open-burned in the
field. Briefly, the fraction of rice residue subjected to open burning in the irrigated field for the
central, northern, northeastern and southern regions of Thailand was about 0.36 ± 0.008, 0.20 ± 0.006,
0.01 ± 0.002, and 0.0, respectively. While, for the rain-fed field, the value was about 0.18 ± 0.006,
0.26 ± 0.007, 0.21 ± 0.007%, and 0.02 ± 0.002, respectively.
      The value of fraction of rice residue subjected to open burning used in this study were compared
with those from three research papers (Gadde, B. et al., (2009) [8], Cheewaphongphan, P. and Garivait, S.
(2013) [2], and Kim Oanh, N. T. (2018) [30]), which examined the behaviors of farmers in Thailand
by using a questionnaire survey. In the dry season, Kim Oanh, N. T. (2018) [30] reported the value of
0.90 for crops harvested in the central obtained from the Asian Institute of Technology (AIT) survey
results by Tipayarom, D. and Kim Oanh, N. T. (2007) [47], while for crops harvested in the other regions,
the value is typically 0.48 from the report of Department of Alternative Energy Development and
Efficiency (DEDE), Thailand in 2003. In the wet season, the value is usually 0.25 for crops harvested
in the whole country obtained from The Sustainable Mekong Research Network (SUMERNET) [48].
While, Gadde, B. et al. (2009) [8] reported that the fraction of rice residue subjected to open burning
for the whole country was also equal to 0.48 obtained from the report of Department of Alternative
Energy Development and Efficiency (DEDE), which was used to explain the farmers’ behaviors in
2003. In later years, Cheewaphongphan, P. and Garivait, S. (2013) [2] employed the random sampling
method to study the farmers’ behaviors in Thailand. The fraction of rice residue subjected to open
burning was lay in the range of 0.16 to 0.79 varied from a region (an average equal to 0.45). According
to the results of Cheewaphongphan P. et al. (2018) [45], the fraction of rice residue subjected to open
burning was presently in the range of 0–0.36 (an average of 0.25 for irrigated field, 0.22 for rain-fed
field and 0.23 for whole country), which substantially decreases from the value of the previous studies.
This information indicates that the changes in the farmers’ behaviors are as a result of the government
policy that discourages the open burning of agricultural residues. Moreover, farmers now have various
options to exploit the rice residue, such as selling them to baler operators and baling them for personal
use. However, the addition of information for supporting the changes in the farmers’ behaviors was
discussed in the topic of spatial and temporal distribution of rice residues open burning (Section 3.4).

2.6. The Combustion Factor (α)
      The amount and species of emissions emitted from the open burning of rice residue depend on the
quantity of rice residue combustion, which also varies by seasonality. During the dry season, the paddy
fields and rice residue have a low level of moisture content, resulting in a higher fraction of residue
consumed by fire and a more complete combustion when compared to the wet season. However,
the fraction of rice residue combusted also depends on farmers’ burning behaviors. Concerning the
fact that completely burned rice straws increase tillage efficiency and reduce the need for herbicides
and pesticides in preventing diseases, weeds, and pests, the majority of farmers employ the foregoing
burning technique for land preparation.
      According to the study of Cheewaphongphan P. and Garivait S. (2013) [2], the survey results
is used to estimate the fraction of the mass of rice residue combusted by fire (α). Their research
developed the combustion factor which based on the field experiments related to rice residue burning
characteristics classified by regions and type of residues (straw and stubble). The average combustion
factor (α) in the central, northern, northeastern, and southern regions was calculated to be about 0.12,
0.25, 0.52, and 0.26, respectively (an average value of 0.34 for whole country).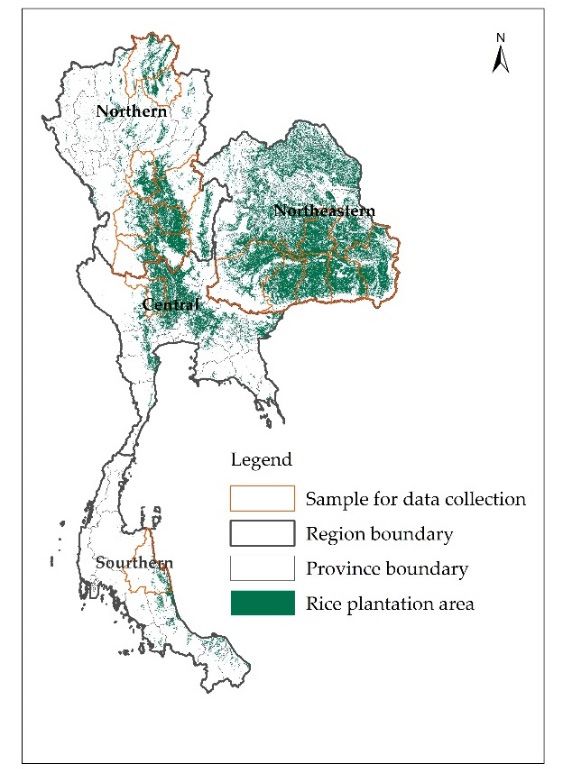
Atmosphere 2018, 9, 449                                                                              7 of 23

2.7. Assessment of the Spatial and Temporal Distribution of Emissions
     The spatial distribution of emissions from the rice residue open burning was assessed by using the
satellite information resulting from Monthly Burned Area Product (MCD64A1). This product created
on an automatic system using 500 m MODIS imagery and 1 km MODIS active fire observations which
covered five layers as follow: the burn date, the burn date uncertainty, the quality assurance, and first
day and last day. The data of MCD64A1 obtained from Land Processes Distributed Active Archive
Center managed by the NASA Earth Science Data and Information System (ESDIS) project [49].
     During 2010 to 2017, the burned area data from MCD64A1 was only focused on paddy field which
obtained from the land use map of Thailand in 2014 [1] (Figure A3a). The annual fraction of burned
area per grid was calculated from the total of burned area in each grid (12 km × 12 km) divided by
the total of burned area for whole country. The emission of air pollutant maps from rice residue open
burning are allocated to each grid cell on the basis of the fraction of burned area, which presented in the
form of a yearly 12 km × 12 km gridded. Finally, the monthly temporal distribution of emissions was
calculated by the amount of rice residue burned in each month, multiplied with the emission factors.

2.8. Air Quality Analysis
     In this research, with the objective of PM10 concentration air quality data assessment from
2010–2017, four air quality monitoring station sites have been selected [50], based on the criteria that
the sites are located in the provinces with large rice production area where there are in-season and
off-season rice production. The in-season only sites are located in the north eastern region, namely
the Khon Kaen Air Monitoring Station (46T) and Nakhon Ratchasima Air Monitoring Station (47T).
The sites with both in-season and off-season rice production are Ayutthaya Air Monitoring Station
(21T) in the central region and Nakhon Sawan Air Monitoring Station (41T) in the Lower part of
Northern region, as shown in Figure A3a.

3. Results and Discussion

3.1. Amount of Rice Residue Generated in the Field (RRG)
     According to the data from GISTDA project [44], the total rice harvested area (HA), planted from
September 2017 to August 2018 and harvested from January 2018 to December 2018, was expected
to be about 11.03 Mha, containing the irrigated area at 3.93 Mha or 36% of the total rice harvested
areas and the rain-fed area at 7.11 Mha or 64%. The rice harvested areas in the central, northern,
northeastern, and southern regions was about 2.37 Mha (21.5%), 3.03 Mha (27.5%), 5.48 Mha (49.7%),
and 0.15 Mt (1.4%), respectively (Table A2).
     From Equation (4), after harvesting a rice crop, the amount of rice residue generated in the field
(RRG) was approximately 61.87 Mt, which comprised 21.35 Mt (34.5%) generated from the irrigated
areas and 40.53 Mt (65.5%) generated from the rain-fed field. The amount of rice residue generated
in the field (RRG) in the central, northern, northeastern, and southern regions was 13.04 Mt (21.1%),
16.86 Mt (27.3%), 31.14 Mt (50.3%), and 0.83 Mt (1.3%), respectively.
     Considering the aspect of seasonality (Table A2), the peak period of rice residue generated
was during September to December, which encompassed the value of 4.24 Mt, 11.84 Mt, 20.37 Mt,
and 8.35 Mt, respectively, which corresponded to the harvesting season of in-season rice. While,
the second peak period was during January to May, the amount of rice residue generated in the field
(RRG) was about 1.91 Mt, 3.23 Mt, 1.11 Mt, 3.38 Mt, and 4.42 Mt, respectively, which corresponded to
the harvesting time of off-season rice.

3.2. Rice Straw Residues Subjected to Open Burning (RRB) and Burned in the Field (M)
     According to the Equation (3), the amount of rice residue subjected to open burning (RRB) was
about 14.23 Mt (in the range of 12.82 and 14.63 Mt), consisting of 4.34 Mt (varied from 4.24 to 4.43 Mt),
4.07 Mt (varied from 2.95 to 4.19 Mt), 5.82 Mt (varied from 5.62 to 6.00 Mt), and 0.006 Mt (varied from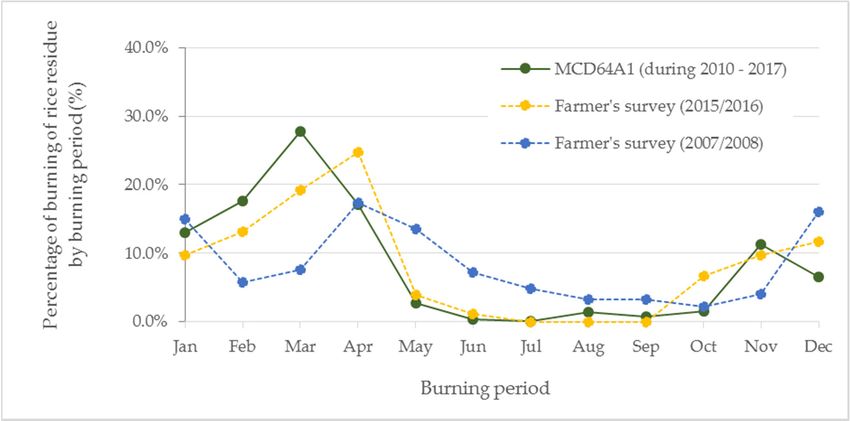
Atmosphere 2018, 9, 449                                                                              8 of 23

0.005 to 0.007 Mt) for the central, northern, northeastern, and southern regions, respectively. Based on
this information, the average amount of rice residue subjected to open burning was only 23.0% of the
total rice residue generated in the paddy field (in the range of 20.7% and 23.6%), which comprised
5.20 Mt (4.05–5.33 Mt) from the irrigated fields and 9.03 Mt (8.76–9.30 Mt) from the rain-fed field.
      Considering the amount of rice residue burned in field (M), from Equation (2), it can be concluded
that the amount of rice residue burned in field (M) was about 4.54 Mt (varied from 2.86 Mt to
5.79 Mt), consisting of 0.53 Mt, 1.00 Mt, 3.00 Mt, and 0.002 Mt for the central, northern, northeastern,
and southern regions, respectively (Table A2.). The result was obviously lower than the values obtained
from the previous studies at the range of 6.85–12.55 Mt/year [2,8,29,30].

3.3. Emissions from Rice Residue Open Burning (E)
      In 2018, from Equation (1), the actual amount of emissions from rice residue open burning were
approximately 5.34 ± 2.33 Mt of CO2 , 44 ± 14 kt of CH4 , 422 ± 179 kt of CO, 2 ± 2 kt of NOX , 2 ± 2 kt
of SO2 , 38 ± 22 kt of PM2.5 , 43 ± 29 kt of PM10 , 2 ± 1 kt of BC, and 14 ± 5 kt of OC. The percentage of
emissions by region, it was found that the central, northern, northeastern, and southern regions of
Thailand contributed to 11.70%, 22.06%, 66.21% and 0.03% of all emissions, respectively. The ranking
of provinces in Thailand that encountered problems of emissions from rice residue open burning is
illustrated in Table A3. According to the ranking, the top 10 provinces with critical problems of rice
residue open burning were Nakhon Sawan, Roi Et, Khon Kaen, Nakhon Ratchasima, Sakon Nakhon,
Suphan Buri, Phichit, Mahasarakham, Auttaradit, and Phitsanu Lok, sequentially. These provinces
entail effective mitigation measures to reduce the amount of air pollutant emissions from rice residue
open burning.

3.4. Spatial and Temporal Distribution of Rice Residues Open Burning
      The fire data from remote sensing information is suitable for analyzing the trends and variability
of fire emissions, especially the regional scale [51,52]. In this study, the MCD64A1 burned product
during 2010 to 2017 was used to estimate the paddy field areas burned in Thailand. The annually
temporal distribution of burned area occurred in the paddy field area in Thailand is presented in
Figure 1. In late 2011, when the Thai government introduced the Rice Pledging Scheme for rice farmers,
a significant number of farmers have joined the program [25]. This resulted in the 12% year over year
growth (YoY) expansion of off-season rice production area (see the secondary axis of Figure 1) [5],
as well as the number of crop-growing cycles in 2012. Instead of only one off-season cycle, the farmers
planted an additional cycle, by immediately starting a new cycle after one another. In order to speed
up the process and reduce time between cycles, the farmers chose to burn the rice straw in their own
fields. Based on the data obtained from MODIS satellite, the size of the burned rice areas increased
from 275 thousand ha (in 2010) and 284 thousand ha (in 2011) to 465 thousand ha in 2012 (64% YoY),
there were significant increases in March (see Table A4). At the end of the Rice Pledging Scheme for the
in-season crop in 2015, the government then turned to promote the production of other crops instead
of the off-season rice production [24]. As a result, in 2016, the size of the off-season rice area dropped
drastically by 66% YoY in comparison to 2014 [5]—prior to the start of the scheme, which also brought
the total area with burning activities down to the similar level of that prior to the beginning of the rice
pledging scheme (2010–2011).
      Moreover, since 2012, the burned area tended to decrease continuously by the average reduction
rate of 8.7% annually, which also resulted from the Pollution Control Plan 2012–2016 [23] was
implemented by the Pollution Control Department (PCD) to mitigate emissions from agricultural
residue open burning by imposing ban on crop residue burning and promoting the utilization of
agricultural residues for various purposes, including agricultural and energy-related purposes [24].
The result shows the correlation between the government’s policy for farmers and the total rice
production area with burning activities in each year.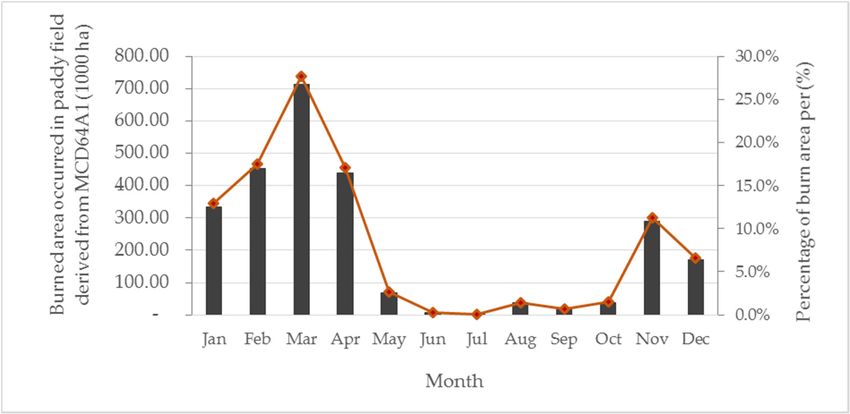
Atmosphere 2018,
Atmosphere 2018, 9,
9, 449
x FOR PEER REVIEW 22
9 of 23
Atmosphere 2018, 9, x FOR PEER REVIEW 9 of 22
Figure 1. Annually temporal distribution of burned area occurred in the paddy field area derived by
MCD64A1
Figure 1. Annually
product temporal distribution
and planted of burnedrice
area of off-season areain occurred
Thailand in the paddy
during field area derived by
2010–2017.
planted area
MCD64A1 product and planted area of
of off-season
off-season rice
rice in
in Thailand
Thailand during
during 2010–2017.
2010–2017.
The result of this section suggests that the data of the burned area obtained from remote sensing
couldThe be result
applied, of this section
in order to suggests
understand thatthethefarmer’s
data of the riceburned area obtained
straw burning fromGiven
behavior. remotethat sensing
data
could be applied, in
collection by surveying theto order to understand
understand
farmers on theirthe farmer’s
therice
farmer’s rice straw burning behavior.
straw burning activities will require a large budget Given that data
collection
collection
and a long by
bytimesurveying
surveying
to gather the
thefarmers
farmers
the onontheir
their
information, rice
ricestraw
straw
especially burning
burning
for largeactivities
areas.will
activities require
will
This require
researcha large
ahas budget
large and
budget
taken the
aand
long a time
long to
timegather
to the
gatherinformation,
the especially
information, for
especially large areas.
for large
approach to compare the result obtained from the satellite information and the result based on This research
areas. This has taken
research the
has approach
taken the
to compareto
approach
surveying. Itthe
is result obtained
compare
shown the
in theresult from
comparison the satellite
obtained that the information
from the satellite
results between and thetwo
information
the result based
and
methods theon
are surveying.
result
nearly based Iton
similar, is
shown
surveying.
therefore in the
ifItthe comparison
is shown
government thatcomparison
in the the results
were between
that
to initiate the two
the results
any policy tomethods
between
support theare
two
the nearly similar,
methods
farmers or are therefore theif rice
nearly similar,
to reduce the
government
therefore
straw burning if the were to initiate
government
activities, any policy
it is were
suggested to support
to initiate
that anydata
the the
policy farmers
to support
obtained from or tothereduce
the farmersthe
satellite orrice
could straw
to reduce
also beburning
the rice
applied
activities,
straw itdetermine
burning
to initially is activities,
suggested that
theitfarmer’sthe data
is suggested obtained
thatofthe
pattern from
data
burning the satellite
obtained
activities. from could also be
the satellite applied
could also tobe initially
applied
determine
to initially
Accordingthe farmer’s
determine to thethe pattern
farmer’s
MCD64A1 of burning
pattern
burnedof activities.
burning
area product,activities.
the monthly cumulative of burned area
According
According
occurred in paddy to the
to fieldMCD64A1
the MCD64A1 burned
during 2010burned area
to 2017 is product,
area product,
presented the monthly
the monthly
in Figure cumulative
2. ofburned
cumulative
The overall burned area
of area
burnedoccurred
area
in paddy
occurred
paddyin fieldpaddy
field during
wasfield 2010
estimated to 2017
during 2010
at is to
presented
about 2017
2.57isMha in Figure
presented
with an 2. annual
in The overall
Figure 2. The burned
average overallarea
value ofoccurred
burned 0.32area in paddy
occurred
Mha/year or
field
in was
paddy estimated
field was at about
estimated 2.57
at Mha
about with
2.57 an annual
Mha with average
an value
annual
2.9% of total rice plantation area in 2018. There were two peaks for the largest part of burning. The of 0.32
average Mha/year
value of or
0.32 2.9%
Mha/yearof total
or
rice
first plantation
2.9% of total
peak wasrice area
during in January
2018. There
plantation area inwere
2018.
to April, two peaks
There
which were for two
corresponded the largest
peaks
to the part
for of largest
the burning.
harvesting part
time The first peak was
ofofoff-season
burning. The
rice
during
first
for thepeakJanuary
was during
central to April,
and lower which
January tocorresponded
northern April, whichThe
regions. to the harvesting
corresponded
second peak to wastime
the of off-season
harvesting
during timerice
November for the central
of off-season
to December, rice
and
for
which lower
the northern
central
corresponded and regions.
lower The second
to thenorthern
harvesting peak was
regions.
season The during
secondNovember
of in-season peak wasall
rice for to December,
during
regions. which
November
The largest corresponded
to December,
expanse of
to the harvesting
which
cumulativecorresponded
burned season of harvesting
to the
area was in-season
observedrice on for
season all
March, regions.
at aboutThe
of in-season 715largest
rice for all expanse
thousand regions. of
ha orThe cumulative
27.8%largest burned
expanse
of total of
area
area.was observed
cumulative burnedon March,
area at about 715
was observed thousand
on March, at ha or 27.8%
about of total burned
715 thousand area. of total burned
ha or 27.8%
area.
Figure 2. The monthly distribution of cumulative burned area occurred in the paddy field in Thailand
derived
Figure 2.from MCD64A1
The monthly during
during 2010–2017.
distribution of cumulative burned area occurred in the paddy field in Thailand
2010–2017.
derived from MCD64A1 during 2010–2017.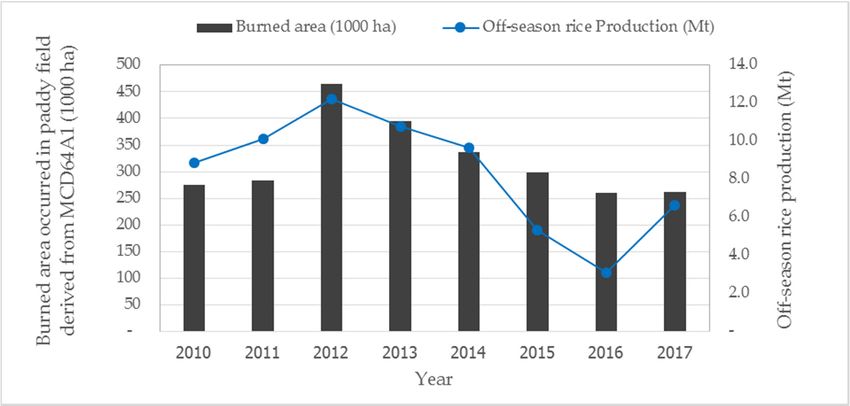
Atmosphere 2018, 9, 449 10 of 23
Atmosphere 2018, 9, x FOR PEER REVIEW 10 of 22
The
The results
results of
of monthly
monthly temporal
temporal distribution
distribution ofof rice
rice residues
residues open
open burning
burning obtained
obtained from
from
MCD64A1 were compared with those from two farmer’s survey derived
MCD64A1 were compared with those from two farmer’s survey derived from Cheewaphongphan, from Cheewaphongphan,
P.
P. et
et al.
al. (2018)
(2018) [45]
[45] in
in2015/2016 and Cheewaphongphan,
2015/2016 and Cheewaphongphan, P. P. and
and Garivait,
Garivait, S.
S. (2013)
(2013) [2]
[2] in
in 2007/2008.
2007/2008.
The
The percentage of burning of rice residue by burning period is presented in Figure 3. From farmer’s
percentage of burning of rice residue by burning period is presented in Figure 3. From farmer’s
survey
survey in in 2007/2008,
2007/2008, thethe percentage
percentage ofof burning
burning ofof rice
rice residue
residue waswas calculated
calculated from
from the
the total
total burned
burned
area
area which
which is is approximately
approximately 4.4
4.4 Mha/year
Mha/year oror 45%
45% of
of the
the paddy
paddy fields
fields area
area while
while the
the burned
burned area
area from
from
farmer’s survey in 2015/2016 is approximately 1.83 Mha/year or 23% of
farmer’s survey in 2015/2016 is approximately 1.83 Mha/year or 23% of the paddy fields. the paddy fields.
Figure 3. Comparison
Comparison of temporal
temporal variation
variation of
of rice residue open burning between the result from
MCD64A1 and farmer’s survey from previous studies [2,45].
According to the result, the monthly distribution of rice residues open burning was quite similar
which
which had hadtwo twopeaks
peaks forforthethelargest part part
largest of burning. However,
of burning. the percentage
However, of burned
the percentage of area
burnedoccurred
area
from January to April (harvesting time of off-season rice) was quite higher
occurred from January to April (harvesting time of off-season rice) was quite higher than November than November to December
(harvesting
to Decembertime of in-season
(harvesting timerice). We suggest
of in-season that
rice). Wethesuggest
results that
of burned area from
the results MCD64A1
of burned area need
from
to be validated
MCD64A1 needwithto bethevalidated
high-resolution
with the satellite products and
high-resolution ground-truthing.
satellite products andBecause the paddy
ground-truthing.
fields
Because arethe
located
paddy close
fieldsto are
the located
other crops
close(sugarcane
to the otherand maize)
crops and theand
(sugarcane deciduous
maize) and forest
thewhich were
deciduous
burned by farmer
forest which were andburnedlocalbypeople
farmerduring the period
and local people fromduringJanuary to April.
the period from January to April.
Considering the percentage of burned area with the total rice plantation area, it can be seen that
the percentage of burned burned area ≈3% of
area ((≈3% of total
total rice
rice plantation
plantation area) is rather low when compared with
the fraction of of rice
rice residue
residuesubjected
subjectedtotoopen openburning
burningwithwiththe the result
result from
from a questionnaire
a questionnaire survey.
survey. It
It can be explained that the average of farmer’s land tenure per
can be explained that the average of farmer’s land tenure per household is rather small household is rather small of 7.6 ha per
household
household [5], [5], when
whenthe thefarmers
farmersburnburntheirtheirrice
riceresidues
residuesininthethefield, thethe
field, small
smallfirefire
is poorly
is poorlydetected
detectedby
remote
by remote sensing sensors
sensing sensors(For(For
1 pixel of resolution
1 pixel fromfrom
of resolution MCD64A1
MCD64A1 ≈ 25 ≈ha) 25[53]. Moreover,
ha) [53]. Zhu, Zhu,
Moreover, C. et C.
al.
(2017) [54] reported that MCD64A1 burned areas comprised only
et al. (2017) [54] reported that MCD64A1 burned areas comprised only 13% of the reference fire13% of the reference fire product
(high
product resolution better than
(high resolution 30 m)
better in croplands
than because ofbecause
30 m) in croplands inadequate detection of
of inadequate small fires
detection (Atmosphere 2018, 9, 449 11 of 23
Atmosphere 2018, 9, x FOR PEER REVIEW 11 of 22
burning behaviors in Thailand. Likewise, this information can be used as the input data in the air
quality modeling in order to simulate air quality at the regional and national level.
From the results, the special allocation of annual PM2.5 emission in 2018 is illustrated in Figure
From the results, the special allocation of annual PM2.5 emission in 2018 is illustrated in Figure 4.
4. The regions with a high density of PM2.5 emission from rice residue open burning were central and
The regions with a high density of PM2.5 emission from rice residue open burning were central and
lower northern regions. Some parts of the lower northeastern region were also found to have a high
lower northern regions. Some parts of the lower northeastern region were also found to have a high
density ofof
density PM 2.5 emission, but a moderate density of PM2.5 emission was prevalent across the region.
PM 2.5 emission, but a moderate density of PM2.5 emission was prevalent across the region.
ForFor
other
other compounds,the
compounds, the distribution
distribution ofofgridded
griddedemissions
emissionshashas
thethe same
same pattern
pattern but difference
but difference in the in
therange
rangeofof amount
amount emissions
emissions which
which depends
depends on total
on the the total of emissions.
of emissions.
Figure 4. Spatial distribution of annual PM
2.5 emission from rice residue open burning in Thailand, 2018.
Figure 4. Spatial distribution of annual PM2.5 emission from rice residue open burning in Thailand, 2018.
This study also provides the monthly distribution of PM2.5 emission which used the amount
of This study also
rice residue provides
burned the in
in fields monthly distribution
each month of PM
(Table A2), 2.5 emission which used the amount of
multiplied with the emission factor of
rice residue burned in fields in each month (Table A2), multiplied
PM2.5 . From the result, the period that generated the highest amount withofthe
PMemission factor of PM2.5.
2.5 emission was from
From the result,
October the period
to December, that encompassed
which generated thethe highest
valueamount
of 8.23 of
kt,PM 2.5 emission
14.54 kt, and 5.9waskt,from October to
respectively,
December, which encompassed the value of 8.23 kt, 14.54 kt, and 5.9 kt, respectively,
which accounted for 76.2% of the total PM2.5 emission (as shown in Figure 5). This information which accounted
forcorresponded
76.2% of thetototal PM2.5 emission
the harvesting (asin-season
time of shown in riceFigure
for the5). This lower
central, information
northern corresponded to the
and northeastern
harvesting
regions. Antimeamount
of in-season
of PMrice
2.5 for the
emission central,
was lower
also foundnorthern
in and
January northeastern
to May, which regions. An
encompassed amount
the
of range
PM2.5 emission
of 0.42 kt was also kt,
and 1.83 found
which in January to May,
corresponded which
to the encompassed
harvesting time ofthe range ofrice
off-season 0.42for
ktcentral
and 1.83
kt,and lower
which northern regions.
corresponded to the harvesting time of off-season rice for central and lower northern
regions.This information indicated that there is a large gap between the seasonal variation of burned area
from MCD64A1 and the previous studies [2,45] (shown in Figure 3) and the PM2.5 emission or rice
residue burned (shown in Figure 5). It can be explained that the rice residue burned was calculated
from 4 parameters which included the harvested area (ha), biomass load (t/ha), fraction of rice residue
subjected to open burning (unitless) and combustion factor (unitless). In this study, the fraction of rice
residue subjected to open burning was obtained from the result of Cheewaphongphan P. et al. (2018)
which only classified by regions and irrigation systems (Equation (3)). This means that if the amount ofAtmosphere 2018, 9, 449 12 of 23
harvested area and rice residue generated in the fields were high in October to December which is the
harvesting time of in-season rice, the rice residue burned would be high as well. So, the results show a
large different in seasonal variation between the rice residue burned from the bottom-up approach
and the burned area derived from MCD64A1.
In the future researches, the fraction of rice residue subjected to open burning should be considered
with the monthly temporal of farmer’s burning. Because the rice residue generated located in rain-fed
filed can be burned in the long period from the after harvesting to before tillage (October to April for
next year) while the rice residue generated located in irrigated-fed filed was immediately burned after
harvesting,
Atmosphere inxorder
2018, 9, to present
FOR PEER REVIEWa result as accurate as possible. 12 of 22
Figure
Figure5. 5.Monthly temporal
Monthly distribution
temporal of of
distribution PMPM emission
2.5 2.5 from
emission ricerice
from residue open
residue burning
open in in
burning
Thailand,
Thailand, 2018.
2018.
3.6.This
Air Quality Trendsindicated that there is a large gap between the seasonal variation of burned
information
area from MCD64A1
Regarding the and the previous
air quality studies
analysis, based [2,45]
on the(shown
monthlyin Figure
average 3) and
datathe PM10
of PM emission or
2.5 concentration
rice residue burned (shown in Figure 5). It can be explained that the
collected from the four sites during 2010–2017, as illustrated in Figure 6, similar trends could rice residue burned wasbe
calculated
found every fromyear.
4 parameters
The PM10which includedmonthly
concentration the harvested
averagesareaare
(ha),
in biomass
the rangeload (t/ha),µg/m
of 20–35 3
fractioninofthe
rice residue subjected
off-season to open burningand
period (May–September), (unitless)
start toand combustion
increase factor
to the range of(unitless).
38–48 µg/m In3this study, the
in October—the
fraction of rice residue subjected to open burning was obtained from the result
beginning of winter when rainfall volume declines. The increase then continues until it reaches the of Cheewaphongphan
P. range
et al. (2018)
of 57–82which
µg/m 3 inclassified
only November by and
regions and irrigation
December which are systems
the peak(Equation
months(3)).forThis means that
the in-season rice
if harvest.
the amount of harvested area and rice residue generated in the fields were
This level of PM10 concentration continues its peak until the end of April (January–April is high in October to
December
the harvest which is the
period for harvesting
the off-seasontimerice
of production),
in-season rice, as the rice residue
illustrated burned
in Figure would beithigh
7. Moreover, as
is found
well.
thatSo, the results
December showis
to April a large different
the annual in seasonal
period for sugarvariation
factory tobetween
procurethe rice
fresh residue
sugar cane, burned
making from
it the
thepre-harvest
bottom-upburningapproach and the
period for burned areawhen
the farmer, derivedtheyfrom MCD64A1.
regularly burn the sugar cane leaves and tops.
In the future
According researches,
to Report the fraction of
on the Performance of Sugarcane
rice residue andsubjected to open burning
Sugar Production of SugarshouldFactories be in
considered with theby
Thailand reported monthly
Office oftemporal
the Cane ofandfarmer’s burning.
Sugar Board [55], Because
the sugarthe canerice residue
burnt in thegenerated
pre-harvest
located
burning in process
rain-fedamounts
filed cantobeapproximately
burned in the40–50%long period
of the from the afterofharvesting
total amount sugar caneto soldbefore
to thetillage
factory
(October to April forThe
during 2010–2017. next year)level
higher while
of the
PM10 rice residue generated
concentration was duelocated in irrigated-fed
to the biomass burning filed was of
activities
immediately burned after harvesting, in order to present a result as accurate as
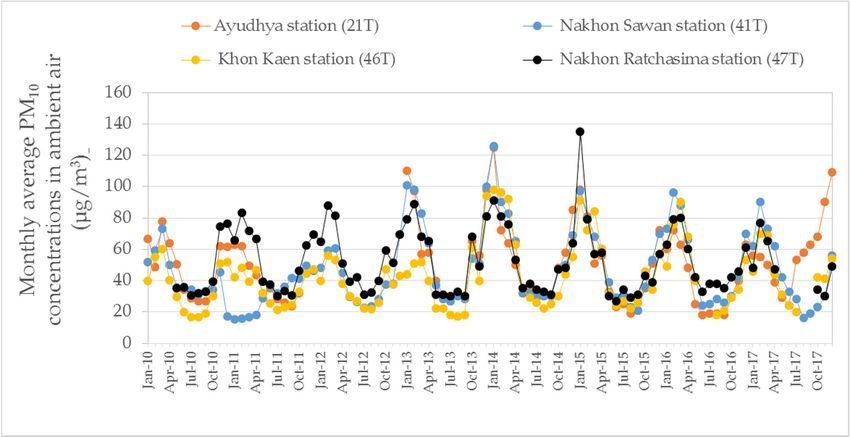
both crops, as reflected in the higher monthly averages of the months with biomass burning, by around possible.
1.9–2.1 times (November to April PM10 concentration average divided by May to October average).
3.6.
InAir Quality
future Trends biomass burning activities of other crops should also be taken into consideration,
researches,
especially sugarcane.
Regarding the air quality analysis, based on the monthly average data of PM10 concentration
collected from the four sites during 2010–2017, as illustrated in Figure 6, similar trends could be found
every year. The PM10 concentration monthly averages are in the range of 20–35 μg/m3 in the off-season
period (May–September), and start to increase to the range of 38–48 μg/m3 in October—the beginning
of winter when rainfall volume declines. The increase then continues until it reaches the range of 57–
82 μg/m3 in November and December which are the peak months for the in-season rice harvest. This
level of PM10 concentration continues its peak until the end of April (January–April is the harvest
period for the off-season rice production), as illustrated in Figure 7. Moreover, it is found that
December to April is the annual period for sugar factory to procure fresh sugar cane, making it the
pre-harvest burning period for the farmer, when they regularly burn the sugar cane leaves and tops.Atmosphere
Atmosphere 2018,
2018, 9,
9, x
x FOR
FOR PEER
PEER REVIEW
REVIEW 13
13 of
of 22
22
October average). In future researches, biomass burning activities of other crops should also be taken
October average).
Atmosphere 2018, 9, 449 In future researches, biomass burning activities of other crops should also be13
taken
of 23
into consideration,
into consideration, especially
especially sugarcane.
sugarcane.
Figure 6.
Figure 6. Monthly
Monthly variation
variation of
of monthly
monthly average
monthly average PM
average PM 10 concentration
PM10
10
concentration at
concentration at four air quality
four air quality monitoring
monitoring
station sites during the period 2010–2017.
station sites during the period 2010–2017.
Figure
Figure7.7.
Figure Monthly
7.Monthly temporal
Monthlytemporal distribution
temporaldistribution of
distribution of average
of average 10 concentration
average PM10
10 concentrationduring
concentration duringthe
during theperiod
the period2010–2017.
period 2010–2017.
2010–2017.
3.7.
3.7. Comparison with Other Other Studies
3.7. Comparison
Comparison withwith Other Studies
Studies
Based
Based on the comparison of emissionsbetweenbetween thisstudy study and previous studies [2,8,30],
Based on on the
the comparison
comparison of of emissions
emissions between this this study and and previous
previous studies
studies [2,8,30],
[2,8,30], as
as
as presented
presented in Table
in Table
Table it 2,
2, it canit be
canobserved
be observedthat thethat
the the results
results this of
of this this are
study study are slightly
slightly lower thanlower
than than
those of
presented in 2, can be observed that results of study are slightly lower those of
those
the of the previous
previous studies, studies,
the the difference
difference is is varying
varying by a by a range
range of 0.7ofto0.74.0
totimes,
4.0 times,
withwith
the the exception
exception of
the previous studies, the difference is varying by a range of 0.7 to 4.0 times, with the exception of
of
PM PMwhich
2.5 which the large difference is in the range between 1.8 and 9.2 times lower. The comparison
PM2.52.5 which the
the large
large difference
difference is is in
in the
the range
range between
between 1.81.8 and
and 9.2
9.2 times
times lower.
lower. The
The comparison
comparison of of
of parameters
parameters and and emission
emission factors
factors between
between thisthis studyand
study andprevious
previousstudies,
studies,asaspresented
presentedininTable
Table 3.3.
parameters and emission factors between this study and previous studies, as presented in Table 3.
There
There are four main parameters that influence the differences in these results, which include:
There are are four
four main
main parameters
parameters that that influence
influence the the differences
differences in in these
these results,
results, which
which include:
include: (1)
(1)
(1) quantity
quantity of of
of rice rice residue
rice residue generated;
residue generated;
generated; (2) (2) percentage
(2) percentage
percentage of of
of rice rice residue
rice residue
residue subjectedsubjected
subjected to to
to open open burning;
open burning;
burning; (3)
quantity (3)
(3) combustion
combustion factor;
factor; andand (4) (4) emission
emission factor.
factor.
combustion factor; and (4) emission factor.
Regarding the aspect of the quantity of rice residue generated, the differences in the amount of rice
residue generated are accounted for by the methodology, the source of information, and the estimation
scale. This study quantified the amount of rice residue generated in the field on the basis of the
biomass load unit, which correlated with the harvested areas. On the other hand, the previous studies
quantified the amount of rice residue generated (by combining both stubble and straw together) on
the basis of the residue to product ratio (RPR), which correlated with the rice production derived from
the Food and Agriculture Organization (FAO), FAOSTAT Agricultural Database [56] or Agricultural
Statistic of Thailand from Office of Agricultural Economics (OAE), Thailand. In addition, this studyYou can also read