New generation geostationary satellite observations support seasonality in greenness of the Amazon evergreen forests - Boston University
←
→
Page content transcription
If your browser does not render page correctly, please read the page content below
ARTICLE
                  https://doi.org/10.1038/s41467-021-20994-y                 OPEN

                  New generation geostationary satellite
                  observations support seasonality in greenness
                  of the Amazon evergreen forests
                  Hirofumi Hashimoto 1,2 ✉, Weile Wang                         1,2,Jennifer L. Dungan 2, Shuang Li 3, Andrew R. Michaelis2,4,
                  Hideaki Takenaka 5,6, Atsushi Higuchi                       6, Ranga B. Myneni 7 & Ramakrishna R. Nemani 2
1234567890():,;

                  Assessing the seasonal patterns of the Amazon rainforests has been difficult because of the
                  paucity of ground observations and persistent cloud cover over these forests obscuring
                  optical remote sensing observations. Here, we use data from a new generation of geosta-
                  tionary satellites that carry the Advanced Baseline Imager (ABI) to study the Amazon canopy.
                  ABI is similar to the widely used polar orbiting sensor, the Moderate Resolution Imaging
                  Spectroradiometer (MODIS), but provides observations every 10–15 min. Our analysis of
                  NDVI data collected over the Amazon during 2018–19 shows that ABI provides 21–35 times
                  more cloud-free observations in a month than MODIS. The analyses show statistically sig-
                  nificant changes in seasonality over 85% of Amazon forest pixels, an area about three times
                  greater than previously reported using MODIS data. Though additional work is needed in
                  converting the observed changes in seasonality into meaningful changes in canopy dynamics,
                  our results highlight the potential of the new generation geostationary satellites to help us
                  better understand tropical ecosystems, which has been a challenge with only polar orbiting
                  satellites.

                  1 Department of Applied Environmental Science, California State University – Monterey Bay, Seaside, CA, USA. 2 NASA Ames Research Center, Moffett Field,

                  CA, USA. 3 Guizhou Provincial Key Laboratory of Geographic State Monitoring of Watershed, Guizhou Education University, Guiyang, China. 4 Bay Area
                  Environmental Research Institute, Moffett Field, CA, USA. 5 JAXA Earth Observation Research Center, Tsukuba, Ibaraki, Japan. 6 Center for Environmental
                  Remote Sensing, Chiba University, Chiba-shi, Chiba, Japan. 7 Earth & Environment Department, Boston University, Boston, MA, USA.
                  ✉email: hhashimoto@csumb.edu

                  NATURE COMMUNICATIONS | (2021)12:684 | https://doi.org/10.1038/s41467-021-20994-y | www.nature.com/naturecommunications                               1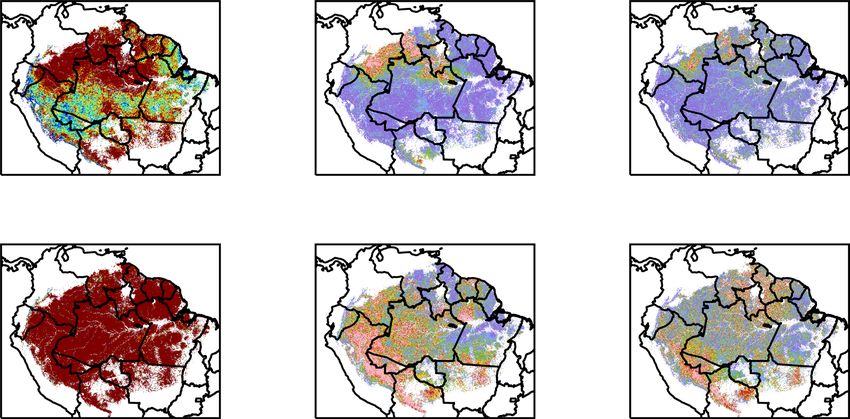
ARTICLE                                                                 NATURE COMMUNICATIONS | https://doi.org/10.1038/s41467-021-20994-y

A
        mazon forests have a strong influence on global climate,              forests. The details of seasonality in the leaf area index (LAI) of
        carbon, and water cycles. Understanding the interactions             Amazon evergreen forests has been crucial for modeling carbon
        of Amazon forests with the climate system is a key to                or water cycles in general circulation models. Due to the difficulty
predicting climate changes in the 21st century1,2. For instance,             in estimating LAI at stand level from optical satellite imaging
severe Amazon droughts are expected to occur more frequently as              systems operating in visible – shortwave infrared (400–2500 nm)
a result of global warming3,4 and modeling forests’ responses to             regions, long-term observations of LAI are limited in the Amazon
drought is crucial for climate projections5. Despite the impor-              basin (e.g. Ref. 26). Dozens of ground observations of monthly
tance of Amazon vegetation dynamics in climate change studies,               litterfall in the Amazon basin have shown a mild seasonality in
the lack of ground observations still leaves large uncertainties in          litterfall27. However, the locations of those observations are
how to represent tropical evergreen forests in Earth system                  biased near the edges of the Amazon basin, and the determining
models6. While efforts to monitor Amazon forests in situ                     factor of litterfall seasonality is still unknown27. Therefore,
continue,7,8 optical remote sensing plays a major role in mon-               remote sensing is necessary to help us understand the spatial
itoring vegetation dynamics for broad regions in the Amazon.                 patterns of seasonality in LAI of the Amazon evergreen forests.
   Historically, long-term records of Normalized Difference                  Vegetation Indices (VI) have been frequently used as surrogates
Vegetation Index (NDVI) have been the most useful data source                for LAI to examine Amazon seasonality11,12,28. For example,
among various optical remote sensing datasets derived from sun-              increases in Enhanced Vegetation Index (EVI) have been
synchronous sensors such as the Advanced Very High Resolution                observed in the dry season in the west Amazon basin11, but
Radiometer (AVHRR) and the Moderate Resolution Imaging                       conflicting explanations for this phenomenon have been offered.
Spectroradiometer (MODIS)9. In theory, AVHRR and MODIS                       The EVI increases were explained by an LAI increase28, an arti-
can observe most places on the Earth at least once a day during              fact of sun-sensor-geometry12, and changes in leaf age through
daytime. However, in tropical regions, land surface monitoring by            the leaf flush29. These studies suffered from the lack of sufficient
optical remote sensors is very often obstructed by clouds. In                data due to cloud contamination22 hindering a fuller assessment
particular, the Amazon basin experiences over 2000 mm/year of                of the capacity to estimate canopy biophysical parameters. In this
precipitation10 and cloud obscuration occurs throughout the year.            study, instead of directly analyzing the EVI increase in the dry
Therefore, in practice AVHRR and MODIS cannot provide suf-                   season, we provide evidence for the existence of seasonality in
ficient clear-sky observations over Amazon forests to generate                Amazon evergreen forests using frequent greenness (NDVI)
robust statistics that summarize the vegetation dynamics. This               observations from ABI. The interpretation of the physical
issue has contributed to inconsistent conclusions among various              meaning of NDVI is much easier than EVI due to NDVI’s simple
Amazon forest studies, even though they all tend to be based on              formula, and the relationship with vegetation physical variables
the same satellite datasets. For instance, studies on Amazon forest          has been well established30. Furthermore, EVI has the dis-
seasonality based on Vegetation Indices (VI) disagree on whether             advantage of a high sensitivity to sun-sensor-geometry12,31.
there is more greenness in the dry season than in the wet sea-               Therefore, results derived from ABI NDVI are likely to be more
son11–15. The impact of droughts on Amazon forests has also been             robust than those from EVI to study changes in the greenness of
debated16–19. A reported decadal decline of greenness in the                 the Amazon forest canopy31.
Amazon forest canopy may or may not be caused by drought20,21.
Conflicting conclusions among these studies arise from different
interpretations of VI signals, which depend on algorithms that               Results
handle cloud contamination22. The state-of-the-art cloud masking             15-minute ABI NDVI in dry- and wet-season months. Monthly
techniques in the Multi-Angle Implementation of Atmospheric                  scatterplots of ABI NDVI against local time from a 1 km × 1 km
Correction algorithm (MAIAC)23 are reported to increase clear-               pixel at Km34 (2.61°S, 60.21°W, Reserva Cuieiras)32 formed
sky observations two to five times compared to traditional                    characteristic shapes in both wet season and dry season months
methods24, but clear-sky observations still may not be available             (Fig. 1). Similar shapes exist in monthly plots throughout the
within critical composite periods. Therefore, the NDVI data                  year. Due to cloud contamination, there were more low values of
derived from existing optical remote sensing sensors alone are               NDVI in the wet season (Fig. 1a, 69% of NDVI is less than 0.3)
insufficient to end controversies regarding Amazon vegetation                 than in the dry season (Fig. 1b, 41% of NDVI is less than 0.3).
dynamics due to aerosol, water vapor, and cloud contamination25.             Using the maximum-value composite (MVC) logic which was
   In this study, we examine the Amazon basin cloud con-                     originally developed to represent clear-sky NDVI of a specific
tamination issue using data from the new Advanced Baseline                   duration from daily, often cloud-contaminated NDVI33, we
Imager (ABI) onboard the Geostationary Operational Environ-                  assumed that the maximum NDVI value for each 15-minute
mental Satellite 16 (GOES-16) satellite at 1-km resolution and               interval in a month represents the clearest sky NDVI and is
compare these measurements to tower-based observations of                    therefore representative of the vegetation canopy. Using this
monthly mean Net Ecosystem Exchange (NEE) or CO2 flux at the                  assumption, the clear-sky NDVI values are in the convex hull of
top of the canopy at two sites - see Methods. GOES-16 was                    the scatterplot (Fig. 1). In studies of solar-geometry effects on
launched in November 2016. It carries ABI with a high-frequency              NDVI at the surface, higher NDVI is often observed in the early
observing capability and 16 spectral bands, which include a red              morning and late evening over forest targets. This is caused by
band (band 2) and a near infrared band (band 3), similar to the              relatively higher absorption of red light by the canopy at lower
corresponding bands of AVHRR or MODIS25. ABI’s full disk                     sun angles34,35. In contrast, the fall off of the Top-of-Atmosphere
scan covers the entire Amazon basin. In 2018, the ABI default                (TOA) NDVI in the morning and evening can be explained by
mode of scanning was Mode 3, which performs full disk scans                  the longer path-length of light through the aerosol-laden atmo-
every 15 min. The default mode of ABI was changed to Mode 6 in               sphere in the early morning and the late evening36.
2019, which provides full scan images every 10-minutes. No such                 Since there were plateaus in the upper convex hull of NDVI
high-frequency (and high-resolution) optical sensors exist for               from 9 a.m. to 3 p.m., we created daily MVCs over this 6-hour
monitoring the entire Amazon basin from space before the                     period to represent the daily clearest NDVI. There are 24 (6 h ×
advent of ABI.                                                               4 times per hour) chances of clear-sky conditions from ABI
   A second objective of this paper is to use the GOES16 ABI data            15-minute data per day compared to two chances for MODIS
to assess seasonality in the greenness of Amazon evergreen                   (from Terra and Aqua). Therefore, the GOES platform improves

2                NATURE COMMUNICATIONS | (2021)12:684 | https://doi.org/10.1038/s41467-021-20994-y | www.nature.com/naturecommunications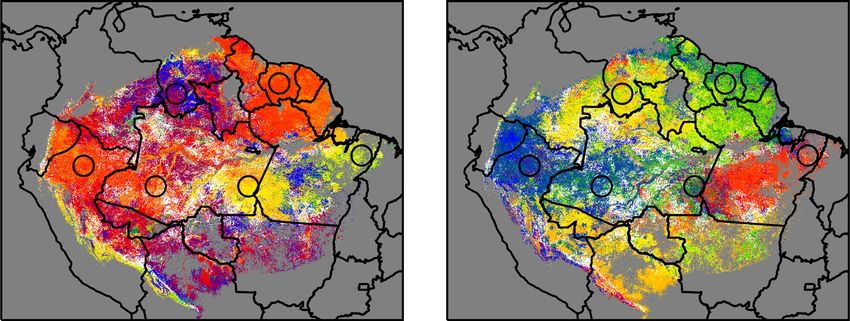
NATURE COMMUNICATIONS | https://doi.org/10.1038/s41467-021-20994-y                                                                    ARTICLE

Fig. 1 Scatterplot of Advanced Baseline Imager (ABI) Normalized Difference Vegetation Index (NDVI) against local time (UTC-4) at Km34 near
Manaus. a February, 2018 (wet season). b September, 2018 (dry season). Each gray dot represents a 15-minute ABI NDVI value. The green line and blue
lines show approximate overpass time for Terra and Aqua, respectively. The red lines are the convex hulls of the ABI NDVI scatterplots. The gray shaded
areas indicate the 9 a.m. to 3 p.m. time window.

chances of clear-sky observation much more than those obtained                  August (0.8) to November (0.75) similarly to the 16-day MVC
by any MODIS cloud-detection algorithm improvement24.                           ABI NDVI; however, those small decreases were indiscernible due
                                                                                to the frequent cloud drops, which hid the dry season signals.
                                                                                   MAIAC found more clear-sky observations from MODIS data
Comparison of seasonal time-series between ABI and MODIS.                       than in MOD13A2 and MYD13A2 data using its sophisticated
We applied the daily MVC for 15-minute TOA NDVI from                            cloud detection algorithm (Fig. 2g, h). However, the clear-sky
9 a.m. to 3 p.m. to create the daily clearest sky NDVI at Km34                  observations found by MAIAC were mostly in the dry season,
and RJA (10.08°S, 61.93°W, Reserva Jaru)37 in 2018. To remove                   and the number of clear-sky data in the wet season was only
the fluctuations of the daily MVC NDVI due to residual cloud                     slightly larger than that from MOD13A2 and MOYD13A2 data.
contamination, we also created the 16-day MVC NDVI using the                    MAIAC could not find any clear-sky days in some months, for
same composite period as the MOD13A2 NDVI product. At                           example November at both Km34 and RJA. Therefore, the
Km34, the 16-day MVC NDVI shows far smaller fluctuations                         number of clear-sky observations in the MODIS MAIAC product
than the daily MVC NDVI, and we did not observe any sea-                        was still insufficient in the wet season to detect seasonality of
sonality in the 16-day MVC NDVI. The 16-day MVC NDVI has                        Amazon evergreen forests.
the same NDVI magnitude in the wet season as in the dry season                     At Km34, the MAIAC NDVI data showed no seasonality in
(Fig. 2a). In contrast, the 16-day MVC NDVI at RJA had a low                    NDVI, while MAIAC EVI increased from July to October
NDVI (0.74) from August to November in the late dry season                      (Fig. 2g) as reported in several studies11,12,15,26,29,38. Meanwhile,
compared to a high NDVI (0.78) in the other months (Fig. 2b).                   the MAIAC EVI at RJA steeply increased in October (from 0.4 to
   We simulated the daily MODIS NDVI by extracting ABI                          0.7), but MAIAC NDVI showed no seasonal trend (Fig. 2h). The
NDVI at the approximate MODIS overpass time (10:30 a.m. for                     period of lower MAIAC EVI at RJA occurred much earlier from
Terra and 1:30 p.m. for Aqua) and created 16-day MVC NDVI                       June to August than did 16-day MVC ABI NDVI.
from the daily ABI NDVI for both Terra and Aqua overpass                           These findings indicate that the detected seasonality in the
times. We compared them with the time series of the standard                    Amazon forest greenness from a sun-synchronous satellite sensor
MODIS NDVI products for Terra (Fig. 2c, d) and Aqua (Fig. 2e,                   can be spurious and often caused by cloud contamination even
f). Even though MODIS NDVI was calculated from surface                          using a state-of-the-art cloud screening algorithm. The influence
reflectance and had a different compositing scheme (Fig. 2c–f),                  of cloud contamination on the MODIS VIs is so strong that even
the seasonal variation of MODIS NDVI is similar to that of the                  monthly composited MODIS VI data are not suitable for
simulated ABI TOA NDVI, especially in Fig. 2c. Both ABI and                     seasonality analyses (Fig. 2c–h). The high-frequency observations
MODIS NDVI fluctuated more than 0.1, and large drops (from                       from ABI can reduce the effect of chronic cloud contamination in
0.75 to 0.6) happened in the wet season. Those large drops (from                the Amazon basin and allow the study of tropical forest
0.75 to 0.5) were much higher than those in the 16-day MVC ABI                  seasonality.
in the dry season at RJA (Fig. 2b). These drops indicated that 16-
day MVC from once-a-day observations could not remove cloud
contamination in the wet season. The MODIS QA reliability flag                   Number of clear-sky observations. We counted the number of
helped to pick up clear-sky pixels in the dry season, but often                 clear-sky observations in February (i.e., the wet season) from 9 a.
flagged the cloud-contaminated pixels as good or useful data in                  m. to 3 p.m. in Amazon evergreen forests with Terra overpass
the wet season. At RJA, both Terra (MOD13A2) and Aqua                           time at 10:30 a.m. and Aqua overpass time at 1:30 p.m. (Fig. 3 and
(MYD13A2) MODIS NDVI showed a slight decrease from                              Table 1). Using the results from Fig. 1, the count of clear-sky

NATURE COMMUNICATIONS | (2021)12:684 | https://doi.org/10.1038/s41467-021-20994-y | www.nature.com/naturecommunications                              3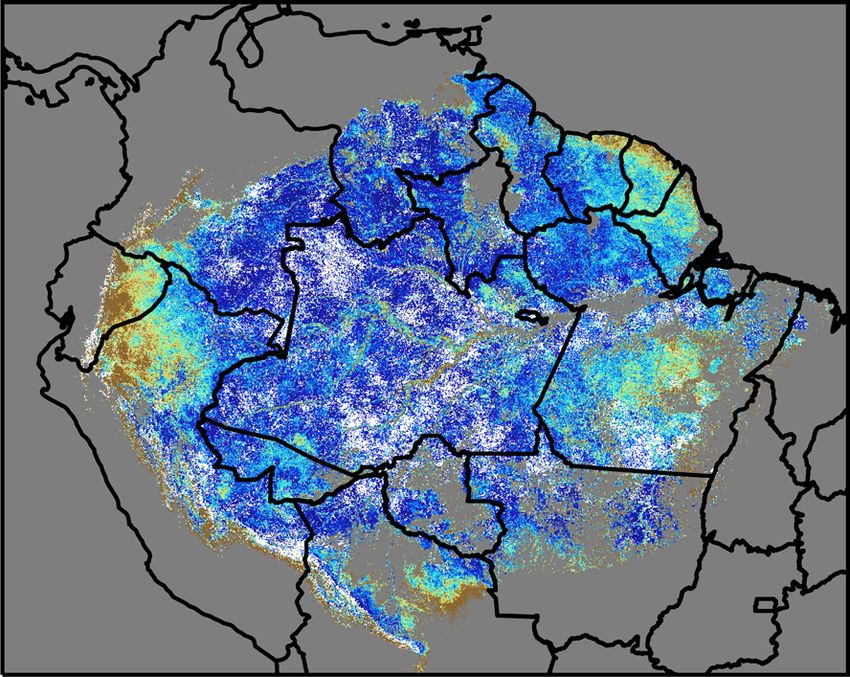
ARTICLE                                                                   NATURE COMMUNICATIONS | https://doi.org/10.1038/s41467-021-20994-y

Fig. 2 Time series of vegetation indices at two study sites in 2018. Left column is Reserva Cuieiras near Manaus (Km34, 2.61°S, 60.21°W) and right
column is Reserva Jaru (RJA, 10.08°S, 61.93°W). a, b Time series of daily (black lines) and 16-day (red lines) Advanced Baseline Imager (ABI) Maximum
Value Composite (MVC) Normalized Difference Vegetation Index (NDVI), where maximum NDVI values are composited over the time window from 9 a.m.
to 3 p.m. (local time). c, d Daily (black lines) and 16-day (red lines) maximum NDVI values composited over the time window around 10:30 a.m., the
approximate Terra overpass time. The green lines indicate time series of the corresponding Terra Moderate Resolution Imaging Spectroradiometer (MODIS)
16-day NDVI (MOD13A2). Data plotted with green dots had a reliability flag of good or useful in MODIS QA. e, f Daily (black lines) and 16-day (red lines)
maximum NDVI values composited over the time window around 1:30 p.m., the approximate Aqua overpass time. The blue lines indicate time series of the
corresponding Aqua MODIS 16-day NDVI (MYD13A2). Data plotted with blue dots had a reliability flag of good or useful in MODIS QA. g, h Daily NDVI
(green lines) and Enhanced Vegetation Index (EVI) (purple lines) calculated from Terra Multi-Angle Implementation of Atmospheric Correction algorithm
(MAIAC) daily reflectance. The dry season from June to September is shaded in gray in all plots.

4                  NATURE COMMUNICATIONS | (2021)12:684 | https://doi.org/10.1038/s41467-021-20994-y | www.nature.com/naturecommunications
NATURE COMMUNICATIONS | https://doi.org/10.1038/s41467-021-20994-y ARTICLE
Fig. 3 Number of clear-sky observations per month by Advanced Baseline Imager (ABI) in wet and dry seasons in 2018. Top row is February, 2018 (the
wet season) and bottom row is September, 2018 (the dry season). In particular, a and b show the numbers for the time window from 9 a.m. to 3 p.m. (local
time). c, d The numbers for the time window at 10:30 a.m. e, f The corresponding numbers for a time window at 1:30 p.m.
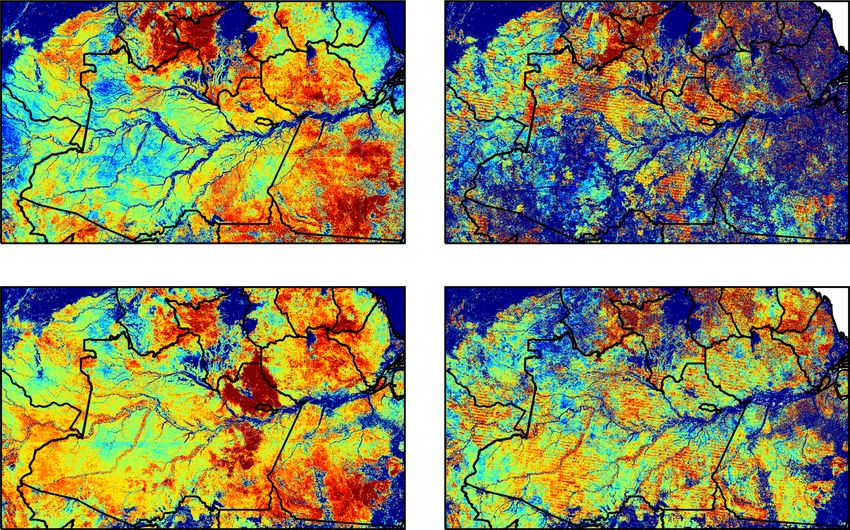
is inconsistent with the dry season map, while GOES ABI
Table 1 Mean number of clear-sky observations per month. monthly composite maps are consistent through the year (Fig. 4).
February, 2018 September, 2018
Aerosol screening by MVC. The MVC can also screen out
9 a.m.–3 p.m. every 15 min 23.6 58.7 observations with high aerosol loading in addition to cloud
10:30 a.m. (Terra MODIS 1.0 2.5 contamination. Aerosols have the effect of decreasing NDVI, so
overpass time)
MVC selects observations with low aerosol concentration33.
1:30 p.m. (Aqua MODIS 0.9 2.1
overpass time)
During the dry season, aerosol concentrations observed in the
Amazon basin can have high variability at hour-to-hour time
The numbers of clear-sky observations per month (Fig. 3) are averaged over all of the Amazon scales40. The high-frequency observations of ABI thus also con-
evergreen forest zone for February, 2018 (the wet season) and September, 2018 (the dry
season). tribute to finding fewer aerosol-contaminated NDVI values
than MODIS.
To test the hypothesis that maximum-value compositing
selects for observations with low aerosol concentrations, we
observations was defined as the number of NDVI values that are extracted concurrent Aerosol Optical Depth (AOD) data
within 0.03 of the convex hull of NDVI between 9 a.m. and 3 p.m. corresponding to the 16-day MVC ABI NDVI and MODIS
In the wet season, at least five clear-sky observations of ABI were NDVI at three AERONET sites (Fig. 5) for 2018. The 15-min
available from any pixel in the entire Amazon evergreen forest AOD data showed strong seasonality with high values from
zone. On average, ABI provided 23.6 clear-sky observations in August to November, when cloud cover tends to be low. Aerosols
February, and 58.7 clear-sky observations in September for all from biomass burning hindered the observation of Amazon forest
pixels in the Amazon basin. When we restricted the observations seasonality by MODIS22. The MODIS composite scheme tends to
to Terra or Aqua overpass times, ABI provided only one clear-sky choose small values of AOD, but the chosen AOD was still over
opportunity at each time during the month of February. Obser- 0.5 (Fig. 5b). In comparison, the 16-day MVC of ABI occurred at
vations in September were more numerous than in February, but times when the AOD is less than 0.3 for all the three sites. These
the mean counts are still 2.5 or 2.1 at Terra or Aqua overpass results indicate that high-frequency ABI observations can help
time, respectively. Therefore, even a monthly composite of screen out high aerosol conditions.
MODIS data failed to find the clear-sky conditions within a NDVI seasonality is apparent at Floresta and Ji Parana SE
month, so that the analysis derived from MODIS data cannot be (Fig. 5b, c). In particular, the low values of NDVI occurred before
conclusive about Amazon evergreen forest seasonality. Since 2018 the rise of aerosol loading. Therefore, the timing of low NDVI
was a normal precipitation year39, the availability of clear days in was likely not caused by aerosol seasonality. The AOD differences
wet years would likely be lower. In comparison, ABI had between the biomass burning months and other months were
approximately 24 (ranging between 21–35 on a monthly basis) 0.108, 0.058, and 0.104 at the Amazon Tall Tower Observatory
times more clear-sky observations than MODIS per year, which (ATTO), Alta Floresta, and Ji Parana SE, respectively. A previous
corresponds to the number of ABI observations per day from 9 a. modeling study of NDVI sensitivity to AOD showed a linear
m. to 3 p.m. (Supplementary Table 1). The frequency of ABI full- decrease of 0.2 NDVI per increase of 1 AOD for high LAI
disk observations became 10 min after April 2019, increasing vegetation41. Thus, the NDVI may decrease up to 0.022 (0.108 ×
the potential of ABI for clear-sky observations. As a result, 0.2) by the aerosol from biomass burning. To account for the
the map of monthly MODIS NDVI in the wet-season composite aerosol effect, we set the threshold of NDVI detection as 0.022.
NATURE COMMUNICATIONS | (2021)12:684 | https://doi.org/10.1038/s41467-021-20994-y | www.nature.com/naturecommunications 5ARTICLE NATURE COMMUNICATIONS | https://doi.org/10.1038/s41467-021-20994-y
Fig. 4 Comparison between 2018 Advanced Baseline Imager (ABI) and Moderate Resolution Imaging Spectroradiometer (MODIS) monthly Maximum
Value Composite (MVC) Normalized Difference Vegetation Index (NDVI). a and b are NDVI composites from February 2nd to March 5th (wet month).
c and d are NDVI composites from August 13th to September 13th (dry month). a and c are GOES-16 ABI composites; b and d are Terra MODIS composites.
If the NDVI seasonal amplitude is less than this threshold value, Manaus, but the surrounding area showed a significantly high-
we suggest the NDVI variation is within the uncertainty of NDVI season from June to October (Fig. 6g, h). Additionally,
aerosol seasonality and cannot be ascribed to canopy foliage some studies assumed that the growing season in Amazon is June
seasonality. to October deduced from the intensive observation sites, but the
same seasonality was observed only in the southeastern part of
Amazonas State and the western part of Pará State. To
Detecting statistically significant seasonal changes in evergreen understand seasonal variation, the growing season should be
forest greenness. To meet the second objective, we identified all defined from region to region.
the pixels in the Amazon evergreen forest zone where seasonality The GOES ABI provides clearer evidence than MODIS to
in remotely sensed greenness is detected. For each pixel, we cal- assess the existence of seasonality in the Amazon, and further to
culated when the high-NDVI season and the low-NDVI season identify the timing of greening or browning. Previous carbon-flux
were observed (see Methods for details). Pixels with differences studies have concluded that there is seasonality in photosynthesis
between low and high NDVI values of less than the chosen in the Amazon region and that photosynthesis is higher in the dry
threshold (0.022) were treated as no difference due to the aerosol season8,42,43. However, the discussion of seasonality of greenness
contamination uncertainty as discussed above. GOES ABI found or LAI has been confounded by different interpretations of
a statistically significant difference in NDVI values, i.e., season- MODIS EVI change12,15,26 and cloud contamination22. Our
ality in NDVI, in 85% of the evergreen forest pixels (Fig. 6g, h). analysis confirms the existence of seasonality of greenness in 85%
Both the high-NDVI season (Fig. 6g) and low-NDVI season of the Amazon evergreen forest zone using the simple NDVI.
(Fig. 6h) were spatially heterogeneous across the Amazon region. Though there still remain issues inherent with optical remote
These regional differences were recognizable from the time-series sensing (see below in Discussion), our analysis indicates the area
plots of daily MVC ABI NDVI (Fig. 6a–f). For example, the of forest exhibiting seasonality is about three times greater than
southern Amazon forest showed a gradient of the greening timing previously reported using MODIS13. These results confirm the
from west (September: Fig. 6d) to east (May: Fig. 6f). The het- conclusion that LAI of Amazon forest has seasonality28,44 and
erogeneous seasonality of Amazon evergreen forests appear to shows that the seasonality of greenness exists in a much broader
corroborate litterfall observations27. region and has a strong geographic dependency.
The regional dependency of seasonality timing indicates that The response of NDVI to precipitation is also spatially
we cannot conclude the existence of seasonality in Amazon heterogeneous and cannot be explained by simple biological
forests from a few intensive study sites, such as Manaus and mechanisms. As observed precipitation decreased in the dry season,
Santarem. For instance, Fig. 2a showed no seasonality in NDVI at NDVI increased in the south and west Amazon (Fig. 6a, d, e).
6 NATURE COMMUNICATIONS | (2021)12:684 | https://doi.org/10.1038/s41467-021-20994-y | www.nature.com/naturecommunicationsNATURE COMMUNICATIONS | https://doi.org/10.1038/s41467-021-20994-y ARTICLE
Discussion
The GOES ABI data unveiled more detailed region-dependent
seasonal changes in the 16-day MVC NDVI of Amazon evergreen
forests than do MODIS data (Figs. 6 and 7). Although under-
standing the seasonality of gross primary production (GPP) of
Amazon evergreen forests has been advanced with new sun-
induced chlorophyll fluorescence (SIF) observations43 and flux
modeling42, the seasonality in greenness (e.g. LAI and fraction of
photosynthetically active radiation (FPAR)) has not been clearly
revealed due to the small signal of the evergreen forest. The
seasonality in greenness of Amazon evergreen forests has been
studied using MODIS and the Geosciences Laser Altimeter Sys-
tem (GLAS) on the Ice, Cloud and land Elevation Satellite
(ICESat). The EVI was originally introduced to detect small
changes in high LAI values, but a lack of consensus on the
interpretation of EVI change subsequently emerged with the
increase in dry season EVI being attributed to cloud con-
tamination, sun-sensor geometry, or the flushing of new leaves46.
GLAS was designed for observing the atmosphere and ice sheets,
but has also been used for estimating LAI. Unlike optical remote
sensing, GLAS can avoid the cloud contamination issue, however,
the small footprint and low temporal frequency observations by
GLAS limit analyses to long time steps (a few months) and low
spatial resolution (one-degree grid)12,47. As a result, GLAS barely
shows LAI seasonality between the North Amazon and the South
Amazon with uncertain month of start and end times47.
Though we showed that GOES ABI high-frequency observa-
tions improve cloud and aerosol screening compared to MODIS,
residual atmospheric effects, such as sub-pixel cloud, still exist. To
show the reproducibility of our results regardless of the residual
atmospheric effects, we repeated the analysis for 2019 GOES ABI
data and created the same figure as in Fig. 6 (Supplementary
Fig. 2). In April 2019, the GOES ABI increased its observation
frequency by changing scan mode, and scans the full disk every
10 min. Even though the frequency difference may have some
influence on NDVI time series, the spatial patterns of the high-
NDVI season and the low-NDVI season were comparable with
2018 (Fig. 6g, h and Supplementary Fig. 2g, h). More pixels with
statistically insignificant differences were located in the center of
the Amazon basin compared to 2018. This indicated that residual
cloud effects still remained and obscured small greenness
Fig. 5 Time series of Aerosol Optical Depth (AOD) and 16-day Maximum changes.
Value Composite (MVC) Normalized Difference Vegetation Index High-frequency ABI observations enable us to confirm the
(NDVI) at Aerosol Robotic Network (AERONET) sites in 2018. The blue seasonality of Amazon evergreen forests by peeking at the land
dots show observed AOD at a Amazon Tall Tower Observatory (ATTO), surface through the rarely occurring clear sky. The NDVI from
b Alta Floresta, and c Ji Paramá SE. The magenta and green dots are AOD sun-synchronous satellites cannot lead to effective analyses due to
at overpass times of the MOD13A2 composite and 16-day ABI MVC NDVI, the impossibility of sufficient cloud screening. Thus, results from
respectively. The red lines are 16-day MVC ABI NDVI. sun-synchronous satellites in this area have always been accom-
panied by doubt and suspected spurious conclusions. We showed
Such responses were explained by changing responses to that the seasonal amplitude of MODIS NDVI was magnified by
solar radiation45. However, the responses are different between cloud contamination. Long-term trend analysis using sun-
high and low precipitation areas (Fig. 6b, c, f). The area with synchronous satellites in perpetually cloudy areas is therefore
strong seasonality can be explained by a response to precipitation also suspect. We strongly recommend the usage of GOES ABI to
(Fig. 6c, f). However, the response of the higher precipitation area at further the examination of trends in vegetation over the
Fig. 6b cannot be explained by a single climate driver, i.e., Amazon basin.
precipitation or solar radiation. The eco-hydrological implications of the seasonal changes
Besides detecting the timing of seasonality, the ABI data also observed in satellite data have been studied extensively48–51.
enabled us to examine NDVI differences in a more accurate Generally, the NDVI is indicative of chlorophyll abundance and
manner. As seen in Fig. 2a, b, greenness differences are much energy absorption52, and as a result the NDVI is correlated with
smaller than fluctuations due to cloud contamination. The mean LAI and FPAR53. However, the stratification of canopies in the
difference of NDVI between the highest value in the high-NDVI Amazon into under- and overstory make translating changes in
season and the lowest value in the low-NDVI season in 2018 was NDVI into changes in states (e.g. LAI) or fluxes (e.g., GPP)
0.07 for the evergreen forest (Fig. 7). The center of the Amazon challenging48. In 2018, we found significant seasonal change in
basin showed a smaller NDVI difference which was less than 0.03 GOES ABI NDVI at four flux tower sites out of seven sites
or statistically no difference. The Peruvian Amazon and French examined from the Amazon evergreen forest (Supplementary
Guyana had a large NDVI difference of more than 0.1. Figs. 3 and 4 and Supplementary Table 2). Our basin-wide
NATURE COMMUNICATIONS | (2021)12:684 | https://doi.org/10.1038/s41467-021-20994-y | www.nature.com/naturecommunications 7ARTICLE NATURE COMMUNICATIONS | https://doi.org/10.1038/s41467-021-20994-y Fig. 6 Normalized Difference Vegetation Index (NDVI) seasonality over Amazon evergreen forests in 2018. Panels a to f show example time series of 16-day Maximum Value Composite (MVC) NDVI corresponding to the six locations (a–f) indicated on the map g and h. The green line and envelopes are the mean and standard deviation, respectively, of NDVI taken from the 11 × 11 pixel region surrounding each location. The blue bars show monthly precipitation at each location. The two maps show the first month of the consecutive three months in which daily MVC NDVI reaches its (g) highest and (h) lowest values during 2018. Pixels where the high-to-low NDVI differences are statistically insignificant (p > 0.05) by the one-sided two-sample t-tests (n = 6) are masked out and shown in white. analysis also showed that GOES ABI could not detect any sea- canopy greenness raises the possibility that it is an artifact of sun- sonal changes in the remaining 15% of the Amazon evergreen sensor geometry12,14. The sun angle of an ABI observation forest zone, which may reflect the saturation of NDVI at high changes from hour to hour unlike those from sun-synchronous values of LAI and/or residual atmospheric contamination. For satellite sensors, while the viewing angle on a per-pixel basis is example, ground observations of LAI at Km34 showed clear constant–for example GOES-16 is located at 75.2°W in the seasonality from 5.5 in July and August to 6.5 in November and northwest portion of the Amazon basin. Model studies showed December26, while the GOES ABI did not show statistically sig- that the NDVI of the Amazon has very small sensitivity to sun- nificant seasonality in 16-day MVC NDVI (Fig. 2a and Supple- sensor geometry compared to EVI and a correction for geometry mentary Fig. 3a). All flux data from the Amazon evergreen forest did not affect the seasonal change12,55. As we only used the data show seasonality in NEE and GPP corresponding to precipitation between 9 a.m. and 3 p.m., the BRDF effect on NDVI is negligible seasonality (Supplementary Figs. 3 and 4). However, three out of in this study. There should be some remaining BRDF effects on seven sites did not show significant seasonality in the GOES ABI TOA NDVI, but our conclusions cannot be explained by BRDF NDVI in 2018 (Supplementary Fig. 3a, e, f). Those results reveal effects because the regional dependency of NDVI of Fig. 6 and that there remain some limitations in capturing the seasonality of Supplementary Fig. 2 is unrelated to the change in solar biophysical parameters in dense forest canopies even using high- zenith angle. frequency observations of visible – shortwave radiation data. The A similar methodology to capture seasonal change was well synergetic use of space lidar, which can observe the surface even validated in temperate forests using Himawari-8 Advanced under cloud cover, could help to observe the seasonality of the Himawari Imager (AHI) data56. The same type of analysis used in Amazon evergreen forest over the region where the ABI could not this study can be applied to other cloudy tropical regions, i.e. capture seasonality. The spaceborne lidars also can contribute to Southeast Asia and central Africa. Sensors similar to ABI but with understanding seasonal changes in forest structure under the different spatial coverage, such as the Himawari-8 AHI, canopy (e.g. ref. 54). FengYun-4 Advanced Geosynchronous Radiation Imager Regarding the issue of the Bidirectional Reflectance Distribu- (AGRI), and Meteosat Third Generation (MTG) Flexible Com- tion Function (BRDF), the small seasonal change in Amazon bined Imager (FCI), are able to enhance the long-term study of 8 NATURE COMMUNICATIONS | (2021)12:684 | https://doi.org/10.1038/s41467-021-20994-y | www.nature.com/naturecommunications
NATURE COMMUNICATIONS | https://doi.org/10.1038/s41467-021-20994-y                                                                                      ARTICLE

                                                                                       GOES-16 ABI products generated by the Geostationary-NASA Earth Exchange
                                                                                       (GeoNEX) project58. Band 2 has a 0.64 μm central wavelength and a 500 m spatial
                                                                                       resolution at nadir, while band 3 has a 0.86 μm central wavelength and a 1 km
                                                                                       spatial resolution. We averaged the 500 m band 2 data for every 2 × 2 pixel to create
                                                                                       a compatible 1 km resolution to use with the native 1 km band 3. We geocorrected
                                                                                       the 1-km band 2 and band 3 data using the original 500-m band 2 data to match
                                                                                       the coastlines of North and South America. Reflectance was calculated by dividing
                                                                                       the radiance data by the cosine of the solar zenith angle. We then calculated the
                                                                                       1-km TOA NDVI from 1-km band 2 and band 3 TOA reflectance. Details of the
                                                                                       process can be found in ref. 58.
                                                                                          We used TOA NDVI instead of surface NDVI. Despite ongoing efforts to
                                                                                       correct atmospheric and angular (e.g., BRDF) effects from the ABI data58,
                                                                                       additional uncertainties may be introduced in these corrections, which are still
                                                                                       under evaluation. Therefore, we used a straightforward TOA NDVI in this analysis
                                                                                       and adopted robust techniques to address the cloud contamination issue.

                                                                                       MODIS datasets. The collection 6 MODIS NDVI products, MOD13A2 and
                                                                                       MYD13A2, contain 16-day composites of 1 km NDVI from the Terra and Aqua
                                                                                       platforms, respectively48. The MODIS NDVI products are calculated from the
                                                                                       surface reflectance, not TOA reflectance, and corrected for the atmosphere and
                                                                                       BRDF. The pixel reliability data in MOD13A2 and MYD13A2 were also extracted.
                                                                                       A reliability code of 0 means, “Good data—use with confidence”, while 1 means,
                                                                                       “Marginal data – Useful, but look at other QA information.” The overpass time of
                                                                                       Terra and Aqua are approximately 10:30 a.m. and 1:30 p.m. local time, respectively.
                                                                                       The precise overpass times of Terra and Aqua were obtained from MOD09GA and
                                                                                       MYD09GA surface reflectance datasets, which contain the daily overpass infor-
Fig. 7 Map of the mean NDVI difference between the highest Normalized                  mation as metadata. As we did with ABI data, we extracted the time series of the
Difference Vegetation Index (NDVI) season and the lowest-NDVI season                   MODIS product pixel data at Km34 and RJA in 2018.
for each pixel over the evergreen forest in 2018. The white region had no                 In addition, we compared the MODIS MAIAC 1-km reflectance product,
statistically significant (p < 0.05) difference between the highest NDVI                MCD19A1 version 659, with ABI data. Because the MAIAC algorithm can provide
                                                                                       more cloud-cleared data in the Amazon basin31, several studies have used
season and the lowest NDVI season by the one-sided two-sample t tests                  MCD19A1 to calculate VIs for analysis of Amazon evergreen forest44,60. The
(n = 6).                                                                               MCD19A1 contains MODIS reflectance bands and QA flags including a snow flag.
                                                                                       Besides the cloud screening, MAIAC data are characterized by atmospheric
tropical evergreen forest. Correspondingly, the effort to combine                      correction and BRDF correction applied to MODIS reflectance. We extracted both
                                                                                       NDVI and EVI information for MODIS MAIAC products. The EVI was designed
new geostationary satellite sensors for analyses at the global scale                   to correct the residual aerosol effect by utilizing the aerosol sensitivity of the
will be useful for analysis of the entire tropical region.                             MODIS blue band48, and has more sensitivity to dense canopy structure than
   We have shown evidence that GOES ABI data are required to                           NDVI. Therefore, EVI has been frequently used for monitoring the seasonal
extend the discussion of seasonal and long-term trends in the                          change in Amazon forest greenness.
                                                                                          To exclude other than evergreen forest landcover, we identified the pixels
Amazon tropical forests. The high-frequency feature of GOES                            containing evergreen forest in the South America by using the MCD12Q1 land
ABI allows analyses to minimize cloud contamination from                               cover product61 (see Supplementary Fig. 1).
Amazon evergreen forest images effectively. In addition, we
conclude that Amazon basin analyses that only use sun-                                 Monthly precipitation data. We used the 0.25-degree Precipitation Estimation
synchronous satellite sensors are not trustworthy for revealing                        from Remotely Sensed Information using Artificial Neural Networks (PERSIANN)
seasonal change in greenness due to the residual cloud and                             monthly precipitation data62 to show the seasonal pattern of precipitation in 2018.
aerosol contamination.                                                                 The time series was extracted from the pixel containing the target point.
   By taking advantage of high-frequency observations, the GOES
ABI data revealed that seasonality occurs in 85% of Amazon                             AErosol RObotic NETwork (AERONET) data. We used spectral AOD data from
evergreen forests which the sun-synchronous sensors were not                           the Level 2 AERONET database Version 363. Three sites in the target area had
                                                                                       sufficient AOD data in 2018 (ATTO 2.14°S, 59.00°W, Alta Floresta Tower 9.87°S,
able to detect. We also found that ABI facilitates more detailed                       56.10°W, and Ji Parana SE Tower 10.93°S, 61.85°W) (see the location in Supple-
mapping of Amazon evergreen forest seasonality, whereas                                mentary Fig. 1). AOD were provided every 15 min under clear sky conditions. We
MODIS or lidar images could not analyze such regional and high-                        used the AOD at 500 nm. To identify the AOD at the time of MVC NDVI, we
temporal seasonality. Algorithms to correct for residual aerosol                       searched the AOD observations at the time between plus and minus 7.5 minutes of
                                                                                       satellite sensor observed time.
and BRDF for ABI are in progress to generate surface reflectance
as GOES products. These correction algorithms will be able to
contribute more precise analysis of seasonal change or long-term                       Maximum value composite (MVC). The MVC was developed to minimize
                                                                                       atmospheric effects on NDVI33. The MVC finds the highest NDVI in the defined
trends in Amazon evergreen forests in the future.                                      time period (e.g. 16-day or month) and assumes that the highest NDVI is the
                                                                                       closest value to the NDVI without atmospheric effects.
Methods
Two study sites (Km34 and RJA). To scrutinize hourly and seasonal change in            Statistical test to identify the seasonality of the evergreen forest. Unlike
NDVI of the Amazon basin, we picked two well-studied sites, Reserva Cuieiras near      MODIS observation data, GOES 16-day MVC can provide sufficiently clear day
Manaus (designated “Km34,” 2.61°S, 60.21°W)32, and Reserva Jaru (designated            NDVI in the wet seasons to apply statistical significance tests for the seasonality in
“RJA,” 10.08°S, 61.93°W)37. The land cover at Km34 is tropical evergreen broadleaf     NDVI of Amazon evergreen forest. First, we defined the high-NDVI season as the
forest with mean annual precipitation of above 2500 mm/year. It has a weak dry         consecutive three months that have the highest mean NDVI, and the low-NDVI
season from approximately June to September. Most of rainfall occurs between           season as the consecutive three months that have the lowest mean NDVI. The
11 a.m. and 5 p.m. local time32. RJA is the same terra firme forest, but has a strong   consecutive three-month period should have six 16-day MVC NDVIs. Then, we
dry season from June to September. The landcover of RJA can be deemed tropical         used the one-sided two-sample t test to determine the significance of the difference
semideciduous forest as a subclass of tropical evergreen forest57. We extracted the    in NDVIs between the high-NDVI season and the low-NDVI season using the
15-min NDVI time series from the corresponding ABI pixel in the 2018 NDVI data         Python SciPy function “ttest_ind”64. The null hypothesis of the test was that there
to represent seasonal reflectance variations of Amazon evergreen forests.               was no difference between the set of NDVIs of the two seasons, and we rejected the
                                                                                       null hypothesis when the p-value was less than 0.05. For every pixel classified as
                                                                                       evergreen forest, we plotted the first month of the high-NDVI season (Fig. 5g) and
GOES-16 ABI data. We calculated TOA NDVI from band 2 and band 3 TOA                    the low-NDVI season (Fig. 5h) when the NDVI in the two seasons were statistically
reflectances of GOES-16 ABI in 2018 and 2019. The TOA reflectance is one of the          significant.

NATURE COMMUNICATIONS | (2021)12:684 | https://doi.org/10.1038/s41467-021-20994-y | www.nature.com/naturecommunications                                                   9
ARTICLE NATURE COMMUNICATIONS | https://doi.org/10.1038/s41467-021-20994-y
Reporting summary. Further information on research design is available in the Nature 22. Samanta, A., Ganguly, S., Vermote, E., Nemani, R. R. & Myneni, R. B. Why is
Research Reporting Summary linked to this article. remote sensing of Amazon forest greenness so challenging? Earth Interact. 16,
1–14 (2012).
23. Lyapustin, A., Wang, Y., Laszlo, I. & Korkin, S. Improved cloud and snow
Data availability screening in MAIAC aerosol retrievals using spectral and spatial analysis.
All GOES ABI data used in this study are publicly available through the NASA GeoNEX
Atmos. Meas. Tech. 5, 843–850 (2012).
website: https://www.nasa.gov/geonex/dataproducts. All MODIS data used in this study
24. Hilker, T. et al. Vegetation dynamics and rainfall sensitivity of the Amazon.
are publicly available through NASA’s Land Processes Distributed Active Archive Center
Proc. Natl Acad. Sci. USA 111, 16041–16046 (2014).
(LP DAAC: https://lpdaac.usgs.gov. Tower data are publicly available through the Large-
25. Schmit, T. J. et al. A closer look at the ABI on the GOES-R series. Bull. Am.
Scale Biosphere-Atmosphere Experiment in Amazonia, LBA-ECO: https://doi.org/
Meteorol. Soc. 98, 681–698 (2017).
10.3334/ORNLDAAC/1174 and FLUXNET 2015: https://fluxnet.org/data/fluxnet2015-
26. Wu, J. et al. Leaf development and demography explain photosynthetic
dataset/.
seasonality in Amazon evergreen forests. Science 351, 972–976 (2016).
27. Chave, J. et al. Regional and seasonal patterns of litterfall in tropical South
Code availability America. Biogeosciences 7, 43–55 (2010).
Python code to handle GOES ABI TOA products at NASA GeoNEX is available at 28. Samanta, A. et al. Seasonal changes in leaf area of Amazon forests from leaf
https://doi.org/10.5281/zenodo.4318065. flushing and abscission. J. Geophys. Res. Biogeosci. 117, G01015 (2012).
29. Brando, P. M. et al. Seasonal and interannual variability of climate and
vegetation indices across the Amazon. Proc. Natl Acad. Sci. USA 107,
Received: 13 March 2020; Accepted: 4 January 2021; 14685–14690 (2010).
30. Myneni, R. B., Nemani, R. R. & Running, S. W. Estimation of global leaf area
index and absorbed PAR using radiative transfer models. IEEE Trans. Geosci.
Remote Sens. 35, 1380–1393 (1997).
31. Hilker, T. et al. On the measurability of change in Amazon vegetation from
MODIS. Remote Sens. Environ. 166, 233–242 (2015).
References 32. Araújo, A. C. et al. Comparative measurements of carbon dioxide fluxes from
1. Cox, P. M. et al. Sensitivity of tropical carbon to climate change constrained by two nearby towers in a central Amazonian rainforest: The Manaus LBA site. J.
carbon dioxide variability. Nature 494, 341–344 (2013). Geophys. Res. 107, 8090 (2002).
2. Guimberteau, M. et al. Impacts of future deforestation and climate change 33. Holben, B. N. Characteristics of maximum-value composite images from
on the hydrology of the Amazon Basin: a multi-model analysis with a new temporal AVHRR data. Int. J. Remote Sens. 7, 1417–1434 (1986).
set of land-cover change scenarios. Hydrol. Earth Syst. Sci. 21, 1455–1475 34. Galvão, L. S., Ponzoni, F. J., Epiphanio, J. C. N., Rudorff, B. F. T. & Formaggio,
(2017). A. R. Sun and view angle effects on NDVI determination of land cover types
3. Marengo, J. A. & Espinoza, J. C. Extreme seasonal droughts and floods in the Brazilian Amazon region with hyperspectral data. Int. J. Remote Sens.
in Amazonia: causes, trends and impacts. Int. J. Climatol. 36, 1033–1050 25, 1861–1879 (2004).
(2016). 35. Fensholt, R., Huber, S., Proud, S. R. & Mbow, C. Detecting canopy water status
4. Jimenez, J. C. et al. Spatio-temporal patterns of thermal anomalies and using shortwave infrared reflectance data from polar orbiting and
drought over tropical forests driven by recent extreme climatic anomalies. geostationary platforms. IEEE J. Sel. Top. Appl. Earth Obs. Remote Sens 3,
Philos. Trans. R. Soc. B Biol. Sci. 373, 20170300 (2018). 271–285 (2010).
5. Phillips, O. L. et al. Drought sensitivity of the Amazon rainforest. Science 323, 36. Gao, F., Jin, Y., Li, X., Schaaf, C. B. & Strahler, A. H. Bidirectional NDVI and
1344–1347 (2009). atmospherically resistant BRDF inversion for vegetation canopy. IEEE Trans.
6. Kumar, J., Hoffman, F. M., Hargrove, W. W. & Collier, N. Understanding the Geosci. Remote Sens. 40, 1269–1278 (2002).
representativeness of FLUXNET for upscaling carbon flux from eddy 37. Kruijt, B. et al. The robustness of eddy correlation fluxes for Amazon rain
covariance measurements. Earth Syst. Sci. Data Discuss. 1–25 (2016). https:// forest conditions. Ecol. Appl. 14, 101–113 (2004).
doi.org/10.5194/essd-2016-36 38. Galvão, L. S. et al. On intra-annual EVI variability in the dry season of tropical
7. Baldocchi, D. et al. FLUXNET: A new tool to study the temporal and spatial forest: A case study with MODIS and hyperspectral data. Remote Sens.
variability of ecosystem-scale carbon dioxide, water vapor, and energy flux Environ. 115, 2350–2359 (2011).
densities. Bull. Am. Meteorol. Soc. 82, 2415–2434 (2001). 39. NOAA National Centers for Environmental Information. State of the Climate:
8. Girardin, C. A. J. et al. Seasonal trends of Amazonian rainforest phenology, Global Climate Report for Annual 2018. (2019). Available at: https://www.
net primary productivity, and carbon allocation. Glob. Biogeochem. Cycles 30, ncdc.noaa.gov/sotc/global/201813. (Accessed: 18th June 2019)
700–715 (2016). 40. Andreae, M. O. et al. The Amazon Tall Tower Observatory (ATTO): Overview
9. Running, S. W. et al. A continuous satellite-derived measure of global of pilot measurements on ecosystem ecology, meteorology, trace gases, and
terrestrial primary production. Bioscience 54, 547–560 (2004). aerosols. Atmos. Chem. Phys. 15, 10723–10776 (2015).
10. Malhi, Y. & Wright, J. Spatial patterns and recent trends in the climate of 41. Kobayashi, H. & Dye, D. G. Atmospheric conditions for monitoring the long-
tropical rainforest regions. Philos. Trans. R. Soc. B Biol. Sci. 359, 311–329 term vegetation dynamics in the Amazon using normalized difference
(2004). vegetation index. Remote Sens. Environ. 97, 519–525 (2005).
11. Huete, A. R. et al. Amazon rainforests green-up with sunlight in dry season. 42. Xu, L. et al. Satellite observation of tropical forest seasonality: spatial patterns
Geophys. Res. Lett. 33, L06405 (2006). of carbon exchange in Amazonia. Environ. Res. Lett. 10, 084005 (2015).
12. Morton, D. C. et al. Amazon forests maintain consistent canopy structure and 43. Doughty, R. et al. TROPOMI reveals dry-season increase of solar-induced
greenness during the dry season. Nature 506, 221–224 (2014). chlorophyll fluorescence in the Amazon forest. Proc. Natl Acad. Sci. USA 116,
13. Myneni, R. B. et al. Large seasonal swings in leaf area of Amazon rainforests. 22393–22398 (2019).
Proc. Natl Acad. Sci. USA 104, 4820–4823 (2007). 44. Bi, J. et al. Sunlight mediated seasonality in canopy structure and
14. Morton, D. C. et al. Morton et al. reply. Nature 531, E6–E6 (2016). photosynthetic activity of Amazonian rainforests. Environ. Res. Lett. 10,
15. Saleska, S. R. et al. Dry-season greening of Amazon forests. Nature 531, E4–E5 064014 (2015).
(2016). 45. Nemani, R. R. et al. Climate-driven increases in global terrestrial net primary
16. Saleska, S. R., Didan, K., Huete, A. R. & Da Rocha, H. R. Amazon forests production from 1982 to 1999. Science 300, 1560–1563 (2003).
green-up during 2005 drought. Science 318, 612 (2007). 46. Wu, J. et al. Biological processes dominate seasonality of remotely sensed
17. Samanta, A. et al. Amazon forests did not green-up during the 2005 drought. canopy greenness in an Amazon evergreen forest. N. Phytol. 217, 1507–1520
Geophys. Res. Lett. 37, LG05401 (2010). (2018).
18. Samanta, A. et al. Comment on ‘Drought-induced reduction in global 47. Tang, H. & Dubayah, R. Light-driven growth in Amazon evergreen forests
terrestrial net primary production from 2000 through 2009’. Science 333, 1093 explained by seasonal variations of vertical canopy structure. Proc. Natl Acad.
(2011). Sci. USA 114, 2640–2644 (2017).
19. Xu, L. et al. Widespread decline in greenness of Amazonian vegetation due to 48. Huete, A. et al. Overview of the radiometric and biophysical performance of
the 2010 drought. Geophys. Res. Lett. 38, L07402 (2011). the MODIS vegetation indices. Remote Sens. Environ. 83, 195–213 (2002).
20. Atkinson, P. M., Dash, J. & Jeganathan, C. Amazon vegetation greenness as 49. Justice, C. O., Townshend, J. R. G., Holben, A. N. & Tucker, C. J. Analysis of
measured by satellite sensors over the last decade. Geophys. Res. Lett. 38, the phenology of global vegetation using meteorological satellite data. Int. J.
L19105 (2011). Remote Sens. 6, 1271–1318 (1985).
21. Zhao, M. & Running, S. W. Drought-induced reduction in global terrestrial 50. Badgley, G., Anderegg, L. D., Berry, J. A. & Field, C. B. Terrestrial gross
net primary production from 2000 through 2009. Science 329, 940–943 primary production: Using NIRv to scale from site to globe. Glob. Chang. Biol.
(2010). 25, 3731–3740 (2019).
10 NATURE COMMUNICATIONS | (2021)12:684 | https://doi.org/10.1038/s41467-021-20994-y | www.nature.com/naturecommunicationsNATURE COMMUNICATIONS | https://doi.org/10.1038/s41467-021-20994-y ARTICLE
51. Piao, S. et al. Evidence for a weakening relationship between interannual and MODIS projects. S.L. is supported by the Guizhou Province Science and Technology
temperature variability and northern vegetation activity. Nat. Commun. 5, 1–7 Foundation ([2018]2200). H.T. and A.H. are partially supported by the JST/CREST/
(2014). EMS/TEEDDA fund JPMJCR15K4 (Japan) and funds from the Virtual Laboratory/
52. Myneni, R. B., Hall, F. G., Sellers, P. J. & Marshak, A. L. The interpretation of Ministry of Education, Culture, Sports, Science, and Technology (Japan).
spectral vegetation indexes. IEEE Trans. Geosci. Remote Sens. 33, 481–486
(2019).
53. Sellers, P. J. Canopy reflectance, photosynthesis and transpiration. Int. J.
Author contributions
H.H., W.W., R.B.M. and R.R.N. designed the experiment. H.H., W.W. and S.L. analyzed
Remote Sens 6, 1335–1372 (1985).
satellite data. A.R.M., T.H. and H.A. organized and preprocessed the GOES dataset. H.H.
54. Smith, M. N. et al. Seasonal and drought‐related changes in leaf area profiles
and J.L.D. drafted the manuscript and finalized it with contributions from all authors.
depend on height and light environment in an Amazon forest. N. Phytol. 222,
1284–1297 (2019).
55. Goward, S. N. & Huemmrich, K. F. Vegetation canopy PAR absorptance and Competing interests
the normalized difference vegetation index: An assessment using the SAIL The authors declare no competing interests.
model. Remote Sens. Environ. 39, 119–140 (1992).
56. Miura, T., Nagai, S., Takeuchi, M., Ichii, K. & Yoshioka, H. Improved
characterisation of vegetation and land surface seasonal dynamics in central Additional information
Japan with Himawari-8 hypertemporal data. Sci. Rep. 9, 1–12 (2019). Supplementary information The online version contains supplementary material
57. Da Rocha, H. R. et al. Patterns of water and heat flux across a biome gradient available at https://doi.org/10.1038/s41467-021-20994-y.
from tropical forest to savanna in Brazil. J. Geophys. Res. Biogeosci. 114,
G00B12 (2009). Correspondence and requests for materials should be addressed to H.H.
58. Wang, W. et al. An introduction to the Geostationary-NASA Earth Exchange
(GeoNEX) Products: 1. Top-of-atmosphere reflectance and brightness Peer review information Nature Communications thanks Lina Mercado, Douglas
temperature. Remote Sens. 12, 1267 (2020). Morton, Stuart Phinn and the other, anonymous, reviewer(s) for their contribution to the
59. Lyapustin, A., Martonchik, J., Wang, Y., Laszlo, I. & Korkin, S. Multiangle peer review of this work.
implementation of atmospheric correction (MAIAC): 1. Radiative transfer
basis and look-up tables. J. Geophys. Res. 116, D03210 (2011). Reprints and permission information is available at http://www.nature.com/reprints
60. de Moura, Y. M. et al. Spectral analysis of Amazon canopy phenology during
the dry season using a tower hyperspectral camera and MODIS observations. Publisher’s note Springer Nature remains neutral with regard to jurisdictional claims in
ISPRS J. Photogramm. Remote Sens. 131, 52–64 (2017). published maps and institutional affiliations.
61. Friedl, M. A. et al. MODIS Collection 5 global land cover: Algorithm
refinements and characterization of new datasets. Remote Sens. Environ. 114,
168–182 (2010). Open Access This article is licensed under a Creative Commons
62. Sorooshian, S. et al. Evaluation of PERSIANN system satellite-based estimates Attribution 4.0 International License, which permits use, sharing,
of tropical rainfall. Bull. Am. Meteorol. Soc. 81, 2035–2046 (2000). adaptation, distribution and reproduction in any medium or format, as long as you give
63. Sinyuk, A. et al. The AERONET Version 3 aerosol retrieval algorithm, appropriate credit to the original author(s) and the source, provide a link to the Creative
associated uncertainties and comparisons to Version 2. Atmos. Meas. Tech. 13, Commons license, and indicate if changes were made. The images or other third party
3375–3411 (2020). material in this article are included in the article’s Creative Commons license, unless
64. Virtanen, P. et al. SciPy 1.0: Fundamental algorithms for scientific computing indicated otherwise in a credit line to the material. If material is not included in the
in Python. Nat. Methods 17, 261–272 (2020). article’s Creative Commons license and your intended use is not permitted by statutory
regulation or exceeds the permitted use, you will need to obtain permission directly from
the copyright holder. To view a copy of this license, visit http://creativecommons.org/
Acknowledgements licenses/by/4.0/.
This research is supported through funding for NEX (NASA Earth Exchange) from
NASA’s Earth Science Division. Products from the GOES ABI were provided by the
This is a U.S. government work and not under copyright protection in the U.S.; foreign
GeoNEX project at NASA Ames Research Center (https://nasa.gov/geonex). We would
copyright protection may apply 2021
like to acknowledge the principal investigators of the flux sites, AERONET, PERSIANN,
NATURE COMMUNICATIONS | (2021)12:684 | https://doi.org/10.1038/s41467-021-20994-y | www.nature.com/naturecommunications 11You can also read