SOFTWARE USER GUIDE Release 2.1.5 - AmphaSoft 2_0 User Guide
←
→
Page content transcription
If your browser does not render page correctly, please read the page content below
SOFTWARE USER GUIDE
                                       Release 2.1.5

Amphasys, Technopark Lucerne, CH-6039 Root D4, Switzerland | Phone +41 41 541 91 20 | www.amphasys.com
AmphaSoft 2.0 User Guide

Contents

1   Introduction ...............................................................................................................................4

2   AmphaSoft 2.0 Software Structure ...........................................................................................5
    2.1       Operation Modes .......................................................................................................................... 5
    2.2       Starting AmphaSoft 2.0................................................................................................................. 5
    2.3       The Workspace Concept .............................................................................................................. 6
    2.4       Static Software Components ......................................................................................................... 6
    2.4.1     Main Menu ................................................................................................................................... 6
    2.4.2     Navigation Panel .......................................................................................................................... 7
    2.4.3     Status and Progress Bar ............................................................................................................... 7
    2.5       Dynamic Software Components (tabs) .......................................................................................... 7
    2.5.1     The Measurement tab................................................................................................................... 8
    2.5.2     The Worklist ............................................................................................................................... 12
    2.5.3     The Basic tab ............................................................................................................................. 17
    2.5.4     The Advanced tab ...................................................................................................................... 18
    2.5.5     The Admin tab ............................................................................................................................ 22
    2.6       Data Saving ............................................................................................................................... 24
    2.7       File Structure.............................................................................................................................. 24

3   Measuring with AmphaSoft 2.0 ............................................................................................... 25
    3.1       Software Structure – Introduction to the Main Components .......................................................... 25
    3.2       Instrument and Software Setup ................................................................................................... 26
    3.3       Experiment Setup ....................................................................................................................... 27
    3.3.1     Single measurement with default settings .................................................................................... 27
    3.3.2     Measurements with customized settings ..................................................................................... 28
    3.3.3     Continuing measuring using an existing Workspace .................................................................... 29
    3.3.4     Counting mode ........................................................................................................................... 30

4   Creating and Using Templates ............................................................................................... 31
    4.1       Creating a Template ................................................................................................................... 31
    4.2       Loading a Template .................................................................................................................... 31

5   Data Analysis........................................................................................................................... 32
    5.1       Changing the Number of Plots .................................................................................................... 32
    5.2       Adjusting the Scatterplot Characteristics ..................................................................................... 32
    5.2.1     Scatterplot Axes (Zooming)......................................................................................................... 32
    5.2.2     Size of Data Points ..................................................................................................................... 33
    5.2.3     Density Plot Appearance ............................................................................................................ 33
    5.3       Gating ........................................................................................................................................ 33
    5.4       Hide Cells (Professional license required) ................................................................................... 35
    5.4.1     Hiding ........................................................................................................................................ 36

    Amphasys, Technopark Lucerne, CH-6039 Root D4, Switzerland | Phone +41 41 541 91 20 | www.amphasys.com

                                                                                                                                                       2 / 56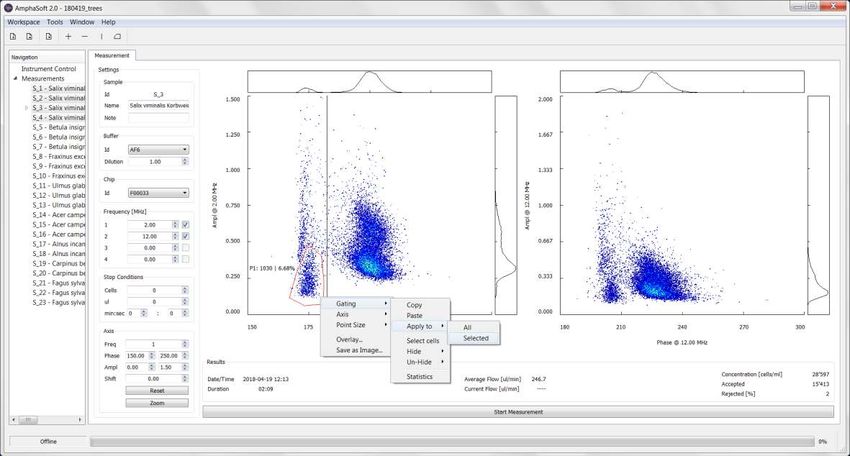
AmphaSoft 2.0 User Guide

     5.4.2     Unhiding .................................................................................................................................... 36
     5.5       Advanced Gate Statistics (Professional license required) ............................................................. 36
     5.6       Overlay of plots (Professional license required) ........................................................................... 37
     5.7       Exporting Plots ........................................................................................................................... 37
     5.8       Exporting Impedance Data (Professional license required)........................................................... 38
     5.9       Reporting ................................................................................................................................... 38

6    Chip Tests................................................................................................................................ 41
     6.1       Measurement Chip Test.............................................................................................................. 41
     6.1.1     Performing a Measurement Chip Test ......................................................................................... 41
     6.1.2     Chip Information ......................................................................................................................... 42
     6.2       CalibChip Test............................................................................................................................ 43
     6.2.1     Performing a CalibChip Test ....................................................................................................... 43
     6.2.2     Performing a Pulse Test ............................................................................................................. 44

7    Transferring Workspaces from AmphaSoft 1.2.8 to AmphaSoft 2.0 .................................... 46

8    Installation and Updates ......................................................................................................... 47
     8.1       System Requirements ................................................................................................................ 47
     8.2       AmphaSoft 2.0 PC Software Installation ...................................................................................... 47
     8.3       AmphaSoft 2.0 PC Software Update ........................................................................................... 48
     8.4       Instrument Software and Firmware Updates ................................................................................ 49

9    Licensing ................................................................................................................................. 52
     9.1       Uploading a License ................................................................................................................... 52
     9.2       Activation of a License ................................................................................................................ 53
     9.3       Deactivation of a License ............................................................................................................ 53
     9.4       AmphaFlex................................................................................................................................. 54

10   Troubleshooting ...................................................................................................................... 55

11   Warranty and Technical Support ............................................................................................ 56
     11.1      Limited Warranty ........................................................................................................................ 56
     11.2      Extended Warranty ..................................................................................................................... 56
     11.3      Support ...................................................................................................................................... 56

     Amphasys, Technopark Lucerne, CH-6039 Root D4, Switzerland | Phone +41 41 541 91 20 | www.amphasys.com

                                                                                                                                                       3 / 56
AmphaSoft 2.0 User Guide
1 Introduction
AmphaSoft 2.0 is the software used to operate the Ampha Z32 Impedance Flow Cytometer.
It is used for any operation of the instrument, such as setting up measurements, performing
measurements, data analysis, reporting and maintenance. AmphaSoft 2.0 runs on a
Windows-based laptop PC. The name AmphaSoft 2.0 includes all releases 2.x.y.
The PC software and the corresponding instrument software and firmware are available from
the Amphasys website. Software licenses can be obtained from Amphasys.
For more information about the Ampha Z32 Impedance Flow Cytometer, accessories, chips,
etc., please refer to the Ampha Z32 User Guide or visit our website
https://amphasys.com/ampha-z32-pollen-analyzer/ .
Licenses
The operation of the Ampha Z32 Impedance Flow Cytometer requires a license. Amphasys
provides several types of licenses:
Standard
This single license allows online instrument control (measurements and basic data
analysis) using 1 PC.
Professional
The professional licenses come in a bundle of 3 licenses and allow 3 PCs to connect
to 1 instrument for online and offline operation with extended data analysis options.
Measurement - AmphaFlex
License is limited to a predefined number of measurements and / or time period, e.g.
1 month or year and can be updated.
More information about the licensing can be found in chapter 9 Licensing.
Autosampler
The setup and use of the Ampha Z32 in combination with the Autosampler is described in the
Ampha Z32 User Guide.
Amphasys, Technopark Lucerne, CH-6039 Root D4, Switzerland | Phone +41 41 541 91 20 | www.amphasys.com
4 / 56
AmphaSoft 2.0 User Guide
2 AmphaSoft 2.0 Software Structure
This section provides detailed information about AmphaSoft 2.0 software structure, features
and buttons. If you intend to directly start a measurement, chapter 3 will guide you through
the setup steps.
2.1 Operation Modes
AmphaSoft 2.0 operates in either Online or Offline mode. Online refers to the state when an
instrument is actively connected to the PC. On the other hand, offline operation does not
require a connection to the instrument. The use of a standard license only allows online
operation, while other license types allow both offline and online operations.
Online Offline
Data Acquisition Planning of Experiments
Planning of Experiments Data Analysis
Data Analysis Reporting
Reporting
Further information about the Ampha Z32 instrument is supplied in the separate Ampha Z32
User Guide.
2.2 Starting AmphaSoft 2.0
After installation (see section 8.2 AmphaSoft 2.0 PC Software Installation),
AmphaSoft 2.0 can be started by double-clicking the AmphaSoft icon (Figure) on
your desktop. After a quick loading phase, the main graphical user interface (GUI)
is opened (Figure below).
Main Menu (static)
Navigation
Panel Measurement Tab (dynamic)
(static)
Status Section (static)
Amphasys, Technopark Lucerne, CH-6039 Root D4, Switzerland | Phone +41 41 541 91 20 | www.amphasys.com
5 / 56
AmphaSoft 2.0 User Guide
2.3 The Workspace Concept
Roughly, the AmphaSoft 2.0 GUI can be divided into static components that are always
visible and dynamic components that are only displayed when selected. Static components
comprise the Main Menu, the Navigation panel and the Status section. Dynamic components
are organized as individual tabs that can be selected. Examples include the Measurement,
Basic, Admin and Advanced tabs.
All these tabs are used to configure the instrument and to perform operations with a
workspace. A workspace contains measurement settings and measurement data. For each
experiment, a workspace is created and saved in a folder. This workspace can be loaded,
modified and saved.
2.4 Static Software Components
After starting AmphaSoft 2.0, the user faces the main software GUI, the Measurement tab.
The Measurement tab is surrounded by the static software components, namely Main Menu,
Navigation panel and Status section.
2.4.1 Main Menu
The Main Menu is located in the top part of the GUI.
The menu is divided into 4 sub-menus and 7 icons.
The icons are used for workspace management and
data analysis.
The 4 sub-menus are:
Workspace Create, load and save workspaces, save workspaces as templates or
exit the software. You can also use the 3 icons (New / Load / Save) to
manage workspaces.
Tools In the Tools menu, you can start a Chip Test to check the quality of your chips.
A dialogue will open and instruct how to perform the test. Details about the Chip Test
are explained in section 6 Chip Tests.
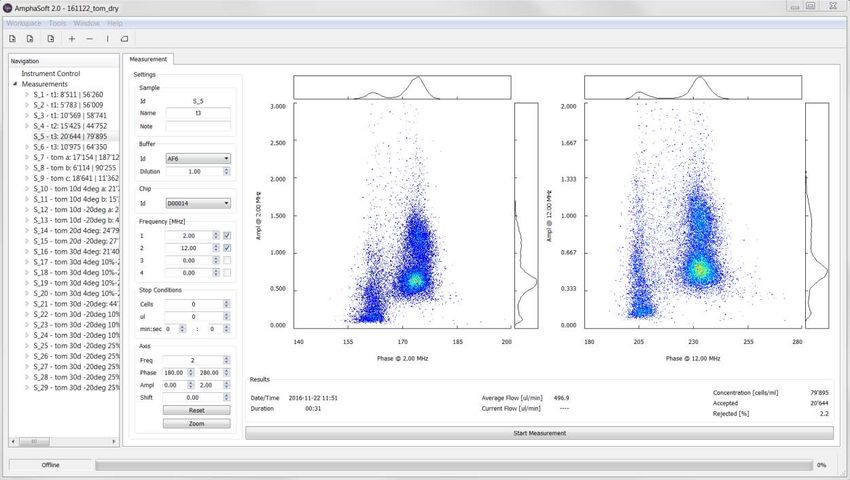
If you select Gating, you can apply gatings to your plots for data analysis. You can
choose between polygon, cross, horizontal and vertical gates. You can also use the 4
icons to choose gates. More information about data analysis is
provided in section 5 Data Analysis.
Window After setting up your preferred window layout (by undocking, adjusting and
repositioning tabs), you can save this configuration by clicking Window > Layout >
Save. When reopening AmphaSoft 2.0, retrieve your preferred layout by selecting
Window > Layout > Load.
Help Access software or instrument user guides. Check your software release and
license type under Help > About.
Amphasys, Technopark Lucerne, CH-6039 Root D4, Switzerland | Phone +41 41 541 91 20 | www.amphasys.com
6 / 56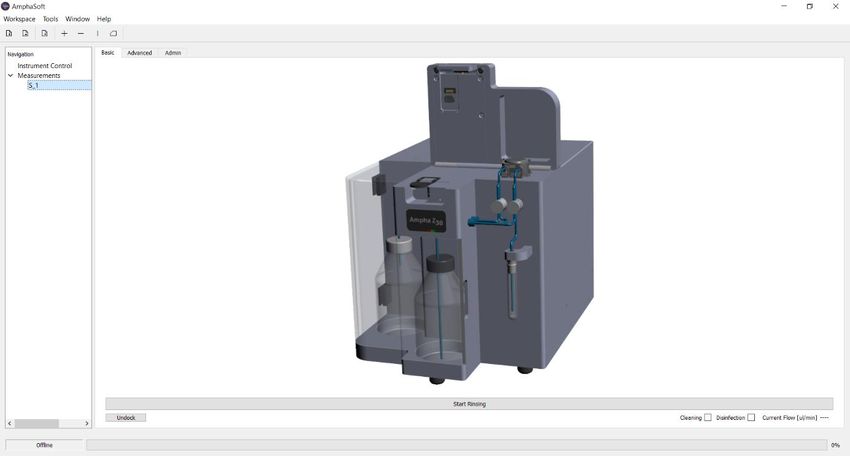
AmphaSoft 2.0 User Guide
2.4.2 Navigation Panel
The Navigation panel is used to navigate between individual tabs and measurements. It is
divided into 3 parts:
Instrument Control Clicking on Instrument Control opens access to the 3 tabs
Basic, Advanced and Admin.
Measurements Opens the Worklist for experimental setup.
S_1 Each measurement has an ID. S_1 is the ID of the first measurement. Clicking
on S_1 opens this particular measurement in the Measurement tab. In a series of
measurements, a list of S_1, S_2, S_3... will be visible. Individual measurements can
be selected by clicking on their ID.
Selected
Measurement
Measurement List
In a series of measurements, individual measurements can
be selected and their results will be displayed in the
Measurement tab. The numbers next to the Sample ID and
name are the number of measured cells and the
concentration of cells of the sample. These numbers will be
Sample ID
displayed after stopping the measurement.
Sample Number Concentration
name of cells of cells
Note that you can adjust the size of the Navigation panel by moving the separator between
Navigation panel and the tab on the right.
2.4.3 Status and Progress Bar
The status section at the bottom of the GUI consists of a status field and a progress bar. The
status field provides information about the instrument status, e.g. “offline”, “rinsing” or
“ready”. The progress bar shows the progress of actions, such as the loading process or
rinsing cycles.
Instrument status Progress bar Progress in %
2.5 Dynamic Software Components (tabs)
Dynamic software components are the tabs that can be opened and closed. AmphaSoft 2.0
has the following tabs:
Measurement tab The Measurement tab is used to start measurements, view
measurement results and perform data analysis.
Amphasys, Technopark Lucerne, CH-6039 Root D4, Switzerland | Phone +41 41 541 91 20 | www.amphasys.com
7 / 56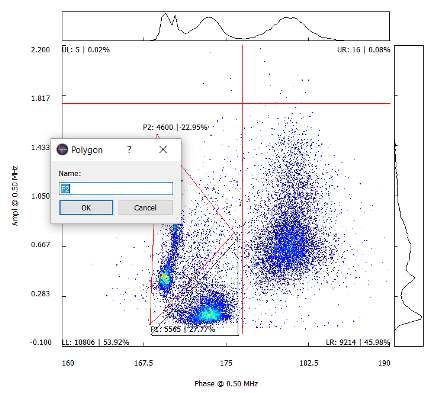
AmphaSoft 2.0 User Guide
Worklist In the Worklist, measurements can be added and deleted, and
measurement settings can be changed. In addition, measurement reports can be
generated in both .csv and .html format.
Instrument Control – Basic tab The Basic tab of the instrument control is used to
start rinsing, cleaning or disinfection cycles. In addition, it shows the sample flow rate
in real time.
Instrument Control – Advanced tab The Advanced tab contains measurement-
specific settings as well as general settings. A large plot can be used to display
impedance signals from your sample.
Instrument Control – Admin tab The Admin tab is used for instrument software
updates, for license activation and to manually disconnect or connect to the
instrument. In addition, the tubing set can be selected here.
In the following sections, these 5 tabs and their contents will be explained in depth.
2.5.1 The Measurement tab
The Measurement tab is used for performing a measurement, result display and data
analysis. This tab always displays one single measurement. During a measurement, it
provides real-time information about measurement parameters (e.g. average flow rate,
number of measured cells...). This tab can also be used to set up a measurement. However,
only the worklist provides the full range of setting possibilities for that purpose. Start and stop
measurements using the bar at the bottom of the tab.
The left part of the Measurement tab is divided into 6 sections:
Sample Displays the sample ID, the sample name and a note field. The sample ID
cannot be changed and is consecutive. Each sample should be named appropriately.
Amphasys, Technopark Lucerne, CH-6039 Root D4, Switzerland | Phone +41 41 541 91 20 | www.amphasys.com
8 / 56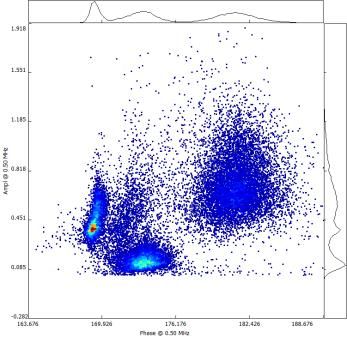
AmphaSoft 2.0 User Guide
Buffer Choose the buffer of your sample from the dropdown-list. If your buffer is not
in that list, enter it manually in the Worklist by creating a new list element (see section
2.5.2 The Worklist). A newly created buffer will be available for all other samples from
the dropdown list. In case you work with cells in suspension and you diluted the
sample with a measurement buffer, you can enter a dilution factor here.
Chip Choose the type of chip you intend to use with the sample. You can use the
dropdown menu to just select the chip type (A00000, B00000, C00000...). However, it
is recommended to enter the full chip number (e.g. D00123). This can be done in the
Worklist. After entering a new chip name in the Worklist, this name can be chosen
from the dropdown for other samples. Changing the chip type leads to the adaptation
of default measurement parameters, such as the pump speed.
Note The instrument will check if a chip of the selected type (e.g. type D or E) is
present in the chip holder. Please make sure that there is no mismatch between the
chip selection and the chip you place.
Plot display
Frequency (MHz) Choose the frequencies with which
you want to measure. The Ampha Z32 instrument can
measure 1, 2 or 4 frequencies simultaneously. As one
frequency typically may not give sufficient information and
4 frequencies increase the noise level of the system, two
frequencies are a good choice for most applications.
Typically, a low triggering frequency is entered into the
first frequency field (e.g. 2 MHz) and a higher frequency Frequency
Frequency in MHz
(e.g. 12 MHz) in the second field to give additional number
information. 2 MHz and 12 MHz are the default settings.
Entering and selecting frequencies
Frequencies can be entered manually in the frequency fields 1 to 4. They must be entered in
increasing order. The checkboxes on the right have only graphical implications. Each frequency
results in one scatterplot. Selecting a frequency leads to the display of that particular plot in the
Measurement tab. Deselecting one frequency removes the corresponding plot, but the measurement
setting is not changed. Remove frequencies by setting them to 0 (zero) MHz and not by deselecting
their plot display.
Note Changing the triggering frequency (first frequency) and adding additional frequencies
may require the adaptation of other parameters, such as the triggering source and direction,
level and gain settings. Please do not play around with these settings and contact our
application specialists if you feel insecure. These changes are in the Advanced tab possible.
Stop Conditions Stop conditions are criteria that will stop a measurement when the
condition is met. Stop conditions can be defined based on the following measurement
parameters:
o Cells Measurement stops as soon as a predefined number of cells have
been measured (e.g. 10’000 cells)
Amphasys, Technopark Lucerne, CH-6039 Root D4, Switzerland | Phone +41 41 541 91 20 | www.amphasys.com
9 / 56
AmphaSoft 2.0 User Guide
o µl Measurement stops as soon as a certain sample volume has been
measured (e.g. 1000 µl)
o min:sec Measurement stops as soon as the given time has passed (e.g. 1
min 30 sec).
Note There is no need to set stop conditions, as you can always stop manually. If multiple
conditions are set, the first one that is reached will stop the measurement (Boolean OR
logic). Typically, one or two stop conditions are set.
Example: Multiple Stop Conditions
This set of stop conditions will stop a measurement, as soon
as 10’000 cells have been measured, 1000 µl sample have
passed the chip or 1 minute and 30 seconds have passed
(whichever condition arrives first).
Axis The axis section is used to adjust axes of the plots in the Measurement tab.
The number of displayed plots can be changed in
the Frequency section. A plot can be activated for Plot selection
changes by either clicking into it, or by selecting it
(1, 2, 3 or 4) in the Freq. field. Phase and
Amplitude lower and upper axis limits are changed
by entering the desired values to the 2 fields next
to Phase and Ampl and confirming with Enter. An
entry into the Shift field will lead to a horizontal
shift of the population. The axes can be reset by
clicking on the Reset button. Clicking on the Zoom Lower
axis limits
button scales the axes automatically. When axis Upper Manual
limits are set to default, autozooming is activated axis limits Phase Shift
during the measurement. In case non-default axis
limits are set, the autozooming can be activated by clicking on Zoom during the
measurement. You can deactivate autozooming in the Instrument Control, Advanced
tab.
Scatterplots Each cell that crosses the microfluidic chip is interrogated using one or
several measurement frequencies. For each frequency, the cell generates a certain
response. Therefore, several results are obtained from one single cell. Depending on
the number of simultaneously applied frequencies, 1 to 4 scatterplots are displayed.
You can change the number of displayed plots by checking and unchecking the
boxes in the Frequency section.
Each measured cell will be represented as a dot in these 2-dimensional plots. The x-
axis of each scatterplot corresponds to the impedance phase and is labeled with the
corresponding frequency (e.g. Phase @ 2 MHz). Similarly, the y-axis corresponds to
the impedance amplitude and is also labeled with the corresponding frequency (e.g.
Ampl @ 2 MHz).
Amphasys, Technopark Lucerne, CH-6039 Root D4, Switzerland | Phone +41 41 541 91 20 | www.amphasys.com
10 / 56AmphaSoft 2.0 User Guide
You can change the appearance of the data points in several ways. In brief, clicking
into the plot activates the plot for changes. Clicking and dragging moves the field of
view, mouse scrolling zooms in or out, ctrl+scrolling changes the dot size and
alt+scrolling changes the density plot appearance. More information about data
analysis can be found in section 5 Data Analysis.
Results The results section is located below the scatterplots. It consists of 5
measurement parameters that are updated automatically during a measurement.
o Date/Time Information about when the measurement was started.
o Duration Time since starting the measurement.
o Average Flow Calculation of the average flow (in µl / min) based on the
amount of sample that has passed the flow sensor.
o Current Flow Shows the current flow rate during the measurement.
Note Air bubbles in the tubing may impede accurate flow rate measurements
and therefore affect concentration determinations.
o Concentration Calculation of the concentration of cells in your sample (in
cells / ml) based on the number of accepted cells and the measured volume of
liquid that has passed the flow sensor. After finishing the measurement, the
concentration will also be indicated next to the measurement ID, sample name
and the number of accepted cells in the Navigation panel. The concentration
is automatically multiplied with the dilution factor.
o Accepted Number of cells that have been measured. After finishing the
measurement, the number of accepted cells will also be indicated next to the
measurement ID in the Navigation panel.
o Rejected Percentage of signals or partial signals that do not fulfill the
triggering criteria. The rejection rate is a good indicator of proper
measurement settings (Triggering source, Triggering direction, Level) and
may also indicate fluidic problems. In case the rejection rate of a
measurement is higher than 15 %, a notification appears after stopping the
measurement.
Measurement Bar Below the results section is the measurement bar. This bar is
used to start and stop measurements.
Amphasys, Technopark Lucerne, CH-6039 Root D4, Switzerland | Phone +41 41 541 91 20 | www.amphasys.com
11 / 56AmphaSoft 2.0 User Guide
2.5.2 The Worklist
The worklist is the main tool for planning and setting up experiments. You can access the
worklist by clicking on Measurements in the Navigation panel. The worklist is organized as a
table. Each row corresponds to a measurement, and each column corresponds to a
particular setting.
Rows:
Measurements
Columns:
Settings
Row number
Add/delete multiple
measurements
Add/remove Merging of Reports
Add/delete settings Import sample names
measurements Reports
and notes from *.csv
Changing parameters
AmphaSoft 2.0 comes with a set of default parameters that work fine for most applications.
However, depending on your sample type, adjusted parameters may be beneficial. You can
simply edit the parameters in the worklist by double clicking into the field and entering a new
value. Please always confirm your entry by pressing Enter. Certain fields, such as the Buffer
ID and Chip ID, allow you to select from a dropdown menu or to enter your desired
description directly into the field. Your entry will create a new item on the dropdown list that
can be selected when setting up other measurements. Use this feature to specify the exact
chip number and select it for each measurement you perform with that chip.
Adding and deleting measurements
Rows can be added or removed by clicking on the (+) or (–) symbols in the bottom section of
the worklist. The (+) symbol adds one measurement as a copy in of the last measurement to
the list. The (–) symbol removes the last measurement of the list. If you intend to add or
remove several measurements, enter the number of measurements in the field next to the
add / remove buttons before clicking (+) or (-). You can only add or remove measurements at
the end of the worklist.
Display of custom settings
The worklist allows you to customize the number of settings (columns) that will be displayed.
By default, only a limited number of settings are visible. In order to add or remove settings,
Amphasys, Technopark Lucerne, CH-6039 Root D4, Switzerland | Phone +41 41 541 91 20 | www.amphasys.com
12 / 56AmphaSoft 2.0 User Guide
click on the (+/-) button in the bottom part and select or deselect the desired parameters.
Note that only the selected settings will also be mentioned in a report.
List of parameters
The following section is a list of all parameters that can be set in the worklist with
explanations.
Measurement Id (Id) The Id is an identification of each sample and should not be
changed.
Note Please do not change sample Ids.
Well Id (Wells) This feature is used for autosampler operation only. In the Wells
column, a sample can be assigned to a particular well of a 96 well plate.
Sample Name Use the Sample Name box to identify your sample by naming it
appropriately.
Buffer Id Select or enter the buffer name, in which your sample is suspended. A
range of buffers is available from the dropdown-list.
Dilution Enter a dilution factor in case you diluted a cell suspension with
measurement buffer. The measured concentration will automatically be multiplied with
the dilution factor.
Chip ID Enter the full chip name directly into the field and confirm with Enter (e.g.
D00123, one letter and 5 numbers) or select the chip you intend to use from the
dropdown menu in case you already defined it earlier. Changing the chip type leads
to the adaptation of the default measurement parameters for each chip.
Note The instrument will check if a chip of the selected type (e.g. type D or E) is
present in the chip holder. Please make sure that there is no mismatch between the
chip selection and the chip you place.
Freq 1 Here you enter the first measurement frequency, which is the default
triggering frequency. The impedance signals coming from the triggering frequency will
be used to judge if a signal is appropriate (i.e. identified as a cell or particle) or
rejected. For most applications, triggering at a low frequency (e.g. 2 MHz, default) is
recommended. The frequency range is between 0.1 and 30 MHz.
Note Changing the triggering frequency may require a change of other parameters,
such as the triggering source, triggering direction and level. Please do not play with
these parameters if you don’t feel confident. You can always ask our application
specialists for help. Changes are possible in the Advanced tab.
Please do not remove the frequency columns in the worklist.
Freq 2 Into this field, the second measurement frequency is entered. As the
triggering typically occurs at a low frequency, the second measurement frequency is
set at higher frequencies (e.g. 12 MHz).
Freq 3 and 4 In case you intend to measure with more than 2 frequencies, you can
add the third and fourth frequency here (increasing order). Measuring with 3
Amphasys, Technopark Lucerne, CH-6039 Root D4, Switzerland | Phone +41 41 541 91 20 | www.amphasys.com
13 / 56AmphaSoft 2.0 User Guide
frequencies is not possible and after entering the third frequency, a fourth identical
frequency will automatically be entered. You can however alter this fourth frequency.
Note Increasing the number of measurement frequencies increases the noise level
of the measurement. This decreases the signal to noise properties and further
adjustments of the level or gain settings may be beneficial or required.
Trig Freq The triggering algorithm uses the impedance data of frequency 1 (usually
2 MHz) by default. If you want another frequency for triggering, change the frequency
number here. You may need to reconfigure the triggering algorithm.
Stop Cond Cells You can define a stop condition to stop the measurement
automatically, as soon as the criteria are met. The Stop Cond Cells is a condition, in
which a defined number of accepted cells must be reached. Possible values are
between 0 and 10 million.
Stop Cond µl This stop condition refers to the sample volume that passed the flow
sensor. Enter a value between 0 and 10’000 μl (microliters) to stop the measurement
after this volume has been measured. Use a reasonable value.
Stop Cond min This stop condition stops the measurement after a predefined time
(in minutes). Any value between 0 and 99 is possible. You can define the time
condition more precisely by adding seconds using the Stop Cond sec criteria (see
below).
Stop Cond sec This stop condition stops the measurement after a predefined time
(in seconds) has passed. Any value between 0 and 59 is possible. You can combine
this time condition with the Stop Cond min criteria (see above).
Pump speed Here you can change the pump speed for your measurement (in
revolutions per minute, rpm). The pump speed depends on the pump head of your
instrument and the chip. Amphasys provides default pump speeds for each chip type
(section 6.1.1 Performing a Measurement Chip Test). These speeds result in
appropriate sampling of your signals and low rejection rates. It is therefore not
recommended to change pump speeds.
Load The loading process is used to aspirate the sample and to load it into the chip
and flow sensor before the measurement starts. By default Load is active (1). In case
you want to skip loading and start with the measurement immediately, enter 0 (zero).
In the Counting mode Load is used to drain the lines and to notify you when to
place the sample.
Counting The Counting mode is a volumetric measurement to determine the correct
sample concentration. The counting mode is configured by entering 1 (one). It
requires a volume stop condition. The volume stop condition must correspond to the
volume of sample that you want to measure. The counting mode is only applicable for
F, D and E chips.
Mod The Modulation is the first part of the gain settings. Changing the modulation
changes the peak voltage that is applied to the electrodes. Modulation values range
from 1 to 5.
Amphasys, Technopark Lucerne, CH-6039 Root D4, Switzerland | Phone +41 41 541 91 20 | www.amphasys.com
14 / 56AmphaSoft 2.0 User Guide
Ampl The Amplification is the second part of the gain settings. The amplifier is an
electronic component that increases the signal strength. Amplification values between
1 and 8 are possible.
Dem The Demodulation is the third part of the gain settings. Demodulation is the
step, where the information of multiple frequencies is separated. Demodulation
values range from 0 to 8. It is recommended to work with low demodulations (0 to 2).
Note The gain settings have a strong impact on the signal amplitude and the signal-
to-noise ratio. When changing gain settings, please make sure you check your level
settings.
Trig Level The triggering level is an important setting. It is a criterion that defines
which impedance signals are high enough to originate from a cell and which ones are
coming from noise or debris. Details are shown in the following figure.
AmphaSoft 2 Signal Processing
The Ampha Z32 Impedance Flow
Cytometer measures impedance signals Cell 1 Cell 2
and then processes these signals using a Baseline
real part (x)
triggering algorithm. The impedance
signals always consist of a real (x, blue) imaginary part (y)
Amplitude (V)
and an imaginary part (y, green).
If there is no cell in the measurement unit,
the signal is a baseline at zero amplitude.
When cells are crossing the electrodes,
Triggering
impedance signals in the form of opposite Level
double-pulses are measured. The
algorithm identifies such pulse pairs and
Signal Amplitude
finds their signal amplitude. This data is Pulse Pair
then further processed and displayed in
the scatterplots of the Measurement tab. Length (ms)
Note The triggering level strongly depends on the gain settings. Gain settings modify
the size of the signals and the signal-to-noise ratio. If you change the gain, please make
sure you also adjust the triggering level accordingly. Setting the triggering level too low
will lead to triggering of noise and debris. Setting it too high will lead to the loss of cells.
Both scenarios can impede accurate concentration determinations and may bias your
results.
Trig Src This parameter is the selection of the triggering source. During a
measurement, the triggering algorithm will process the signal of the triggering source
to find impedance signals from cells. As impedance is a complex quantity, the raw
signal of your triggering frequency (Frequency 1) consists of a real and an imaginary
part. In the Advanced tab, the real part of the triggering frequency is displayed in blue
(x), and the imaginary part in green (y). The component with the higher absolute
signal amplitude is typically taken as the triggering source. Depending on your signal
properties, select x or y to be the triggering source. For most applications with low
Amphasys, Technopark Lucerne, CH-6039 Root D4, Switzerland | Phone +41 41 541 91 20 | www.amphasys.com
15 / 56AmphaSoft 2.0 User Guide
triggering frequencies (e.g. 2 MHz), the real part of the signal (x) is the appropriate
triggering source.
Note Please do not adjust the triggering source without knowledge of the signal
properties. Contact Amphasys for further questions.
Trig Dir The triggering direction is another parameter to configure the triggering
algorithm. Depending on the triggering frequency, the selected triggering source (real
or imaginary part, x or y) shows signals with initial upward (+) or downward (-)
deflections. Use the triggering direction parameter to specify, which behavior the
algorithm should seek. For most applications with low triggering frequencies (e.g. 2
MHz), positive (+) is the appropriate triggering direction.
Note Please do not adjust the triggering direction without knowledge of the signal
properties.
Selecting triggering source and
direction The strongest absolute initial
deflection is from the x component
The AmphaSoft 2 triggering algorithm
and in positive direction
uses either x or y signal components to →
trigger cellular signals. It is therefore real part (x)
positive
crucial to properly configure the algorithm
imaginary part (y)
by selecting the triggering source and
Amplitude (V)
triggering direction. The oscilloscope view
allows displaying impedance signals.
← negative
Based on pulse pairs, the triggering
source and direction can be determined
as shown in the figure to the right. The The y component deflection is
component with the strongest absolute much smaller than the x-
deflection.
deflection is used as the triggering source.
Depending on whether the initial deflection
is in positive or negative direction, the
Length (ms)
triggering direction is set.
Trig Frame The triggering frame is a parameter that influences the triggering
algorithm. If a signal is longer than the triggering frame (in milliseconds), it will be
rejected. The length of a signal with respect to time is influenced by the particle’s
velocity. The particle velocity depends on the pump speed, the pump phase
(peristalsis) and the vertical and horizontal position in the chip. Please do not adjust
the triggering frame.
Trig Hyst The triggering hysteresis is a parameter to fine-tune the triggering
algorithm. Please do not adjust the triggering hysteresis.
Resuspension This feature applies to autosampler operation only. Resuspension
is a process, in which the autosampler needle releases air bubbles and performs a
linear bidirectional movement in order to suspend particles that settled to the bottom
of a well. The resuspension time can be adjusted between 0 and 60 seconds.
Amphasys, Technopark Lucerne, CH-6039 Root D4, Switzerland | Phone +41 41 541 91 20 | www.amphasys.com
16 / 56AmphaSoft 2.0 User Guide
Flush A Flush is a short rinsing cycle of the fluidic system using deionized water
from the water bottle. A flush starts immediately after stopping the measurement. If
you do not want to flush after the measurement, enter 0 (zero) in the flush field.
Note Flushing is a cleaning procedure that prevents cross-contamination between
samples. Without a flush, there will be particles from the last measurement in the
tubing and even after loading the next sample, there may be some residual cells that
will be measured with the new measurement. If you decide not to flush, please take
such carryover into consideration. For autosampler operation, not flushing does not
have adverse effects on carryover.
Note or non-autosampler operation: As the flush starts immediately after the
measurement, your sample will be diluted with deionized water unless you quickly
remove the sample and place a liquid container below the sample aspiration tube.
Dilution with deionized water changes the conductivity of the liquid and the
concentration of cells.
Note The Note field can be used for remarks.
Done The Done field is an indicator, if the measurement was already performed.
You can’t change the entry in the Done field.
Report In the Report field, you can select if a particular measurement should be
included in the measurement report. You can include measurements by entering 1
(default) or exclude by entering 0 (zero).
Import of sample names and notes
The Import function offers the possibility to import sample names and notes into the worklist.
The requirements for using the feature are
Sample names and notes are saved in *.csv format using a particular separator
(comma, @ and semicolon are allowed). Having notes is optional.
A blank workspace or a template with only one measurement
Click on Import and select the *.csv file containing sample names and notes. The worklist will
automatically be extended with the required number of measurements and the corresponding
names and notes.
2.5.3 The Basic tab
The Basic tab can be accessed by clicking on Instrument Control in the Navigation panel and
then selecting the Basic tab. The Basic tab is used to perform the initial rinsing and any other
rinsing, cleaning and disinfection cycles. In addition, the Basic tab shows real time flow rate
information (in µl/min).
Rinsing
Place a measurement or cleaning chip in the instrument and make sure this chip type is
selected in the chip section of the Measurement tab. In the Basic tab, click Start Rinsing and
follow the instructions.
Amphasys, Technopark Lucerne, CH-6039 Root D4, Switzerland | Phone +41 41 541 91 20 | www.amphasys.com
17 / 56AmphaSoft 2.0 User Guide
Flow rate
Selection of
Undocking/Docking maintenance
protocols
Protocol start
Cleaning
Place a measurement or cleaning chip in the instrument and make sure this chip type is
selected in the chip section of the Measurement tab. In the Basic tab, select Cleaning, press
Start Rinsing and follow the instructions.
Disinfection
Place a cleaning chip in the instrument and make sure this chip type is selected in the chip
section of the Measurement tab. In the Basic tab, select Disinfection, press Start Rinsing and
follow the instructions. Only use cleaning chips for the disinfection cycle!
Undocking
You can undock the basic tab and adjust its size and position. Once you placed the
undocked tab at your preferred location, go to the main menu and click Window > Layout >
Save. This will save the current layout of windows and tabs. Once you open AmphaSoft 2.0
again, retrieve this layout by clicking
Window > Layout > Load.
It is helpful to undock the Basic tab and
minimize it (picture). In the minimized
form, it can always be accessed directly
from all other tabs.
If you work with two monitors and decide to use only one (or an external monitor in another
position), please save a layout with all windows on your main monitor before changing.
2.5.4 The Advanced tab
The Advanced tab can be accessed by clicking on Instrument Control in the Navigation
panel. It is a tab intended to perform special tasks, such as optimization of triggering settings,
Amphasys, Technopark Lucerne, CH-6039 Root D4, Switzerland | Phone +41 41 541 91 20 | www.amphasys.com
18 / 56AmphaSoft 2.0 User Guide
viewing signals from cells, manual control of fluidic processes and manual switching of the
valves.
Frame
Level Baseline
Minimization Signal
of content display
Maximization
of content
Log window
Save Log Files
Undocking
Amplitude-time plot for signal display
The top section of the Advanced tab is dominated by a large plot, called the Frame. The y-
axis corresponds to the signal amplitude (in volts, V) and the x-axis to signal length (time in
milliseconds, ms). Note that signals are only displayed when the oscilloscope or triggering
Pulse pair
Imaginary
part (Y) Level Baseline
Real
part (X)
Save Log file
view are activated (see next sections). The signals displayed in the plot are the following:
Blue line The blue line corresponds to the real part of the complex impedance
signal (the X component). At zero amplitude is the baseline, signal and pulse pairs
deviating from that baseline occur as a result of the passage of cells or any particle
that impedes current flow.
Green line The green line corresponds to the imaginary part of the impedance (the
Y component). A green pulse pair indicates the passage of particles through the chip.
Red dotted line The red dotted horizontal lines correspond to the level and
represent a threshold, which a signal must cross in order to be recognized as a true
particle signal (and not noise or debris).
Amphasys, Technopark Lucerne, CH-6039 Root D4, Switzerland | Phone +41 41 541 91 20 | www.amphasys.com
19 / 56AmphaSoft 2.0 User Guide
Red triangles When the triggering view is activated, examples of triggered pulse
pairs are displayed for a short time in the plot. The triggered signal is displayed at
time t = 0 and red triangles indicate where the triggering algorithm has determined the
signal peak positions. Any other signal in that frame (the plot you see) will not have
triangles, even though they may have been triggered.
Frame section: Plot options
The Frame section of the Advanced tab is used to change the axes of the frame (the plot in
the top section). Using the fields Length and Amplitude, you can change x and y axes of the
frame. Using the check boxes below, you can selectively display real part (x), imaginary part
(y) and triggered signals (red triangles).
Gain section: Change the signal amplitude
The Gain section displays the three gain components: Modulation, Amplification and
Demodulation. These parameters can be adjusted using the slider or the entry fields. More
detailed information about the gain settings is in section 2.5.2 The Worklist.
Triggering section: Modify the triggering algorithm
In the Triggering section, you set the parameters based on which the
triggering algorithm will determine if a pulse pair is a true event or just
noise or debris. More detailed information about the gain settings is in
2.5.2 The Worklist.
Pump section: Manually activate the pump
The Pump section is used to manually activate the pump. The
peristaltic pump can be operated at different pump speeds, and in
different pumping directions. The default pump speed is counter-
clockwise (when viewed from top). You can turn on the pump by
clicking the check box. The pump speed can be entered into the
Speed box (in revolutions per minute, rpm). The pump direction can
be selected from the dropdown under Direction.
Valves section: Manually activate valves
The Ampha Z32 front is equipped with two solenoid pinch valves that
alternatively pinch one of the two silicone tubings inserted. Using the
checkboxes, you can manually switch the valves. The default position
is both unchecked. This pinches the two tubing branches from the water bottle and allows the
transport of sample from the sample tubing to the chip. Details of the rinsing protocols are
explained in the Ampha Z32 manual.
Process section: Change measurement-associated processes
The Process section contains 5 checkboxes. By default, all of them
are checked.
Unchecking the Initial Rinsing checkbox makes the initial
Amphasys, Technopark Lucerne, CH-6039 Root D4, Switzerland | Phone +41 41 541 91 20 | www.amphasys.com
20 / 56AmphaSoft 2.0 User Guide
rinsing not mandatory anymore. Don’t use this option with routine analysis.
Unchecking Chip Detection inactivates the chip recognition mechanisms of the
Ampha Z32. This holds true for all subsequent measurements.
Unchecking Load Sample prevents sample loading. In that case, the measurement
will begin immediately after clicking Start Measurement.
Unchecking Flush prevents flushing after that particular measurement.
Unchecking AutoZoom will prevent automatic setting of axis limits during
measurement.
Note Changing the settings in the Process section is generally not recommended by
Amphasys. Appropriate rinsing and flushing cycles are required to maintain a clean fluidic
system and to prevent cross-contamination. The chip detection is an important security
measure to prevent liquid spills into the instrument when no chip is present. Finally, the
loading process is transporting the sample to the chip and therefore an important part of the
measurement.
Pulse section: Creating artificial pulses for advanced testing
The Pulse section is used for advanced system testing. In brief, the system
creates an electric pulse and this pulse can provide information about the
Ampha Z32 electronics. Please do not use the Pulse section.
Oscilloscope view: Real time impedance signals
The oscilloscope is a special feature of the Advanced tab. It can be activated
on the right hand side of the Advanced tab by selecting Oscilloscope and then
clicking Start. When activated, real-time impedance data is shown in the
Amplitude-Length plot. As the plot is refreshing after short time intervals, you
can get an idea about your signals and noise levels.
Note The oscilloscope view is very useful for the selection of the triggering source and
triggering direction when measuring with non-default settings. Please make sure that you
stop the oscilloscope view before leaving the Advanced tab or changing to another view.
Triggering view: Real time triggered signals
Besides the oscilloscope view, where snapshot segments of the data are shown in real-time,
the triggering view has a stronger focus on triggered events. When activated, the triggering
view selects triggered signals and displays them in the Amplitude-Length plot. As the plot is
refreshing after short time intervals, you get an idea about your signal quality (signal-to-
noise), signal lengths (transition times) and your level setting.
Note The triggering view is very useful for the adjustment of level settings and for the
identification of contacting problems with the chip (asymmetric signals). Please make sure
that you stop the triggering view before leaving the Advanced tab. Do not activate the
triggering view during a measurement.
Autogain: Finding maximum gain parameters
The autogain is a special feature for the optimization of the gain settings. When started, an
algorithm will search for the maximum gain settings. You can manually pump a sample
Amphasys, Technopark Lucerne, CH-6039 Root D4, Switzerland | Phone +41 41 541 91 20 | www.amphasys.com
21 / 56AmphaSoft 2.0 User Guide
through the system and then use Autogain to find the highest possible gain settings for that
sample type, but the default settings or recommended settings from the pollen list fit mostly
for an optimal measurement.
Log window and Log file retrieval
In the bottom section of the Advanced
tab is the Log window. The log window
displays the latest instrument actions
and error messages. When setting up
measurements with new settings or if
you face any problems with measurements, the Log window may provide valuable
information. In case you have a software or measurement issue to discuss with Amphasys
support, a Log-file can be saved. Please use the Logs button in the bottom right section of
the Advanced tab.
Resetting parameters
You can always come back to default settings of the Advanced tab by clicking on the
Defaults button in the lower right corner. Note that this action resets the measurement
parameters of the currently selected measurement.
Undocking the Advanced tab
The Advanced tab can be undocked, changed in size and repositioned, similar to the Basic
tab. For undocking, click on the Undock button in the lower right corner. This feature is very
useful if more than one screen is available. You can save your preferred configuration by
selecting Window > Layout > Save in the main menu. After reopening AmphaSoft 2.0, you
can always retrieve your layout by clicking Window > Layout > Load. If you used an external
monitor and intend not to use it anymore, please save the tab configuration for single-screen
use first before disconnecting the external screen.
Minimizing and maximizing Advanced tab contents
The Advanced tab contains two buttons to minimize and maximize contents. The [-]-button at
the lower left corner of the plot collapses the entire settings and log sections and provides a
full view of the plot. You can return to the default view by clicking on the [+]-button.
The [+]-button on the left hand side above the log window leads to an expansion of the log
window and the collapse of all the settings. You can return to the default view by clicking on
the [-]-button.
2.5.5 The Admin tab
The Admin tab is used for tubing set selection, manual connection and disconnection to the
instrument, license activation and instrument software and firmware updates.
Amphasys, Technopark Lucerne, CH-6039 Root D4, Switzerland | Phone +41 41 541 91 20 | www.amphasys.com
22 / 56AmphaSoft 2.0 User Guide
Tubing set
selection
Upload, activate
and deactivate
licenses Update
instrument
software and
firmware
Manually
connect /
disconnect
Tubing
Depending on the application, 3 different tubing sets are available. A small tubing set (S) is
typically used in combination with A-chips, a medium tubing set (M) with B- and C-chips and
a large tubing set (L) with F-, D- and E-chips. By default, the large tubing set is selected. If
you are using A-, B- or C-chips, you have to adjust the tubing set by selecting it from the list
in the Tubing section of the Admin tab.
Connection
The Connection section contains settings for the communication between your PC and the
instrument. The status field tells you if you are working online (i.e. an active connection
between PC and instrument) or offline. You can manually connect or disconnect by clicking
the Connect or Disconnect button (only one is available).
In the connection section, the autosampler can be activated. You can find more information
in the Ampha Z32 user guide.
Note Please do not change any numbers in the Connections section of the Admin tab.
Normally, there is no need to actively connect or disconnect. AmphaSoft 2.0 will
automatically try to establish a connection when you perform an operation involving the
instrument (i.e. the initial rinsing). AmphaSoft 2.0 will also automatically stop the connection
when you exit the software.
License
The License section of the Admin tab gives you the possibility to upload, activate or
deactivate licenses. More information about licensing is available in chapter 9 Licensing.
Version
Amphasys, Technopark Lucerne, CH-6039 Root D4, Switzerland | Phone +41 41 541 91 20 | www.amphasys.com
23 / 56AmphaSoft 2.0 User Guide
The Version section of the Admin tab provides information about the configuration of your
system and allows you to perform instrument software and firmware updates. Details are
provided in chapter 8.4 Instrument Software and Firmware Update.
2.6 Data Saving
AmphaSoft 2.0 features autosave functionality. It will automatically save the entire workspace
after stopping a measurement and after leaving the worklist. However, until the user explicitly
saves his work, all files will be stored in a temporary folder. Therefore, only manually saving
your work will create a measurement folder. In order to manually save, go to the main menu
and select Workspace > Save. Alternatively, you can also use the save icon below the main
menu. It is good practice to save a workspace before performing the first measurement.
When saving, you will be asked to create a folder. Navigate to your preferred location (use a
local but no network drive) and right-click to create a folder (right-click > New > Folder).
Name the folder and then click Select Folder two times. Now you are ready for the
measurement.
2.7 File Structure
AmphaSoft 2.0 creates a folder for each workspace. The name of the folder can be defined
by the user when saving the workspace for the first time (see Section 2.6 Data Saving).
Inside the folder, 3 files are created for each sample: *.amph, *.cels and *.meas (the “*”
stands for the sample number). These files contain measurement settings and data. In
addition, one wsp.amph file is created for the entire workspace.
By default, reports and data exports are also saved in this measurement folder. In case of
the .html report, an additional subfolder containing the images will be created. When viewing
the .html report, this subfolder with the images should be saved in the same main folder as
the .html report.
Amphasys, Technopark Lucerne, CH-6039 Root D4, Switzerland | Phone +41 41 541 91 20 | www.amphasys.com
24 / 56You can also read