A DMAIC BASED FRAMEWORK TO CONDUCT MEASUREMENT SYSTEM ANALYSIS - DIVA
←
→
Page content transcription
If your browser does not render page correctly, please read the page content below

DEGREE PROJECT IN MECHANICAL ENGINEERING,
SECOND CYCLE, 30 CREDITS
STOCKHOLM, SWEDEN 2021

A DMAIC based framework
to conduct
Measurement System Analysis
A case study at Northvolt AB

ANSHUMAN MANICKAM VINOTH

KTH ROYAL INSTITUTE OF TECHNOLOGY
SCHOOL OF INDUSTRIAL ENGINEERING AND MANAGEMENT
Degree Project in Production Engineering and
                 Management, Second Level, 30 credits

A DMAIC based framework to conduct Measurement System
         Analysis: A case study at Northvolt AB

                                Done by:

                ANSHUMAN MANICKAM VINOTH

                             Supervisors:

  Dr. Sayyed Shoaib-ul-Hasan, KTH Royal Institute Of Technology

               Jorge Garrido Galvez, Northvolt AB
                                      1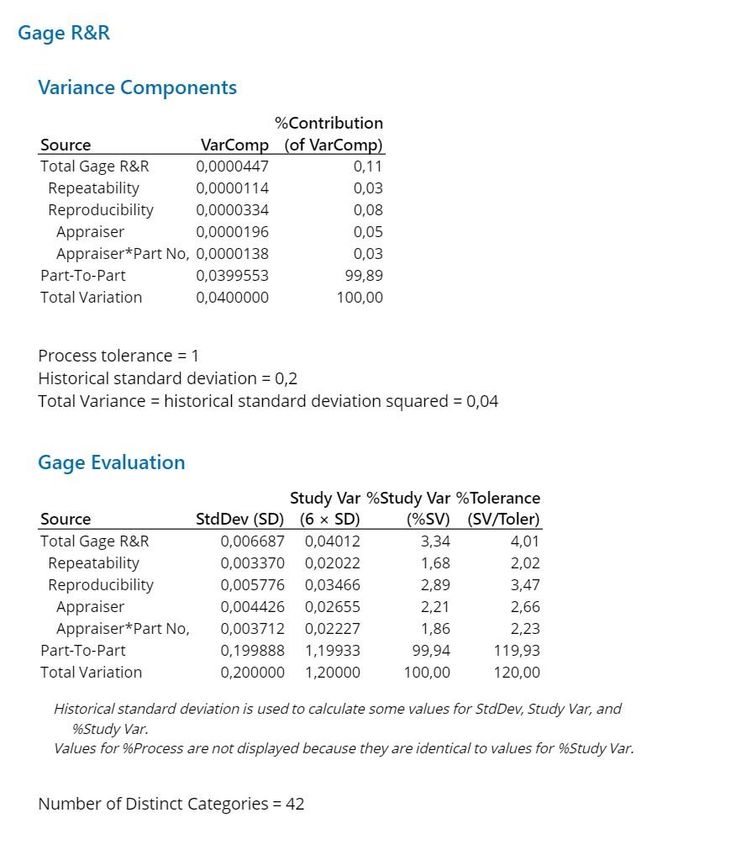
Acknowledgements
Firstly, I would like to thank my supervisor at KTH, Dr. Sayyed Shoaib-ul-Hasan, who
was extremely supportive during the challenging thesis. His availability for feedback and
valuable reviews helped the completion of this thesis project. I would also like to thank
Ove Bayard who was very understanding and supportive during a challenging period of
the thesis and helped me finish the thesis in a good way.

I am also grateful to Northvolt AB for giving me the opportunity to carry out this thesis in
the company and trusting me with the responsibility of creating a framework that would
be used in daily operations. My supervisor at Northvolt AB, Jorge Garrido Galvez,
provided me with the technical and statistical background to understand the need for
this thesis. My work was always reviewed extensively and I was provided all the support
from him.

Also, thanks to all the supporting employees at Northvolt for helping me in this journey
and my family and friends for being by my side and motivating me to produce a good
thesis.

                                                    2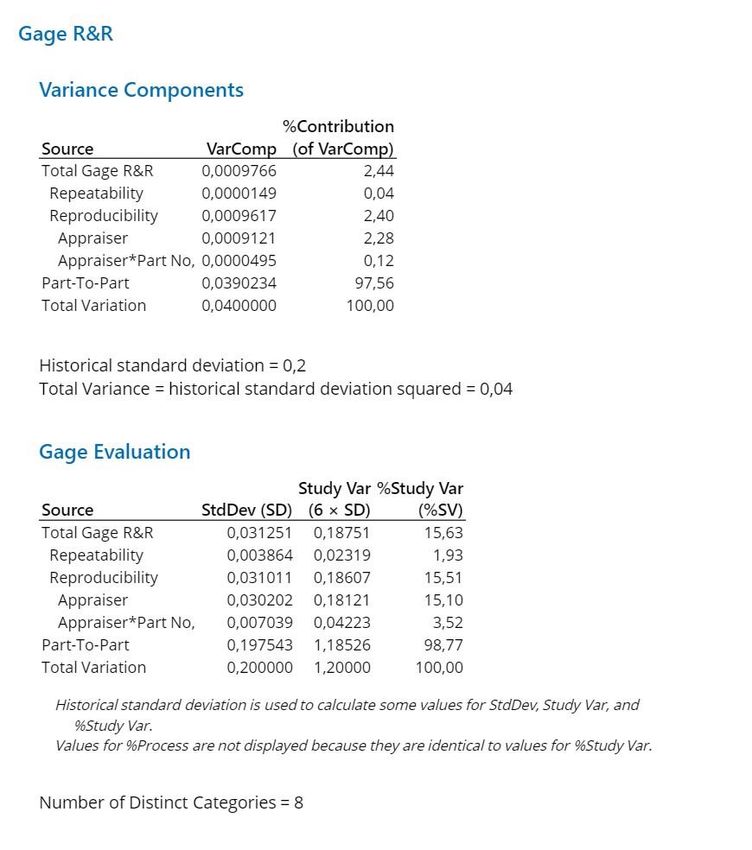
Sammanfattning
Syftet med projektet var att utveckla en ram för genomförandet av en MSA (Measuring
System Analysis) som skulle hjälpa till att avgöra ett mätsystems kapacitet.
Strategin bakom genomförandet av denna avhandling har varit att utarbeta en ram som
bygger på Define, Measure, Analyze, Improve, Control (DMAIC) -modellen för en
Measuring System Analysis (MSA) som skulle möjliggöra en bättre förståelse av
förmågan av mätinstrument som används för att kontrollera kvaliteten på
produktionsprocesser för litiumjonbatterier.
Ramverket hjälper användare att utföra kontrollerade experiment som hjälper till att
bestämma parametrar som bias, linjäritet, stabilitet och robusthet för
noggrannhetsbestämning och repeterbarhet och reproducerbarhet för att hjälpa till att
bestämma precision.
För att sätta ramarna i praktiken genomfördes en fallstudie på bildmätningssystemet i
laboratoriet för kvalitetskontroll. När mätsystemets förmåga har förståts accepteras eller
avvisas det baserat på acceptanskriterierna som definieras i denna avhandling. I denna
fallstudie var det nuvarande tillståndet för mätsystemet inte acceptabelt för att styra
produktionsprocessen eftersom det var stor variation i mätresultaten. Detta löstes
genom implementeringen av ett automatiskt mätprogram som minskade
mätvariabiliteten.
Den sista fasen av ramverket är ansvarig för att säkerställa att förbättringarna av
systemet kontrolleras under lång tid. Därför används kontrollscheman för att
kontinuerligt spåra mätsystemets prestanda och informera användare om trender och
outliers.

                                                   3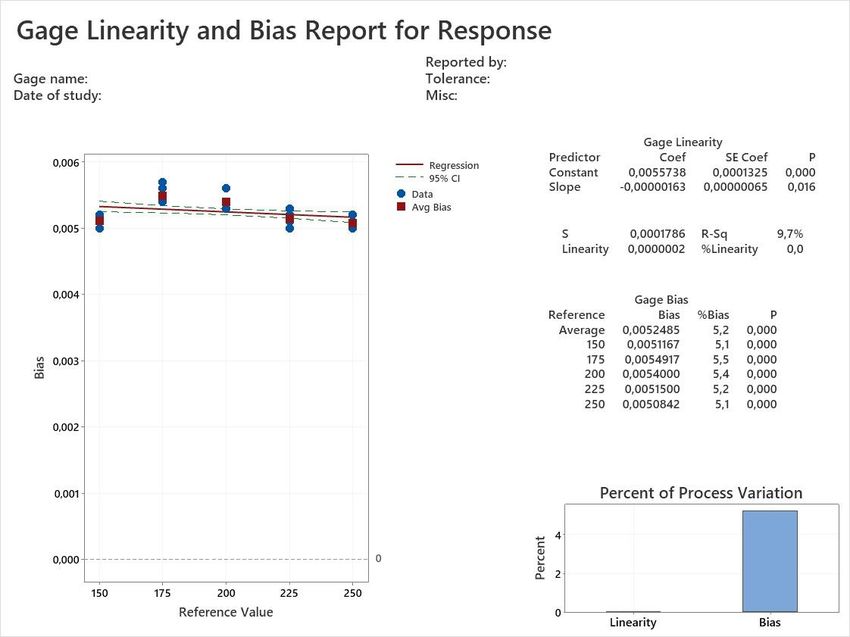
Abstract
The aim of the project was to develop a framework for the execution of a Measurement
System Analysis (MSA) which would help determine capability of a measurement
system.

The strategy behind carrying out this thesis has been to draft a framework which is
based on the Define, Measure, Analyze, Improve, Control (DMAIC) model for a
Measurement System Analysis (MSA) which would enable to gain a better
understanding of the capability of measurement instruments that are used to control the
quality of production processes of lithium-ion batteries.

The framework helps users carry out controlled experiments that help determine
parameters such as bias, linearity, stability, and robustness for the accuracy
determination and repeatability and reproducibility to help determine precision.

To put the framework in practice, a case study was undertaken on the image
measurement system in the quality control laboratory. Once the capability of the
measurement system is understood, it is accepted or rejected based on the acceptance
criteria defined in this thesis. In this case study, the current state of the measurement
system was not acceptable to control the production process as there was high
variability in the measurement results. This was overcome with the implementation of an
automated measurement program that reduced measurement variability.

The final phase of the framework is responsible for ensuring that the improvements
made to the system are controlled over a long period of time. Therefore, control charts
are used to continuously track the measurement system performance and notify users
about trends and outliers.

                                                  4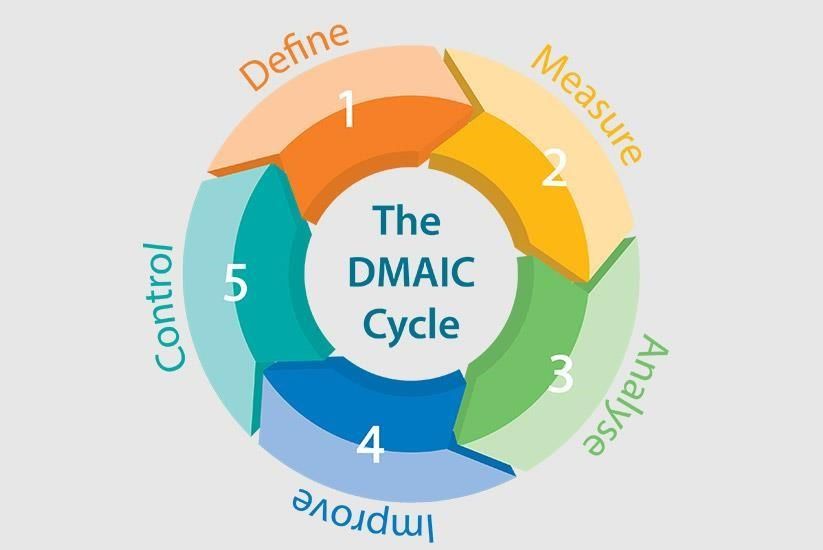
Table of Contents
Acknowledgements……………………………………………………………………………….2
Sammanfattning………………………………………………………………………………….. 3
Abstract……………………………………………………………………………………………..4
List of abbreviations……………………………………………………………………………….10
  1Chapter 1: Introduction………………………………………………………………..……11
  1.1 Background……………………………………………………………………………….11
  1.2 Problem statement and purpose………………………………….…………………….12
  1.3 Delimitations……………………………………………………………………………...13
  2 Chapter 2: Theoretical Background and Key Concepts………………………………..14
  2.1 Overall System Variation………………………………………………………………..14
  2.2 Measurement variation and its components…………………………………………..15
  2.2.1 Accuracy……………………………………………………………………….………..16
  2.2.2 Precision……………………………………………………………………...…………17
  2.3 Measurement System Analysis…………………………………………………………18
  3Chapter 3: Methodology……………………………………………………………………21
  4Chapter 4: Proposed framework to conduct MSA……………………………………...22
  4.1 DMAIC Improvement Cycle……………………………………………………………..22
  4.1.1 Define……………………………………………………………………………………22
  4.1.2 Measure…………………………………………………………………………………23
  4.1.3 Analyse………………………………………………………………………………….23
  4.1.4 Improve………………………………………………………………………………….23
  4.1.5 Control…………………………………………………………………………………..23
  4.2   DMAIC based MSA framework………………………………………………………24
  5Chapter 5: Case Study…………………………………….……………………………….35
  5.1 Step 1 - Preparation for study…………………………………………………………..35
  5.2 Step 2 - Measurement plan……………………………………………………………..36
  5.3 Step 3 - Measurement execution……………………………………………………….36
  5.4 Step 4 - Result analysis and interpretation…………………………………………….36
  5.5 Step 5- Improvement phase……………………………………………………………..44
  5.6 Step 6- Control phase…………………………………………………………………….47
  6Chapter 6: Discussion……………………………….………………………………………48
  6.1 Reflections……………………………………….…………………………………………48

                                     5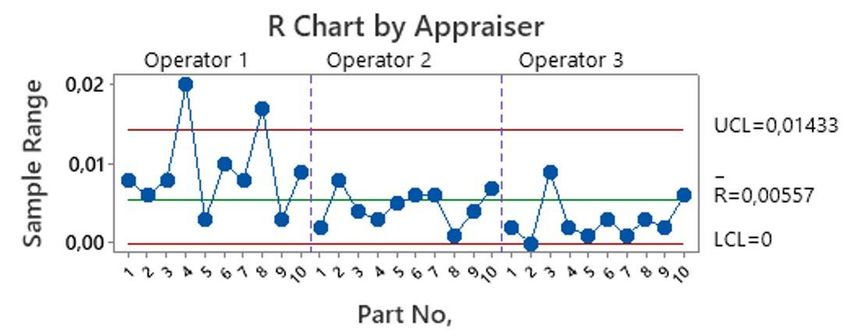
6.2 Validity of study…………………………………………………………………………….49
6.3 Future scope………………………………………………………………………………..49
7Chapter 7: Conclusions………………………………………………………………………51
References………………..……………………………………………………………………52

                           6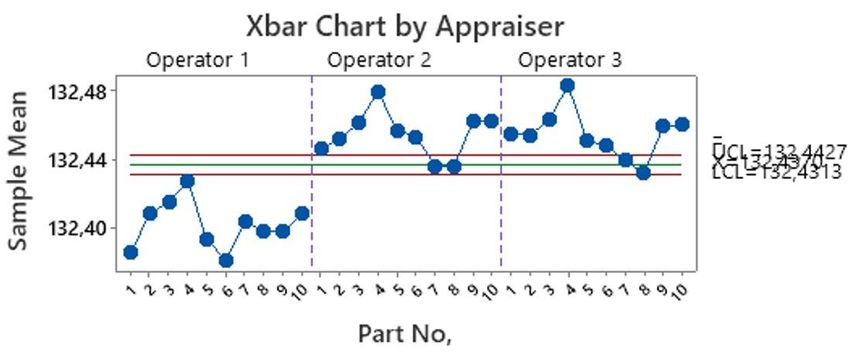
List of Figures
Figure 1. Northvolt Li-ion cells ...................................................................................................13

Figure 2. Sources of variation ...................................................................................................15

Figure 3. Accuracy vs Precision ................................................................................................16

Figure 4. Stability ......................................................................................................................17

Figure 5. Linearity .....................................................................................................................17

Figure 6. Repeatability ..............................................................................................................18

Figure 7. Reproducibility ...........................................................................................................18

Figure 8. DMAIC cycle ..............................................................................................................19

Figure 9. Development of framework ........................................................................................22

Figure 10. Bell curve .................................................................................................................35

Figure 11. Keyence IM series measurement system .................................................................39

Figure 12. Gage Bias ................................................................................................................40

Figure 13. Gage Linearity and Bias ...........................................................................................41

Figure 14. 3 day Stability...........................................................................................................42

Figure 15. Two-Way ANOVA - current state..............................................................................43

Figure 16. Gage R&R - current state .........................................................................................44

Figure 17. Components of variation - current state ....................................................................45

Figure 18. R chart by appraiser - current state ..........................................................................45

Figure 19. Xbar chart by appraiser ............................................................................................46

Figure 20. Length by part number - current state ......................................................................46

Figure 21. Length by appraiser - current state ...........................................................................47

Figure 22. Part and appraiser interaction - current state............................................................47

Figure 23. Lighting settings .......................................................................................................48

Figure 24. Two-Way ANOVA - improved state ..........................................................................49

                                                                               7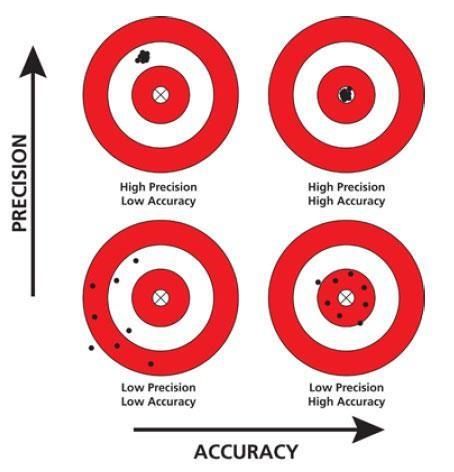
Figure 25. Gage R&R - improved state .....................................................................................50

Figure 26. Gage R&R graphs - improved state..........................................................................51

                                                                      8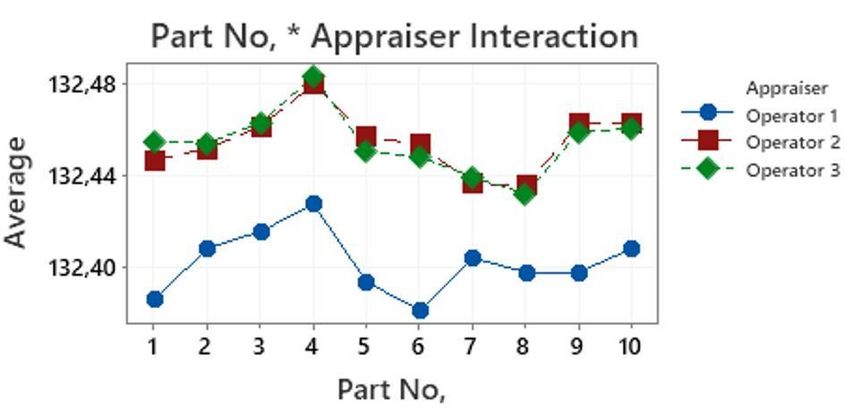
List of Tables
Table 1. Gage R&R acceptability criteria ...................................................................................24

Table 2. Stability analysis ..........................................................................................................27

                                                                             9
List of abbreviations
MSA Measurement System Analysis
QC Quality Control
DMAIC Define, Measure, Analyse, Improve, Control
IMS Image Measurement System
MS Measurement System
R&R Repeatability & Reproducibility
SPC Statistical Process Control
NDC Number of Distinct Categories
101 Chapter 1: Introduction
This chapter presents the background and problem statement along with the need to
carry out this master thesis. It also provides the objectives that the thesis looks to satisfy
along with delimitations of the research.
1.1 Background
Variability in a production process can cause major problems to product quality and a
reduction of this variability can provide a lot of benefits with respect to money and time
[1]. Money and time are factors that play a crucial role in helping companies differentiate
themselves in the market [2]. Also, customer expectations need to be met by the
company and this relies on the quality of production processes [2].
Six Sigma has a wide range of statistical tools and practices that help with
measurement and control of the process variation which allows the improvement of
process performance [3]. There are numerous examples of companies such as 3M and
Xerox that have implemented Six Sigma and made huge savings in their operations [2,
3]. It is evident from these examples that by implementing different Six Sigma practices
such as cause and effect analysis, pareto charts, root cause analysis and continuous
improvement organizations can improve their processes and sustain operational
excellence.
The performance of processes can only be improved when we first understand the
measurement systems that are used to control the processes [4]. A measurement
system is defined as a system which is used to characterize a particular characteristic of
a part. It is essential to have trust in the measurement system that will be used to make
decisions on process improvement and control the process [5]. To determine the current
state and build trust in the measurement system, an analysis tool called Measurement
System Analysis (MSA) is used. It is a statistical method of judging the error due to
measurement which in turn helps determine the overall process error.
The battery manufacturing industry is especially in need of reliable measurement
systems as the industry is dependent on high quality production of batteries to satisfy
performance and safety requirements. The margins for safety are particularly small and
this would require processes that are extremely stable. The production of batteries
begins in the upstream process which is where the active material used in the
electrodes is produced. Any quality defects in this stage due to unstable process can
lead to defects that are passed into the downstream process undetected and this can
have significant effect on the final cell.
Northvolt AB is a Swedish startup company that aims to produce a green battery that
can be used in multiple industries such as automotive, grid storage, micro-mobility and
industrial applications. The differentiating factor here is that Northvolt plans to vertically
11integrate the production process of Li-ion batteries and close the circular economical
loop with battery recycling, which is ahead of the industry.
The core mission of Northvolt is to be a sustainable company in every way possible.
The thesis was performed in a pilot facility called Northvolt Labs.
1.2 Problem statement and purpose
Generally, in manufacturing companies the data collected from day-to-day operations is
used to make important decisions with respect to different processes [6]. Dimensions
which are critical to manufacturing are measured to ensure if the parts are produced
according to specification or not. When it comes to the data being collected at work,
there is always the question of whether the data is reliable or not if there is consistency
in measurement of the data or not. It would be ideal to obtain the same measurement
result if more than one person or equipment is used for the same part, but this is very
difficult to achieve due to many factors. To ascertain if the measurement system
produces unreliable data, it is good practice to perform a Measurement System Analysis
(MSA) and quantify the measurement error. An undetected error in the measurement
system will lead to wrong assumptions that the process is capable or in control. It is also
possible that the system can make us believe that there is a problem with the process
when in reality it is under control. This in turn leads to a business losing money due to
needless scrap or rework, complaints from customers or even safety incidents.
High quality must be maintained in every process step especially the start of the
process lineup in order to avoid buildup of quality issues further downstream in the
production line [7]. Any fluctuation in the measurement system will lead to quality
problems that will not be judged accurately and reliably and fail to understand where the
problem is coming from in the process. In a high paced production scenario where
decisions need to be made with a data driven approach, it is essential to have a
measurement system that generates high quality data. At Northvolt, there is an ongoing
ramp up of the production and as processes need to improve to increase overall
capacity, the need for a MSA was highlighted as an important requirement for the
Quality Control Laboratory. Also, the production machines use various integrated
measurement systems such as Charge Coupled Device (CCD) cameras that require a
reliable measurement system to calibrate them.
In addition, a MSA which is used to track capability of the various measurement
systems is a requirement to allow the organization to be certificated for ISO 9000:2015.
It is also prioritized as a customer requirement of Northvolt AB. Thus, the purpose of
this thesis work was to create a framework for MSA according to the DMAIC framework
which is an abbreviation for Define, Measure, Analyze, Improve and Control. DMAIC
was chosen as basis for framework as it is an important data driven strategy that is
used to improve processes and drive Six Sigma projects [8]. This framework would be
intended for use for all the measurement systems in the Northvolt Quality Control
laboratory.
12The following objectives were defined for this project:
1. Develop framework for the execution of a Measurement System Analysis (MSA)
including gaps present in established studies.
2. Determine current measurement system capability.
3. Improve measurement system to meet acceptability criteria and control
improvement.
Figure 1. Northvolt Li-ion cells
1.3 Delimitations
The project looks at carrying out the MSA for the measurement systems used in the
Northvolt Quality Control Laboratory. The instrument chosen is a 2D image
measurement system which is used to determine electrode dimensions in the
production. This instrument was chosen as the data obtained from it would be used for
determining the quality of critical product dimensions. There are many different
measurement systems that are used in the QC lab that can be analyzed in future
studies.
132 Chapter 2: Theoretical Background and Key Concepts
This chapter provides an overview of the important topics used throughout the thesis with
well-known literature from research articles, textbooks and websites. The established literature
was used as the basis to make recommendations for the framework.
2.1 Overall System Variation
A measurement system is influenced by two types of sources of variation namely
random and systematic variation [6]. These variations are detected both directly and
indirectly. There are five main contributors to variation observed in a measurement
system and these are environment, person, instrument, work piece and standard [6].
The environment in which a measurement system is operated in is of importance as
environmental influences such as vibration, temperature, air drafts and particle
contamination can influence the measurement analysis. The person or appraiser
performing the measurement analysis can often be the major contributor to variations
seen in a measurement system as different persons can perform the same
measurement in slightly different ways. The instrument itself has inherent variations
present due to design, the build and maintenance protocols. A workpiece can introduce
variations in a system due to elastic deformation that would cause the sample to be
aligned in different ways and the cleanliness of the workpiece can also affect the
measurement results. A standard must have geometrical compatibility with the
measurement system and must be stable during measurement operations. Most
importantly, it must be a traceable standard that can be verified [6].
Variation caused by the instrument can arise due to the inherent design of the
instrument and the maintenance carried out on the instrument throughout its operational
life. These factors have an impact on the accuracy of the instrument [9]. Variation
brought about by operators can arise due to training provided, attitude or educational
qualification [6]. The MSA study incorporates multiple operators who use the same
instrument and samples but there is a difference in results reported among the
operators and this I brought about by unique differences among them [10]. There are
also variations brought about by the environment such as variation of surrounding
temperature, humidity, and contamination [6].
Whenever a measurement is carried out, the total variation or observed variation can be
divided into two components - true variation and the measurement variation. True
variation is the actual variation brought about by the process and this causes inherent
variability among the samples that are measured by a measurement system. On the
other hand, measurement variation is the variability introduced by environment, person,
instrument, work piece and standard. These components of observed variation are
clearly depicted in Figure 2. This thesis focuses only on the measurement variation.
14Figure 2. Sources of variation
2.2 Measurement variation and its components
Every measurement system possesses a natural measurement error when they are
used to carry out a measurement on a part or sample [11] [12]. This inherent error can
be expressed into two components namely accuracy and precision. Accuracy has three
main components which are stability, bias and linearity. Precision has two main
components and they are repeatability and reproducibility. It is commonly seen that
precision and repeatability are used interchangeably but this is not true as defined by
ASTM which says that precision includes not just repeatability but also reproducibility
which looks at variation brought about by various people, instruments, and conditions
among many others [6]. As depicted in Figure 3, a good measurement system has both
good accuracy and good precision.
15Figure 3. Accuracy vs Precision
2.2.1 Accuracy
The accuracy of an analytical procedure expresses qualitatively the agreement between
the value which is accepted either as a conventional true value or an accepted
reference value and the value measured on the instrument. Accuracy has three
subcomponents here which are bias, linearity and stability.
2.2.1.1 Bias
Bias can be defined as the numeric difference between a certified true value and the
average of given measurements. It is the measure of systematic error of the
measurement system. A good measurement system produces results whose average is
close to the reference value.
2.2.1.2 Stability
Stability (or drift) is total variation in measurements on the same master sample when
measuring a single characteristic over a long period. This is also considered as the
change in bias over time. A good measurement system has constant bias over a period
of time.
16Figure 4. Stability
2.2.1.3 Linearity
Linearity is defined as the bias for different points along the range of operation of an
instrument. It can be described as a change of bias with respect to size. It is important
to observe the impact of different sample types on the bias of a measurement system.
This analysis helps determine if the bias increase/decrease is linear or not.
Figure 5. Linearity
2.2.2 Precision
Precision is the agreement between a set of replicate measurements without
assumption or knowledge of the true value. Precision is usually expressed by the
relative standard deviation and also the coefficient of variation.
2.2.2.1 Repeatability
Definition: It is the variation in measurements obtained with one instrument used several
times by one operator while measuring the same characteristic on the same part. It
helps us understand the inherent variation of the equipment.
17Figure 6. Repeatability
2.2.2.2 Reproducibility
Reproducibility is the variation of the average of measurements made by different
operators using the same instrument while measuring the same characteristic on the
same kind of part. Here the main variability that is determined is the instrument to
operator variability.
Figure 7. Reproducibility
2.3 Measurement System Analysis
A measurement system analysis helps determine the capability of a measurement
system as a capable measurement system is essential for quality and process
improvement efforts. As described in previous sections and figure 2., the overall
process variation is a combination of the observed process variation and the
measurement variation. It is established in literature that the variance of overall variation
is equal to the sum of variance of the process itself and the variance of the
measurement system. A large variation in the measurement system will in turn depict
an even larger overall process variation and this depiction would cause wrong
conclusions to be made about the process itself. There have been multiple studies and
18established literature on measurement system analysis. A measurement system
analysis has 3 main purposes [6]:
1) Determining influence of measurement system error on total observed error
2) Isolating sources of variation in the system
3) Assessing capability of gauge to meet needs of production
A typical measurement system analysis carries out replicated measurements in a
controlled study and looks at the precision components such as repeatability and
reproducibility of the system. This type of controlled experiment distinguishes the
repeatability component from the reproducibility component; the repeatability is the one
which looks at a measurement systems capability to produce measurements which are
close to each other when one instrument is used with one operator using the same
measurement method multiple times while reproducibility is the component that
determines how close measurements from different operators are to each other when
they use the same instrument and same measurement method [12].
Established literature has utilized measurement system analysis to both determine the
measurement system variation in relation to the part variation or total variation and the
variation compared to specified tolerance limits for the product or process. There have
been multiple capability criteria mentioned in literature such as %Study variation for
Gage R&R and number of distinct categories which is the number of non-overlapping
confidence intervals which cover the true value of the part that extends over the
variation expected in the product [6].
There are typically three methods for carrying out a measurement system analysis.
They are the range method, range and average method and analysis of variance
method. The range and average method is used for only determining the repeatability
and reproducibility of a system. From these calculations the combined Gage R&R
values is determined. The Gage R&R approach was used in the work of Guitar, where
he used the Gage R&R approach to first determine the capability of the measurement
system and subsequently the understand sources of variation produced by the system.
This approach made use of the analysis of variance method which helped in the source
identification process [21].
Measurement system analysis has also been used in a study to actively determine the
performance of multiple lathe machines which has shown the applicability of using
Gage R&R for a multi-system operation [22]. In this study, the capability of three CNC
systems were evaluated by measurement of the same inspection item of the same
samples that were produced by the different machines. This approach displayed the
applicability of using a measurement system analysis for the analysis of not just one
instrument with multiple operators but also multiple systems.
19There have been studies that show that continuous quality improvement processes
have been made possible in the automotive industry with the measurement system
analysis that uses Gage R&R [23].
The latest, 4th edition of the MSA manual from AIAG highlights the importance of using
the ANOVA method for determination of repeatability and reproducibility. This is
because it is able to classify the total variation into not just repeatability and
reproducibility but also includes parts variation along with the parts and operator
interaction. This approach has been used in multiple research papers and is justified as
the optimal approach.
203 Chapter 3: Methodology
The methodology to carry out drafting the MSA framework is described in this section,
with a look at the established DMAIC framework as its basis. Next, the proposed
framework is presented with descriptions of each step that needs to be satisfied for a
MSA study.
The thesis has primarily 3 objectives. The first objective was to propose a framework
that could be used to conduct a measurement system analysis. The motivation to
achieve this objective was due to the current literature having a focus on the precision of
a measurement system by identifying and calculating the repeatability and
reproducibility of a system with a Gage R&R study. While this type of approach did
determine overall precision, it was unable to provide a complete picture of the
measurement systems capability. To overcome this, the framework drafted in this study
included accuracy and its sub-components such as bias, linearity and stability in
determining the complete capability of a system with the Measurement System Analysis.
The first objective was achieved by a literature review of measurement system analysis
and the DMAIC framework.
The second objective was to test the application of the developed framework with the
use of a case study and help guide the improvements of the measurement system at
Northvolt based on this implementation.
The third objective was aimed at improving the current measurement system if it did not
meet the required acceptability criteria.
214 Chapter 4: Proposed framework to conduct MSA
The proposed framework has been drafted based established literature relating to
DMAIC and MSA, automotive industry guidebooks [19] [6].
4.1 DMAIC Improvement Cycle
DMAIC is the abbreviation for Define, Measure, Analyze, Improve and Control. This is
an improvement cycle that is driven by data for the use of improvement, optimization,
and stabilization of a process. This six sigma improvement cycle was successfully used
to carry out an improvement project on capability of a test bench for motor testing [24].
Figure 8. DMAIC cycle
4.1.1 Define
The Define stage helps determine the project scope and define milestones. For this
project, the aim of the project was defined, the scope and resources required were
determined. To better understand the manufacturing process, a process flow document
was created with information about the different quality checks required at each process
stage. From this list, the instruments that were critical to process control were identified
for the MSA study. The instrument chosen was an Image measurement system (IMS)
used to control dimensions. This process was carried out with consultation from the
project supervisor. Emphasis was placed on the process map understanding the
customer needs to define acceptance criteria for success of the MSA and the definition
22of the scope was also based on customer requirements and requirements for ISO
certification [21].
4.1.2 Measure
This stage looks at the measurement and collection of data for the instruments that are
defined in the scope. This phase looks at collection of data to measure the process or
system. For the thesis project, data was collected from controlled experiments to
quantify in a controlled environment the accuracy and precision. For this step, standards
which were measured by an accredited laboratory were used for reference in
determining the accuracy of a measurement system. In addition to this, samples from
the production were used to determine the precision of the measurement system [21].
4.1.3 Analyse
This stage is used to derive useful information from the data that is collected. This stage
helps in determining the root cause of the problem that is being investigated. There are
numerous statistical tools available such as process capability analysis, statistical
process control, Gauge R&R and root cause analysis which can be used to achieve this
[18]. Once the measurements are analysed, we can determine if the measurement
system is acceptable or not for the needs of production according to the acceptability
criteria. The acceptance criteria were predetermined according to the industry
standards. For this project, the different tools within Minitab were used and the data was
represented both numerically and graphically, in order to easily analyse and make
inferences [21].
This data analysis stage is crucial for implementing improvements in the improve stage,
in order to fulfil acceptance criteria thereby satisfying customer requirements.
4.1.4 Improve
Once the factors affecting the measurement system are analysed, they can be
investigated one by one to help improve the measurement system. A design of
experiment can play a big role in this improvement step as it will allow a test to be
carried out to determine what improvements need to be made based on change of
factors. This step would be carried out for the measurement systems that initially do not
meet the requirements of the system. The improve phase is always an iterative phase
that is performed until the target is achieved [21].
4.1.5 Control
This is the last step in the model and looks at ensuring the improvements that have
taken place are continued and new system capability is maintained. This can be done
23by periodic tests to assess the system capability and use of control charts to maintain
accuracy and precision. For this project, control charts were used to monitor system
capability [21].
4.2 DMAIC based MSA framework
The aim of the project is to obtain improvement in the measurement process by
improving the accuracy and reducing variability. Thus, the Six Sigma DMAIC model was
used as the basis for development of a framework which would be followed for
understanding measurement system capability and improvement of the system.
Figure 9. Development of framework
4.2.1 Step 1 - Preparation for study
● Check calibration of equipment.
24If we are using measuring equipment, it is necessary to ensure that the calibration is up
to date. An overdue calibration can lead to a bias being produced which would cause a
shift in measurement values to the reference values.
● Check machine resolution.
Adequate resolution is needed from the measurement system and as a guide, a suitable
resolution is taken as 1/10 of the required tolerance or better. For example, if we need
to measure a part with a specification of 60mm +/- 5mm, then the tolerance would be
10mm which would require a measurement system with required resolution of 1mm.
For analysis using attribute agreement we would require reference standards that can
differentiate between the different categories.
● SOP and Work instruction in place
There must be clearly defined standard operating procedures and work instructions in
place for the instrument operators to follow and this will help avoid misinterpretation with
the measurements being carried out.
● Training documented for operators.
The operators that perform the measurement on a regular basis are the ones that must
take part in the MSA study. There should be documentation of their training for the
instrument being investigated.
● Acceptance criteria
The various parameters and their corresponding acceptance values must be determined
at the start of this exercise so that a clear goal is defined.
A significant parameter that is controlled is the Gage R&R to tolerance value. According
to AIAG [6], the acceptance is defined as below:
Gage R&R
Decision Comments
value
25Recommended for
applications where there is a
need for classifying products or
Considered to be acceptable for
< 10% to monitor process variation.
measurement system
Decision based on type of
measurement system and its
application, cost of
measurement system and
10 - 30 % Acceptable for some applications cost or rework. Value needs to
be approved by the customer.
Definitely need to improve
> 30% Unacceptable for measurement system
system.
Table 1. Gage R&R acceptability criteria
The precision of a measurement system can be assessed with the help of a Gage R&R
study [13]. The analysis carries out the setup and execution of a controlled experiment
which checks the repeatability and reproducibility of the system or in other words within
appraiser and between appraiser agreement. This involves selection of several samples
and their measurement multiple times by a person or instrument. A typical gage R&R
study would involve 3 operators, 5 to 10 samples which are each measured with 2 to 3
repetitions [14].
There are multiple types of Gage R&R that can be employed to understand the
capability of a measurement system. The main types are Analysis of variance (ANOVA)
Gage R&R, classical Gage R&R (average and range method) and long form Gage R&R.
A study in which the three methods were compared to understand the effectiveness by
using data from a normal distribution and comparing the bias with different runs of each
method concluded that the ANOVA method was the most accurate with classis Gage
26R&R coming in second and long form Gage R&R in third place [15]. The ANOVA
method is more accurate as it includes variation among parts and operators and can be
done easily with statistical software packages.
There are multiple outcomes that are possible in a Gage R&R study and each of these
outcomes infer a possible cause for variability. Some of these are:
1) When repeatability is greater than reproducibility, it can be caused by a need of
maintenance for the instrument, there may be a need for a more rigid instrument,
improvements may be required in the fixturing and possibly large within-part
variability [16].
2) When reproducibility is greater than repeatability, there may be a need to further
train operators in the use of the measurement system or possibly there are
ambiguous instructions in the method that being operator variability.
If the number of distinct categories is less than 5, the measurement system does not
have adequate resolution or discrimination of measurement values [17].
The number of distinct categories is another number we must keep a close eye on.
According to standard procedure, a system with 5 or more distinct categories is
acceptable. This number signifies the number of distinctions an instrument can place a
part in. For these results to be helpful for process control, there needs to be many
distinctions for the part to be placed in.
4.2.2 Step 2 - Measurement plan
Accuracy measurement (Bias and Linearity):
● Sample selection
Obtain a suitable master sample with a value that is considered the true value. Measure
the sample 10 times with the exact same instrument setup. Next for linearity, repeat the
above 10 measurements on multiple reference/master samples such that these
samples are spread out in the measurement range.
Precision measurement (Gauge R&R):
● Sample selection
The first step of the planning involves the selection of appropriate samples that can be
measured. A common practice is to use at least 10 parts for a Gage repeatability and
reproducibility study while it is 20 for an attribute agreement analysis. Also, each part
should be measured by at least 3 appraisers, 3 times each. This produces a study with
90 measurements. The selection of samples is very important and they should
represent the full process range as this helps determine if the measurement variation is
similar across the entire range.
27● Choosing of appraisers
The study should involve the operators that use the instrument regularly and it is
recommended to select three of them. If there are appraisers in multiple shifts, they
must be represented as well.
● Study scheduling
A study with 10 samples being measured by 3 appraisers for 3 times each would
generate 90 measurements and this would render the measurement system inactive for
production use thereby interfering with the regular operation of the facility or lab. It is
good to estimate the time required to measure each part and plan the study around the
production schedule.
4.2.3 Step 3 - Measurement execution
● Data collection
The data collection can be easily done using a Minitab worksheet. The software will
allow the randomization of data and this will help spread out variations caused by time
or environment.
During this stage, it is also recommended to have a single method owner or instrument
owner who is responsible for documenting the data entry as this will ensure operators
who are participating in the study are not aware of the target values.
4.2.4 Step 4 - Result analysis and interpretation
Accuracy measurement:
Bias: Find the difference between actual value and measured value for each
measurement and plot it on a graph to observe bias.
Linearity: For linearity, plot the bias versus reference values on a graph and observe a
linearity if there exists any.
Stability: The stability of the gauge can be determined by measuring the same reference
sample multiple times over a long period of time. This analysis over time is also referred
to as the change in bias over time and gives a good indication of variation of
measurements from external factors.
Precision measurement (Gauge R&R):
The test plan for Gauge R&R requires 10 samples that represent the process range to
be measured by 3 operators with 3 repetition measurements each. This results in a test
with 90 measurement values to be used in the analysis software.
28● Data analysis
The statistical method used to for the Gage R&R study was the analysis of variance
(ANOVA) as it can estimate confidence intervals for the various sources of error in the
measurement system and provide more accurate analysis [15]. If the system is not
capable enough, the variation in readings will be large. This technique will help quantify
the magnitude of variation so that a decision can be made whether to accept the system
or not.
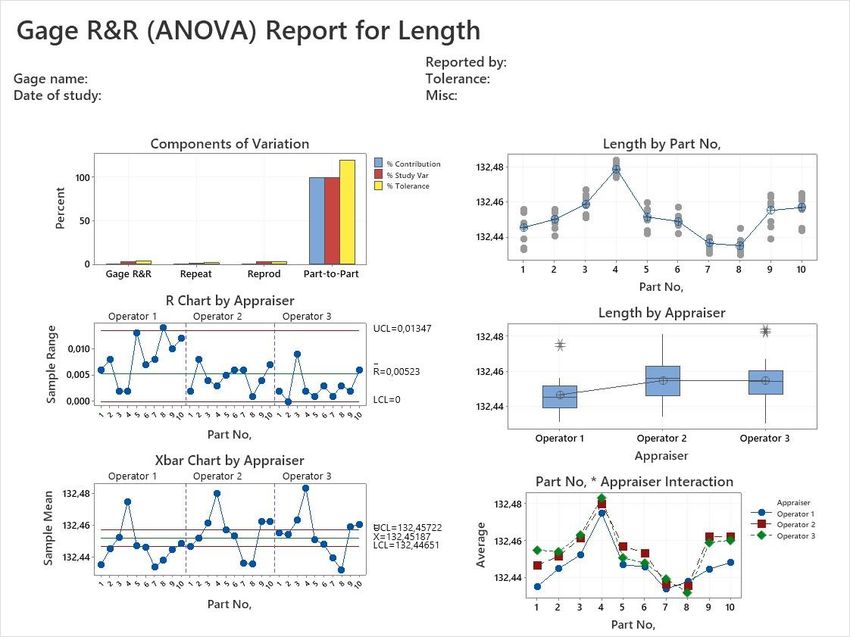
Components of variation:
One of the most important graphs is the ‘components of variation’. This will tell us the
overall performance of the system. It is desirable to obtain small graphs for Gage R&R,
repeat and reproducibility bars in comparison to the part-to-part bar. A large graph for
part-to-part denotes that most of the study variation is due to the variation among parts
due to the production process. It is easy to point out the cause of variation from this
graph.
R chart by operator 2:
The second chart obtained is the ‘R chart by operator’. This graph depicts the range of
results by each appraiser for every sample that is measured. The entire graph is
segmented by the appraiser. Each of these segments plot the range for every part that
has been measured.
This graph can be interpreted by observing the outlying points (outside the control limits)
as these are indicative of the lack of consistency by the appraiser for that part.
Xbar chart by operaotr:
This chart is called the ‘Xbar chart by operator’. Similar to the previous graph, there
are segments for every operator. The difference here is that the average measurement
for each part is shown.
A good measurement system would indicate at least 50% of the points to be above or
below the control limits. This must not be confused with a process control chart as the
X-bar chart in this section depicts variation from the instrument. Hence, it is
advantageous to have the points outside the limits as it indicates most of the variation is
due to part-to-part variation.
Response by part:
This graph is called the ‘Response by part’. The Y-axis represents measurement value
in the experiment and each value is represented by a small circle and the average is a
big circle enclosing the smaller circles.
29A consistent system would show very little difference among the measurements for
every sample which means that overlapped circles are desired. A spread of circles that
is large would require further investigation.
Response by Operator:
The next graph is called ‘Response by Operator’. With this graph we get a circle which
is the average of measurement values by each individual appraiser. Box plots are
shown to display the variation among results for every operator. The height of a box is
indicative of middle 50% of variation in values. The length of the plot shows the full
range of variation.
This graph can be interpreted by observing the line connecting the box plot averages. A
good system would show a flat line connecting them. Bad reproducibility would be
indicated by non-horizontal lines and would mean that an operator is consistent but
different in comparison to other operators. Bad repeatability would be shown by a large
box which means there is larger variation among measured values.
Part*Operator interaction:
The final graph is the ‘Part*Operator interaction’. The graph provides an overlay for
every measurement item by operator. The averages of each operator are shown and
joined by lines.
An acceptable system would have points overlapping or very close to each other and
the connecting lines for each operator would be parallel. Any deviation from this would
require further investigation.
Numerical interpretation:
VarComp
The VarComp value signifies the variance of different components for every source in
the ANOVA table.
Interpretation:
This component is useful to analyse the variation produced by every error source in the
measurement system.
30In a typical measurement system, the part-to-part component has the largest component
of variation. A large value of VarComp for repeatability and reproducibility indicates that
the measurement system must be instigated in detail and actions taken to improve it.
%Contribution (of VarComp)
%Contribution denotes the percentage of each source of error in the total variation.
Study Var (6 * SD)
The study variation is calculated by multiplying the standard deviation for every type of
variation by the multiplier specified in the gage settings, it is by default taken as 6.
In general, the process variation is specified as 6s, in which the s stands for standard
deviation which estimates the standard deviation of the population. When it is given that
the data follows a standard distribution, it is approximated that 99,73% of the data would
fall within six standard deviations of mean. A different percentage of data can be
considered by choosing a different multiplier. A distribution of different percentages for
respective sigmas is shown in figure x.
31Figure 10. Bell curve
%Study Var (%SV)
The %study variation represents the study variation for every source of variation, divided
by the total variation and multiplied by 100.
%Study Var is calculated as the square root of the respective variance component
(VarComp) for a source. Therefore, %Contribution of VarComp values add up to 100,
while the %Study Var values do not.
Interpretation:
The %Study Var is used to compare the measurement system variation to the total
variation. The %Study Var is a good estimate of the precision for measurement systems
if you use it for determining improvements in the process.
32%Tolerance (SV/Toler)
%Tolerance is calculated as the study variation for each source, divided by the process
tolerance and multiplied by 100.
The tolerance can be an input in the Minitab program and it will then calculate the
variation of the measurement system in comparison to the specification tolerance.
Interpretation:
Use %Tolerance to evaluate parts relative to specifications. If you use the measurement
system for process improvement, such as reducing sample variation, %StudyVar is the
appropriate evaluation parameter.
%Process (SV/Proc)
%Process is used to compare the variation due to the measurement system to the
historical standard deviation. The %Process is calculated as the study variation for
every factor, divided by the historical process variation and multiplied by 100. The
process variation is by default six times the historical standard deviation.
95% CI
This value denotes the ranges of values that are likely to contain the true value of each
measurement error source.
Minitab provides confidence intervals for all the reported numerical parameters in the
results section.
Interpretation:
The randomization of sample data will result in different confidence intervals for different
gage experiments. But, if you repeat your studies many times, a certain percentage of
the resulting confidence intervals contain the unknown true measurement error.
33A 95% confidence level provides us a confidence of 95% that the confidence interval
contains the true value.
Number of distinct categories
This parameter helps identify the ability of a measurement system to group
measurements into different categories. It designates the number of non-overlapping
confidence intervals that span the range of sample variation.
Interpretation:
According to The Measurement Systems Analysis Manual published by the Automobile
Industry Action Group (AIAG), a measurement system requires at least 5 distinct
categories to qualify as an acceptable system. A measurement system with less than 5
distinct categories indicates that it does not have sufficient resolution.
During the course of the project, it was observed that if very similar samples are
selected, there is a possibility of a number of distinct categories being 1 as this does not
represent the entire process variation. Samples must be chosen such that they cover
the entire process range.
4.2.5 Step 5- Improve phase
If the analysis results are not satisfactory, improvements will need to be made to ensure
the measurement system follows the acceptability criteria defined in the definition
phase.
4.2.6 Step 6- Control phase
After the measurement system analysis and improvement is carried out, the system
needs to be continuously tracked so that it operates within the control limits and
provides an alert if the measurement system begins to drift away from ideal
performance.
34You can also read