Cost-Benefit Analysis of the Thematic Strategy on Air Pollution
←
→
Page content transcription
If your browser does not render page correctly, please read the page content below
AEAT/ ED48763001/Thematic Strategy. Issue 1

    Cost-Benefit Analysis of the
     Thematic Strategy on Air
            Pollution

                            October 2005
Service Contract for Carrying out Cost-Benefit Analysis of Air
Quality Related Issues, in particular in the Clean Air for Europe
                     (CAFE) Programme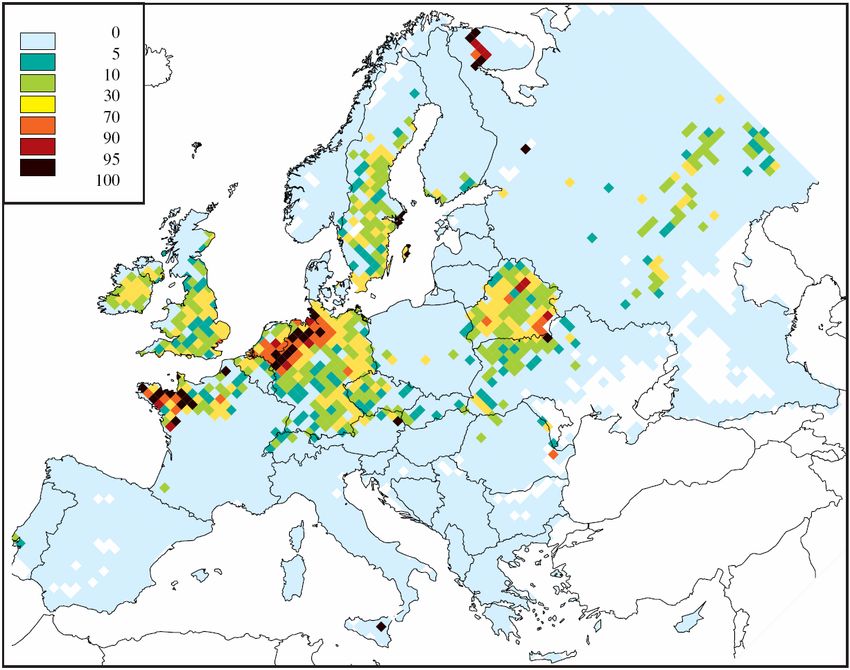
AEAT/ ED48763001/Thematic Strategy. Issue 1

Title                     Cost-Benefit Analysis of the Thematic Strategy on Air
                          Pollution for
                          Service Contract for carrying out cost-benefit analysis of air
                          quality related issues, in particular in the clean air for Europe
                          (CAFE) programme

Customer                  European Commission DG Environment

Customer reference        ENV.C.1/SER/2003/0027

Confidentiality,          This document has been prepared by AEA Technology plc in
copyright and             connection with a contract to supply goods and/or services and
reproduction              is submitted only on the basis of strict confidentiality. The
                          contents must not be disclosed to third parties other than in
                          accordance with the terms of the contract.

Validity                  Issue 1

File reference

Reference number          AEAT/ ED48763001/Thematic Strategy

                 AEA Technology Environment
                 The Gemini Building, Fermi Avenue
                 Harwell International Business Centre
                 Didcot, OX11 0QR, United Kingdom
                 Telephone +44 (0) 870 190 6592
                 Facsimile +44 (0) 870 190 6318
                 Email: paul.watkiss@aeat.co.uk

                 AEA Technology Environment is a business division of
                 AEA Technology plc

                 AEA Technology Environment is certificated to ISO9001 & ISO 14001

                          Name                                Signature               Date
Authors                   Benefits assessment,
                          uncertainty analysis
                          Mike Holland (EMRC)
                          Paul Watkiss, Steve Pye (AEA
                          Technology)
                          GEM-E3 analysis:
                          Ana de Oliveira, Denise Van
                          Regemorter
Reviewed by               Paul Watkiss

Approved by               Paul Watkiss
AEAT/ ED48763001/Thematic Strategy. Issue 1

Executive Summary
In May 2001, the European Commission launched the Clean Air for Europe (CAFE)
Programme – a knowledge based approach with technical/scientific analyses and policy
development that will lead to the adoption of a Thematic Strategy on Air Pollution, fulfilling
the requirements of the Sixth Environmental Action Programme. Its aim is to provide long-
term, strategic and integrated policy advice for ‘achieving levels of air quality that do not give
rise to significant negative impacts on and risks to human health and the environment’;
including ‘no exceedance of critical loads and levels for acidification or eutrophication’.

This report presents the cost-benefit analysis of the Thematic Strategy which was adopted by
the European Commission on 21 September 2005. The strategy defines emissions against a
series of ambition levels for reducing the impacts of ozone and fine particles on health, and
acidification and eutrophication on ecosystems as show in Table i):

Table i) Numerical values of the effect indicators for current legislation, the Thematic
Strategy and Maximum Technically Feasible Reduction scenarios in 2020

                                                 Current         the Strategy       Maximum
                                              legislation in                        Technically
                                                  2020                                Feasible
                                                                                     Reduction
Years of life lost due to PM2.5 (EU-wide,             137          106.5                96
million YOLLs)                                       (0%)          (75%)              (100%)
Acidification (country-wise gap closure on            0%            55%                100%
cumulative excess deposition)
Eutrophication (country-wise gap closure on          0%             55%                100%
cumulative excess deposition)
Ozone (country-wise gap closure on SOMO35)           0%             60%                100%

The % ‘gap closure’ here relates to the gap between the situation in 2020 if Current
Legislation (CLE) was fully implemented and the Maximum Technically Feasible Reduction
(MTFR) scenario of the RAINS model. CLE is also referred to as the “CAFE baseline”.
Damage, even under the MTFR scenario, is projected to be substantial, as can be seen in the
years of life years lost due to PM2.5.

The cost-benefit analysis (CBA) presented in this report takes as its starting point pollution
data generated by the EMEP and RAINS models for the current legislation, the Strategy and
MTFR scenarios. Benefits are assessed using the CAFE CBA methodology, developed
following extensive consultation with CAFE stakeholders, including WHO and other
European expert groups and independent peer review.

Benefits are assessed for the following receptors:
• Health (mortality and morbidity), impacts and monetary equivalent;
• Materials (buildings), impacts and monetised damages;
• Crops, impacts and monetised damages;
• Ecosystems (freshwater and terrestrial, including forests), impacts in terms of critical
   loads and levels exceedance, but without monetisation.

                                                 i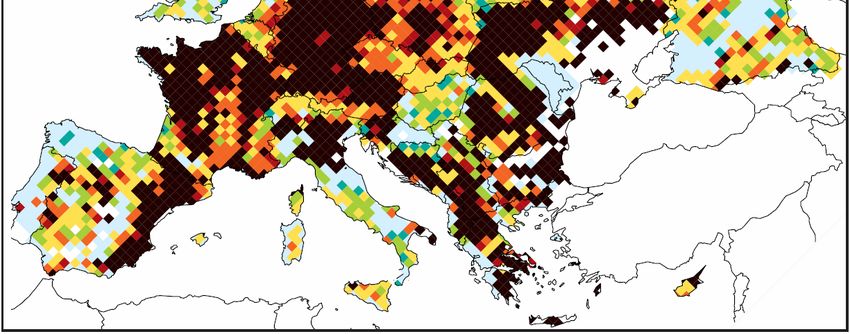
AEAT/ ED48763001/Thematic Strategy. Issue 1

Health benefits across the EU
Core estimates of health impacts from exposure to ozone and fine particles are shown in
Table ii). These results link ozone exposure to 21,000 deaths in the EU25 in 2020, with a
reduction to around 19,000 cases per year with the Strategy. For particles, the numbers are
larger, with 2.5 million life years lost in 2020 under current legislation, falling to around 1.9
million under the Strategy. The table also shows that air pollution is likely to cause many
thousands of hospital admissions each year and many millions of days of ill health across the
EU25.

Table ii) Estimated annual health impacts due to air pollution in the EU25 under
current legislation, the Strategy and the MTFR in 2020(thousands)
                                                                       Current
                                                                                           the
End Point Name                                                    legislation in                        MTFR
                                                                                      Strategy
                                                                           2020
Ozone effects
Acute Mortality (thousand premature deaths)1                                  21              19              18
Respiratory Hospital Admissions (thousands)                                   20              19              17
Minor Restricted Activity Days (thousands)                               42,000          39,000           36,000
Respiratory medication use (thousand days, children)                     13,000          12,000           11,000
Respiratory medication use (thousand days, adults)                         8,200          7,500            7,000
Cough and LRS (thousand days children)                                   65,000          60,000           56,000
PM effects
Chronic Mortality2 – thousand years of life lost (YOLLs)                   2,500          1,900            1,700
Chronic Mortality2 – thousand deaths                                         270            210              190
Infant Mortality (0-1yr) – thousand deaths                                  0.35            0.27            0.25
Chronic Bronchitis (thousand cases, adults)                                  128              99              90
Respiratory Hospital Admissions (thousands)                                   42              33              30
Cardiac Hospital Admissions (thousands)                                       26              20              18
Restricted Activity Days (thousands)                                    220,000         170,000         160,000
Respiratory medication use (thousand days, children)                       2,000          1,500            1,400
Respiratory medication use (thousand days, adults)                       21,000          16,000           15,000
Lower Respiratory Symptom days (thousands, children)                     89,000          69,000           62,000
Lower Respiratory Symptom days (thousands, adults)                      210,000         161,000         150,000
1) The estimates of acute mortality due to ozone are in this analysis somewhat different from those reported by
the RAINS model. This is due to the fact that in the analysis carried out for 2020, we use the age distribution of
the population as of 2020. However, the age distribution used in RAINS was based on 2000 data. Thus, the
effects of ozone on mortality are more up-to-date in this report. However, the difference of the CBA and RAINS
analysis between CLE and the Strategy is small.
2) For chronic mortality (PM), two alternative values are presented, based on quantification using years of life
lost and numbers of premature deaths). The two measures are not additive.

These health effects have been converted to a monetary equivalent. Table iii) shows that the
total annual health benefits of the Strategy range from €42 to €135 billion for the EU25. The
range here arises from the use of alternative methods for mortality valuation.

                                                        ii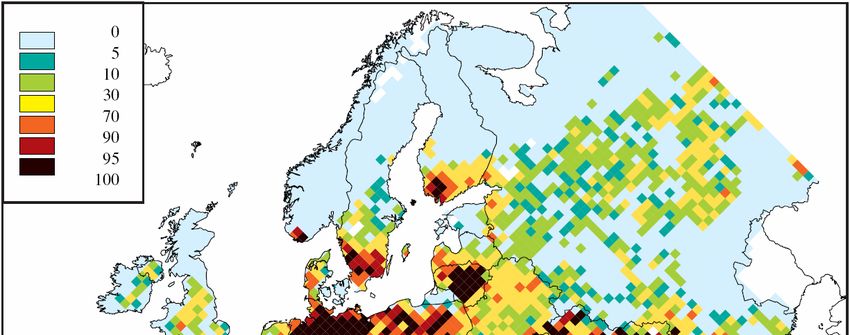
AEAT/ ED48763001/Thematic Strategy. Issue 1

Table iii) Core estimates of annual health damage and benefits due to air pollution in
EU25, with the Thematic Strategy Scenario, and under a MTFR scenario in 2020
                                                                    Billion Euro/year
                                              Current legislation          the
Total Damage                                       in 2020              Strategy
                                                                                        MTFR
Low estimate                                         189                  147            133
High estimate                                        609                  474            427
                                                                           the
Benefit over CLE baseline                                               Strategy
                                                                                        MTFR
Low estimate                                                               42            56
High estimate                                                             135            181

Non-health impacts
Damage to crops from ozone exposure and to materials from acidic deposition in the year
2020 is estimated here to cause around €2.2 billion of damage a year under the CAFE
baseline. The Strategy is estimated to provide annual benefits of €0.3 billion as reduced crop
damage thus benefiting the agriculture sector. In addition, the annual benefits of reduced
damage to buildings of the Strategy are estimated to be about €0.2 billion. In total, monetised
non-health benefits have been estimated to be €0.5 billion every year due to the Strategy.

These figures specifically exclude damage to ecosystems as there is currently no adequate
basis to perform monetisation of ecological damage of the types of concern here, and at the
European scale. However, information on critical loads exceedance has been generated by the
RAINS model (Table iv).

Table iv) Summary statistics on critical loads and levels, showing % area over which
there is exceedance across the EU25
                                          2000          Current       the Strategy      MTFR
                                                      legislation
                                                        in 2020
Eutrophication       Ecosystems           57%              46%            33%           15%
Acidification        Forests              21%              10%             6%           3%
Ozone                Forests              61%              56%            52%           28%

The table demonstrates widespread exceedance of the critical load for eutrophication and the
critical level for ozone remaining in 2020. Acidification has been brought under better
control, though there are still a significant number of ecosystems at risk. By summarising
across the EU25, Table iv) does not pick up some important distributional issues, specifically,
that critical levels exceedance for ozone is sharply divided, with little or no exceedance in
Northern EU Member States (Estonia, Finland, Latvia, Lithuania and Sweden) but extensive
exceedance in all others.

Comparison of costs and benefits
The information given above on monetised benefits of the different policy scenarios has been
compared against the costs estimated by the RAINS model. Results in Table v) are expressed
in terms of net benefits (i.e. the total level of benefit achieved) and the benefit:cost ratio
(essentially the effectiveness of each scenario in achieving benefits) in relation to the CLE
baseline scenario. At this point, no account is taken of uncertainty other than in mortality
valuation (which generates the Low-High ranges shown).

                                              iii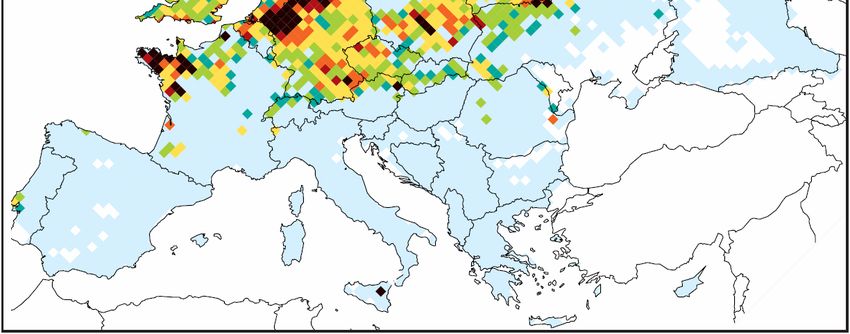
AEAT/ ED48763001/Thematic Strategy. Issue 1

Table v) Comparison of annual costs and benefits for the EU25 under the different
scenarios relative to the CLE baseline (€billion/year) in 2020.No account is taken of
damage to ecosystems, some health impacts, and cultural heritage.
                                                           the Strategy             MTFR
EU Annual monetised benefits (health, materials and
crops)
Low estimate                                                     42                   57
High estimate                                                   136                   182
EU-25 Annual Total Costs – change over base line
Total                                                           7.1                   39.7
NET benefits (Monetised Benefits minus Total Costs)
Low estimate                                                     35                   17
High estimate                                                   129                   143
Benefit to Cost Ratio
Low estimate                                                     5.9                  1.4
High estimate                                                   19.0                  4.6

It is stressed that the analysis above does not include all benefits – notably it excludes benefits
to ecosystems, some health impacts, for instance those of secondary organic aerosols (SOAs)
and impacts on cultural heritage. It is evident from the scoping analysis carried out as part of
the CBA that these impacts are likely to add significant benefits to those already quantified.
The scoping study suggested annual benefits between €1.7 to 5.7 billion as a result of the
Strategy. The importance of the un-monetised benefits is also evident from estimates of the
extent of exceedance of critical levels for ozone and critical loads for acidification and
eutrophication shown in Table iv).

Uncertainty analysis
Results of the cost-benefit comparison have been subject to an extensive uncertainty analysis.
This has considered the following factors in particular, selected on the basis of our own
experience and comments made by other experts:
   • Statistical uncertainty in health inputs for incidence rates, response functions and
       valuation data;
   • Sensitivity to the use of alternative approaches to mortality assessment;
   • Sensitivity to a reduced risk factor for the dominant impact, mortality from chronic
       exposure to particles;
   • Review of unquantified aspects of the analysis that will bias the results up or down.

Results of the uncertainty analysis demonstrate a robust case for moving from the baseline to
the Strategy with a very high probability of benefits exceeding costs (for all plausible sets of
assumptions considered in the analysis >99%).

Macroeconomic analysis using GEM-E3
No specific macroeconomic analysis was carried for the Strategy. However, based on
macroeconomic analysis on Scenarios A, B and C in the earlier stages using GEM-E3 model
(General Equilibrium Model – Energy, Economy, Environment), it was demonstrated that:
  • The macroeconomic cost in terms of reduced gross domestic product is about 0.05% in
     2020 per annum.
  • These costs are very small compared to the health benefits and ecosystem
     improvements.

                                                iv
AEAT/ ED48763001/Thematic Strategy. Issue 1
• Net effect on employment was zero, implying that some sectors would gain and some
lose in terms of employment.
• The benefits of reduced air pollution return mainly to the EU citizens.
• The effect on the competitiveness of the sectors is small because the price effect is
limited and all EU member states participate in the abatement effort.
Overall conclusions
This report summarises the benefits of the Strategy for air quality in Europe in 2020. It shows
that large benefits are predicted to occur from these scenarios, with monetised annual health,
crops and materials benefits in the range between €42 billion and €136 billion for the year
2020, depending on what values are used for reduced mortality due to particulate matter.
The health benefits alone of the Strategy exceed costs, by between six and 19 times.
The annual health benefits for every EU citizen from the Strategy are estimated at €94 to €301
in 2020. This compares to the average annual costs per citizen of €15 in 2020.
The above conclusion excludes benefits from effects excluded from the monetary framework
– notably benefits to ecosystems, to health via reduced exposure to secondary organic
aerosols, and to cultural heritage. Including these effects would increase the monetised
benefits of reduced air pollution.
vAEAT/ ED48763001/Thematic Strategy. Issue 1
Acknowledgements
The authors want to thank all their colleagues who have contributed to the development of the
CAFE scenario analysis. In particular, we acknowledge the contributions of:
The RAINS team under the leadership of Markus Amann at the International Institute for
Applied Systems Analysis.
The EMEP/MSC-W team providing atmospheric dispersion calculations under the leadership
of Leonor Tarrason at the Norwegian Meteorological Institute
viAEAT/ ED48763001/Thematic Strategy. Issue 1
Contents
INTRODUCTION.................................................................................................................... 1
BACKGROUND TO THIS REPORT ............................................................................................... 1
SCENARIOS INVESTIGATED ...................................................................................................... 1
METHODS ................................................................................................................................ 2
SUMMARY RESULTS – HEALTH IMPACTS................................................................... 3
HEALTH IMPACT ASSESSMENT - RESULTS ................................................................................ 3
HEALTH IMPACT ASSESSMENT - DISCUSSION ........................................................................... 6
SUMMARY RESULTS – HEALTH VALUATION............................................................. 7
NON-HEALTH IMPACTS ................................................................................................... 10
CROPS ................................................................................................................................... 10
MATERIALS ........................................................................................................................... 10
ECOSYSTEMS ......................................................................................................................... 11
INITIAL COMPARISON OF COSTS AND BENEFITS .................................................. 22
UNCERTAINTY / SENSITIVITY ANALYSIS .................................................................. 33
METHODS FOR DESCRIBING UNCERTAINTIES ......................................................................... 33
UNCERTAINTY ANALYSIS: RESULTS ...................................................................................... 34
ASSESSMENT OF THE MACROECONOMIC IMPACT OF THE CAFE
SCENARIOS........................................................................................................................... 38
OVERALL CONCLUSIONS................................................................................................ 39
REFERENCES ....................................................................................................................... 41
viiAEAT/ ED48763001/Thematic Strategy. Issue 1
Introduction
Background to this report
In May 2001, the European Commission launched the Clean Air for Europe (CAFE)
Programme – a knowledge based approach with technical/scientific analyses and policy
analysis designed to lead to the adoption of a Thematic Strategy on Air Pollution, fulfilling
the requirements of the Sixth Environmental Action Programme. Its aim is to develop a long-
term, strategic and integrated policy advice for ‘achieving levels of air quality that do not give
rise to significant negative impacts on and risks to human health and the environment’;
including ‘no exceedance of critical loads and levels for acidification or eutrophication’.
Using results from the CAFE analysis, the European Commission adopted the Thematic
Strategy on Air Pollution on 21 September 20051, outlining the environmental objectives for
future European air quality policy and measures to be taken to achieve these objectives. This
report provides the comparison of costs and benefits for the Thematic Strategy scenarios for
reducing damage to health from exposure to ozone and fine particles (PM2.5) and to
ecosystems from acidification and eutrophication.
Scenarios investigated
The starting point for the analysis is a scenario that forecasts emissions in the year 2020 under
current legislation (CLE), summarised in Table 1, assuming that countries fulfil their Kyoto
obligations and carry on implementing greenhouse gas reduction policies through to 2020.
Table 1. Legislation considered in the Current Legislation (CLE) scenario (source:
IIASA/EMEP, 2004).
for SO2 emissions for NOX emissions for VOC emissions for NH3 emissions
Large combustion plant Large combustion plant Stage I directive No EU-wide
directive directive legislation
Directive on the Auto/Oil EURO standards Directive 91/441 National legislation
sulphur content in (carbon canisters)
liquid fuels
Directives on quality of Emission standards for Auto/Oil EURO Current practice
petrol and diesel fuels motorcycles and mopeds standards
IPPC legislation on Legislation on non-road Fuel directive (RVP of
process sources mobile machinery fuels)
National legislation and Implementation failure of Solvents directive
national practices (if EURO-II and Euro-III for
stricter) heavy duty vehicles
IPPC legislation for Directive on reducing
industrial processes VOCs from products
(e.g. paints)
National legislation and National legislation,
national practices (if stricter) e.g., Stage II
Source: IIASA/EMEP (2004)
1
Thematic Strategy on Air Pollution (COM(2005) 446). Directive on Ambient Air Quality and Cleaner Air for
Europe (the “CAFE” Directive) (COM(2005) 447) adopted by the European Commission on 21 September
2005, available at e.g. http://europa.eu.int/comm/environment/air/cafe/index.htm
1AEAT/ ED48763001/Thematic Strategy. Issue 1
Earlier analysis in CAFE quantified the impacts and associated damage that would occur
under the baseline scenario and a series of illustrative scenarios where emissions were varied
between current legislation and the maximum technically feasible reduction (MTFR)
according to the RAINS model2. This allowed identification of different ambition levels for
reducing impacts of ozone and fine particles on health and acidification and eutrophication on
ecosystems. These were then combined to construct three main scenarios, labelled A, B and
C. The analysis of these options is included in a previous CAFE-CBA report (AEA
Technology, 2005) and are summarised below, along with the indicators for the scenario
adopted by the European Commission on 21 September 2005m called “the Strategy”..
Table 2. Selected numerical values of the effect indicators for the CAFE scenarios
Current Scenario the Scenario Scenario Maximum
Legislati A Strategy B C Technically
on in Feasible
2020 Reduction
(CLE) (MTFR)
Years of life lost due to 137 110 106.5 104 101 96
PM2.5 (EU-wide, (75%)
million YOLLs)
Acidification (country- 0% 55% 55% 75% 85% 100%
wise gap closure on
cumulative excess
deposition)
Eutrophication 0% 55% 55% 75% 85% 100%
(country-wise gap
closure on cumulative
excess deposition)
Ozone (country-wise 0% 60% 60% 80% 90% 100%
gap closure on
SOMO35)
The term ‘gap closure’ here relates to the gap between the Current Legislation (CLE) and the
Maximum Technically Feasible Reduction (MTFR) scenarios. It is forecast that substantial
damage will remain even under the MTFR scenario, as shown by the years of life lost to fine
particle exposure.
Methods
The CAFE CBA methodology used here was described in three volumes (Holland et al,
2005a, b; Hurley et al, 2005) available from http://www.cafe-cba.org and described in a
synthesized form in AEA Technology (2005). This latter report also includes a more
developed account of the methods used for uncertainty assessment in the CBA, highlighting
those factors, such as sensitivity to the function used to quantify chronic mortality impacts of
fine particles, that make most difference to the analysis.
The GEM-E3 model has not been used specifically in analysis of the Strategy scenario, as it
was possible to interpolate between Scenarios A and B described by AEA Technology (2005).
2
Note that the MTFR scenario does not provide a true maximum reduction in emissions as the RAINS model is
unable to include all possible abatement measures, and does not factor in some potential improvement for
efficiency in the measures that are included.
2AEAT/ ED48763001/Thematic Strategy. Issue 1
Summary Results – Health Impacts
The first set of tables shows the totals for each of the ‘core’ set of health impacts for the
EU25. The analysis presents estimated total health impacts across the EU25 for the year 2020
for the CAFE baseline. All are based on 1997 meteorological data. The analysis has also
presented the total health impacts for the Strategy and the MTFR in 2020.
The impacts are split into mortality (i.e. premature deaths) and morbidity (i.e. illness) by
pollutant (PM and ozone). The quantification of health impacts addresses the impacts related
to both long-term (chronic) and short-term (acute) exposures. The analysis includes impacts
of anthropogenic emissions giving rise to PM2.5 (excluding PM from natural sources and
secondary organic aerosols). Ozone health effects are assessed against the SOMO35 metric –
the sum of the daily maximum 8-hour mean ozone concentration with a cut-off at 35 ppb3.
The results show the number of events that take place in each year (i.e. the annual number of
impacts or new cases4), or the change in the number of impacts and cases over time.
Two alternative approaches are used for chronic mortality, to derive years of life lost and
premature deaths. These two estimates should not be added.
Health impact assessment - results
The results are shown in Table 4. This presents the total numbers of impacts with baseline
pollution concentrations in 2020. It also shows the total number of impacts under the Strategy
Scenario and the MTFR scenario. Table 5 shows the change in impacts, i.e. the benefits of
the Strategy and the MTFR over the 2020 baseline.
Here, the analysis has used the RAINS model for PM concentration data, and the EMEP
model for other pollutants (including effects on ecosystems), based on the latest model runs.
This modelling is consistent with other information presented on the scenario analysis under
the CAFE programme.
3
This means that for days with ozone concentration above 35 ppb as maximum 8-hour mean, only the increment
exceeding 35 ppb is used to calculate effects. No effects of ozone on health are calculated on days below 35 ppb
as maximum 8-hour mean. It is likely that the overall effects of ozone on mortality are underestimated by this
approach.
4
For chronic mortality, this involves a different metric to the output from the RAINS model, which works with
the change in years of life lost from sustained pollution levels over 80 years, i.e. it works with a total ‘stock’
concept, rather than an annualised metric.
3AEAT/ ED48763001/Thematic Strategy. Issue 1
Table 3. Analysis of the Strategy: Estimated annual health impacts due to air pollution in 2020 in the EU25, plus the total impacts under
the Strategy and the MTFR (2020)
Current the
End Point Name CORE Functions MTFR
Legislation in 2020 Strategy
Acute Mortality * Premature deaths O3 20,800 19,200 17,759
Respiratory Hospital Admissions (65yr +) Cases O3 20,100 18,500 17,160
Minor Restricted Activity Days (MRADs 15-64yr) Days O3 42,415,500 39,191,000 36,484,733
Respiratory medication use (children 5-14yr) Days O3 12,925,900 11,961,000 11,164,595
Respiratory medication use (adults 20yr +) Days O3 8,171,700 7,548,200 7,025,333
Cough and LRS (children 0-14yr) Days O3 65,278,600 60,350,200 56,204,229
Chronic Mortality – YOLL (Years of Life Lost)** Life years lost PM 2,467,300 1,911,800 1,722,700
Chronic Mortality – deaths** Premature deaths PM 271,600 210,900 190,200
Infant Mortality (0-1yr) Premature deaths PM 350 270 250
Chronic Bronchitis (27yr +) Cases PM 128,100 99,400 89,600
Respiratory Hospital Admissions (All ages) Cases PM 42,300 32,800 29,500
Cardiac Hospital Admissions (All ages) Cases PM 26,100 20,200 18,200
Restricted Activity Days (15-64yr) Days PM 221,999,100 171,960,900 154,985,400
Respiratory medication use (children 5-14yr) Days PM 1,987,700 1,536,300 1,379,300
Respiratory medication use (adults 20yr +) Days PM 20,879,800 16,183,700 14,591,600
Lower Respiratory Symptom days (children 5-14) Days PM 88,852,300 68,840,100 61,889,500
LRS among adults (15yr +) with chronic symptoms Days PM 207,562,100 160,856,000 144,995,400
*) Results for acute mortality effects of ozone are slightly different to those generated by the RAINS model, as RAINS keeps population constant at 2000 levels and the CBA
model factors in population change to 2020. Differences in terms of estimated benefit between current legislation and the Strategy are, however, small.
**) Two alternative metrics are used for the presentation of chronic mortality from PM. Firstly in terms of years of life lost and secondly in terms of numbers of premature
deaths. These are not additive.
4AEAT/ ED48763001/Thematic Strategy. Issue 1
Table 4. Analysis of the Strategy: Estimated annual health benefits (i.e. the difference between the CLE baseline and the Strategy and
the MTFR) in 2020 in the EU25.
End Point Name CORE Functions the Strategy MTFR
Acute Mortality (All ages)* Premature deaths O3 1,600 3,041
Respiratory Hospital Admissions (65yr +) Cases O3 1,600 2,940
Minor Restricted Activity Days (MRADs 15-64yr) Days O3 3,224,500 5,930,767
Respiratory medication use (children 5-14yr) Days O3 964,900 1,761,305
Respiratory medication use (adults 20yr +) Days O3 623,500 1,146,367
Cough and LRS (children 0-14yr) Days O3 4,928,400 9,074,371
Chronic Mortality – YOLL (Years of Life Lost)** Life years lost PM 555,500 744,600
Chronic Mortality – deaths** Premature deaths PM 60,700 81,400
Infant Mortality (0-1yr) Premature deaths PM 82 100
Chronic Bronchitis (27yr +) Cases PM 28,700 38,500
Respiratory Hospital Admissions (All ages) Cases PM 9,500 12,800
Cardiac Hospital Admissions (All ages) Cases PM 5,900 7,900
Restricted Activity Days (15-64yr) Days PM 50,038,200 67,013,700
Respiratory medication use (children 5-14yr) Days PM 451,400 608,400
Respiratory medication use (adults 20yr +) Days PM 4,696,100 6,288,200
Lower Respiratory Symptom (LRS) days (child 5-14yr) Days PM 20,012,200 26,962,800
LRS among adults (15yr +) with chronic symptoms Days PM 46,706,100 62,566,700
*) Results for acute mortality effects of ozone are slightly different to those generated by the RAINS model, as RAINS keeps population constant at 2000 levels and the CBA
model factors in population change to 2020. Differences in terms of estimated benefit between current legislation and the Strategy are, however, small.
**) Two alternative metrics are used for the presentation of chronic mortality from PM. Firstly in terms of years of life lost and secondly in terms of numbers of premature
deaths. These are not additive.
5AEAT/ ED48763001/Thematic Strategy. Issue 1
Health impact assessment - discussion
Ozone concentrations: In the CAFE baseline, annual impacts across the EU 25 are estimated
at 21,000 deaths brought forward in the year 20205. However, ozone also leads to much larger
numbers of estimated morbidity health impacts, with tens of millions of minor restricted
activity days and respiratory medication use days each year. These are clearly less serious
effects at the level of the affected individual, but they affect a much greater number of people.
The Strategy is estimated to reduce the total impacts from ozone on health, for example, by
1,600 avoided deaths brought forward. A similar level of benefits is predicted for respiratory
hospital admissions. For other morbidity endpoints, the benefits are greater in terms of
numbers of cases. For example, the Strategy is estimated to reduce the incidence of
respiratory medication use by 1.5 million days and of minor restricted activity by 3 million
days.
PM concentrations: Annual impacts across the EU 25 in the CAFE baseline in 2020 are
estimated at 2.5 million years of life lost each year. This can also be expressed as 272,000
estimated premature deaths. These results are consistent with the RAINS model, though
RAINS calculates the total (not annual) change in life years. Anthropogenic PM2.5 exposure
also leads to an estimated 350 premature deaths each year amongst infants aged between 1
month and 1 year. The estimated morbidity effects of PM2.5 in 2020 range from 68,000
hospital admissions to much larger numbers of less serious effects, for example 20 million
respiratory medication use days, and several hundred million restricted activity days.
The Strategy is estimated to reduce the total mortality impacts in the adult population from
PM2.5 exposure by 556,000 years of life lost each year (61,000 avoided premature deaths).
Additional to this, we estimate that 80 deaths amongst infants aged from 1 month to 1 year
would be avoided. For morbidity, it is estimated that the Strategy would lead to reductions of
15,000 hospital admissions, 5 million cases of respiratory medication use, and tens of millions
of restricted activity days.
5
The estimates of acute mortality due to ozone are in this analysis somewhat different from those reported by the
RAINS model. This is due to the fact that in the analysis carried out for 2020, we use the age distribution of the
population as of 2020, whereas RAINS uses 2000 data. Thus, the effects of ozone on mortality are more up-to-
date in this report. However, the difference of the CBA and RAINS analysis between CLE and the Strategy is
small.
6AEAT/ ED48763001/Thematic Strategy. Issue 1
Summary Results – Health Valuation
The health impacts and benefits outlined above have been expressed in monetary terms, using
the approach outlined in the CAFE CBA methodology (Holland et al, 2004a; Hurley et al,
2004).
The results are shown in Table 6. All values are for the EU25. This presents the total damage
with baseline pollution concentrations in 2020. It also shows the total damage for the
Strategy and the MTFR scenario.
Table 7 shows the change in damage, i.e. the benefits, of the Strategy and the MTFR over the
2020 baseline. It is estimated that the annual health benefits of the Strategy will range from
€42 billion to €135 billion/year in 2020.
7AEAT/ ED48763001/Thematic Strategy. Issue 1
Table 5. Estimated values of annual damage to health in EU25 in 2020 (€ million).
End Point Name Current Legislation in 2020 the Strategy MTFR
Acute Mortality (VOLY median)* O3 1085 1002 933
Acute Mortality (VOLY mean)* O3 2435 2250 2093
Respiratory Hospital Admissions (65yr +) O3 40 37 35
Minor Restricted Activity Days (MRADs 15-64yr) O3 1629 1506 1402
Respiratory medication use (children 5-14yr) O3 12 11 10
Respiratory medication use (adults 20yr +) O3 8 7 7
Cough and LRS (children 0-14yr) O3 2508 2318 2159
Chronic Mortality – VOLY – low (median)** PM 129,000 99,959 90,073
Chronic Mortality – VOLY – high (mean)** PM 289,556 224,370 202,180
Chronic Mortality – VSL – low (median)** PM 265,965 206,465 186,285
Chronic Mortality – VSL – high (mean)** PM 547,200 424,784 383,265
Infant Mortality (0-1yr) – low (median) PM 495 383 345
Infant Mortality (0-1yr) – high (mean) PM 990 765 689
Chronic Bronchitis (27yr +) PM 24,011 18,619 16,792
Respiratory Hospital Admissions (All ages) PM 85 66 59
Cardiac Hospital Admissions (All ages) PM 52 41 37
Restricted Activity Days (RADs 15-64yr) PM 18,515 14,342 12,926
Respiratory medication use (children 5-14yr) PM 2 1 1
Respiratory medication use (adults 20yr +) PM 20 15 14
LRS symptom days (children 5-14yr) PM 3,413 2,645 2,378
LRS among adults (15yr +) with chronic symptoms PM 7,974 6,180 5,570
Total with Mortality – VOLY – low (median)** 188,849 147,131 132,741
Total with Mortality – VOLY – high (mean)** 351,250 273,172 246,352
Total with Mortality – VSL – low (median)** 325,814 253,637 228,953
Total with Mortality – VSL – high (mean)** 608,894 473,586 427,437
*) For acute mortality (O3), two alternative values are presented, based on a range reflecting the median and mean values for VOLY from the NewExt study.
**) For chronic mortality (PM), four alternative values are presented, based on quantification using years of life lost (using the median and mean YOLL value from NewExt) and numbers of
premature deaths (using the median and mean VSL value from NewExt) . These are not additive.
8AEAT/ ED48763001/Thematic Strategy. Issue 1
Table 6. Estimated values of annual health benefits over the CAFE baseline (Current Legislation) in the EU25 in 2020 (€ million).
End Point Name the Strategy MTFR
Acute Mortality (VOLY median)* O3 83 152
Acute Mortality (VOLY mean)* O3 186 342
Respiratory Hospital Admissions (65yr +) O3 3 6
Minor Restricted Activity Days (MRADs 15-64yr) O3 124 228
Respiratory medication use (children 5-14yr) O3 1 2
Respiratory medication use (adults 20yr +) O3 1 1
Cough and LRS (children 0-14yr) O3 189 349
Chronic Mortality – VOLY – low (median)** PM 29,041 38,927
Chronic Mortality – VOLY – high (mean)** PM 65,186 87,377
Chronic Mortality – VSL – low (median)** PM 59,500 79,680
Chronic Mortality – VSL – high (mean)** PM 122,416 163,935
Infant Mortality (0-1yr) – low (median) PM 112 150
Infant Mortality (0-1yr) – high *mean) PM 224 300
Chronic Bronchitis (27yr +) PM 5,392 7,219
Respiratory Hospital Admissions (All ages) PM 19 26
Cardiac Hospital Admissions (All ages) PM 12 16
Restricted Activity Days (RADs 15-64yr) PM 4,173 5,589
Respiratory medication use (children 5-14yr) PM 0 1
Respiratory medication use (adults 20yr +) PM 4 6
LRS symptom days (children 5-14yr) PM 769 1,036
LRS among adults (15yr +) with chronic symptoms PM 1,794 2,404
Total with Mortality – VOLY – low (median)** 41,717 56,112
Total with Mortality – VOLY – high (mean)** 78,077 104,902
Total with Mortality – VSL – low (median)** 72,176 96,865
Total with Mortality – VSL – high (mean)** 135,307 181,460
*) For acute mortality (O3), two alternative values are presented, based on a range reflecting the median and mean values for VOLY from the NewExt study.
**) For chronic mortality (PM), four alternative values are presented, based on quantification using years of life lost (using the median and mean YOLL value from NewExt) and numbers of
premature deaths (using the median and mean VSL value from NewExt) . These are not additive.
9AEAT/ ED48763001/Thematic Strategy. Issue 1
Non-Health Impacts
Crops
The approach used for assessing damage to crops was summarised in the methodology
section earlier and also in the methodology report, volume 1. Account has been taken of the
work of ICP Vegetation, though it is noted that they express concerns about the use (as here)
of AOT40 as a metric for crop damage assessment. Analysis will shift to flux based methods
as soon as these become available.
Table 7 presents the total crop yield loss from ozone exposure for the EU25 with baseline
ozone pollution concentrations in 2020, and with the Strategy and MTFR. The total annual
damage in the year 2020 is estimated at just above €1.5 billion/year– with estimated annual
benefits of €0.3 billion/year for moving to the emission levels of the Strategy.
Table 7. Estimated annual crop damage due to ozone in the EU25 in 2020 under
Current Legislation, the Strategy and the MTFR (€Million)
Total damage per year in the EU25 in 2020
Current Legislation the Strategy MTFR
1511 1179 997
Annual benefits in 2020
Current Legislation the Strategy MTFR
0 332 514
Note: Benefits are calculated as the difference between the Strategy and MTFR over baseline.
The analysis of crop damage shows that these effects are small in economic terms in relation
to health effects overall (i.e. including PM2.5 effects), though effects from ozone on crops are
similar in magnitude to ozone related health damage.
Materials
Like the crops analysis, the approach used for assessing damage to materials was summarised
in the methodology section earlier and also in the methodology report, volume 1. Account
has been taken of the work of ICP Materials.
Table 8 presents the total material damage from acid deposition to utilitarian applications for
the EU25 with baseline ozone pollution concentrations in 2020, and with the different
ambition levels. The total damage in the year 2020 are estimated at just under
€0.74 billion/year– with estimated benefits of the Strategy at €0.19 billion/year above the
baseline.
10AEAT/ ED48763001/Thematic Strategy. Issue 1
Table 8. Estimated annual damage to materials used in utilitarian applications from
acid deposition in 2020 in the EU25 under Current Legislation, the Strategy and the
MTFR (€ million).
Total Damage per Year in the EU25 in 2020.
Current legislation the Strategy MTFR
740 550 460
Benefits in 2020
Current legislation the Strategy MTFR
0 190 280
Note: Benefits are calculated as the difference between the Strategy and MTFR over baseline.
Ecosystems
The results provided in this section were generated by the RAINS model and are presented
also in the report on the Thematic Strategy from IIASA (Amann et al, 2005b). The
information is repeated here in the interests of completeness, though some additional notes
are provided to assist with interpretation of the data.
Excess nitrogen deposition
There are several mechanisms whereby excess nitrogen deposition to ecosystems can lead to
ecological change.
The first of these, acidification, is dealt with below.
The second mechanism is one of nutrient enrichment of nutrient poor habitats leading to
eutrophication. Nitrogen (N) is generally the element that is most often limiting to plant
growth. As a result, the availability of N has been a significant evolutionary force on plants
and is a major determinant of the distribution of different plant species thus influencing plant
biodiversity negatively and ultimately also the overall biodiversity. A third mechanism
concerns nutrient imbalance (e.g., de Vries et al, 2002), where an excess input of N leads to a
deficiency of macronutrients such as K, P and Mg. Nutrient imbalance may lead to an
increased sensitivity to frost, drought and parasitic attack.
The extent of exceedance of critical loads for N across the EU25 is summarised in Table 9
and Figure 1. It is immediately clear that exceedance of critical loads for eutrophication is
widespread. The total area forecast for exceedance in 2020 (590,000 km2) is equivalent to
the combined area of France and Belgium. Under the Strategy there is significant
improvement, though the area subject to exceedance is still large. Improvements over time
are gradual, mainly as a result of the small differences in emission of ammonia. The results
presented here are supported by field monitoring (see WGE, 2004). Further to this, it should
be recognised that these effects will not be equally spread across all types of ecosystem, but
will instead be far more serious for some than for others.
11AEAT/ ED48763001/Thematic Strategy. Issue 1
Table 9. Percent of ecosystems area with nitrogen deposition above the critical loads for
eutrophication. Results calculated for 1997 meteorology, using grid-average deposition.
Critical loads data base of 2004. The shading highlights countries where the area
subject to exceedance is 50% or more than total ecosystem area (black) or between 25%
and 49% of total ecosystem area (grey).
2000 2020 2020 2020
Ecosystems area Current the Strategy MTFR 2)
(km2) 1) legislation
Austria 35563 96% 86% 77% 53%
Belgium 6615 93% 61% 37% 23%
Cyprus 4806 48% 64% 49% 13%
Czech Rep. 18364 95% 77% 39% 12%
Denmark 3031 53% 37% 11% 1%
Estonia 24326 12% 6% 4% 0%
Finland 238698 25% 14% 6% 0%
France 179227 96% 79% 57% 20%
Germany 106908 96% 94% 92% 86%
Greece 13714 76% 73% 52% 2%
Hungary 10763 31% 24% 16% 5%
Ireland 8791 12% 3% 0% 0%
Italy 119679 62% 48% 29% 13%
Latvia 29982 54% 38% 15% 0%
Lithuania 13182 85% 81% 62% 4%
Luxembourg 935 96% 82% 56% 40%
Malta3)
Netherlands 3244 67% 61% 51% 27%
Poland 91265 86% 79% 65% 18%
Portugal 11053 30% 12% 1% 0%
Slovakia 18213 89% 60% 30% 4%
Slovenia 4249 94% 88% 75% 21%
Spain 84278 65% 50% 32% 7%
Sweden 184369 26% 16% 8% 1%
UK 73791 13% 5% 1% 0%
EU25 1285046 57% 46% 33% 15%
Source: Amann et al (2005)
1
) Ecosystems area for which critical loads data have been supplied
2
) Maximum technically feasible emission reductions assumed for all European countries (including non-EU
countries)
3
) Data for Malta are not available
12AEAT/ ED48763001/Thematic Strategy. Issue 1
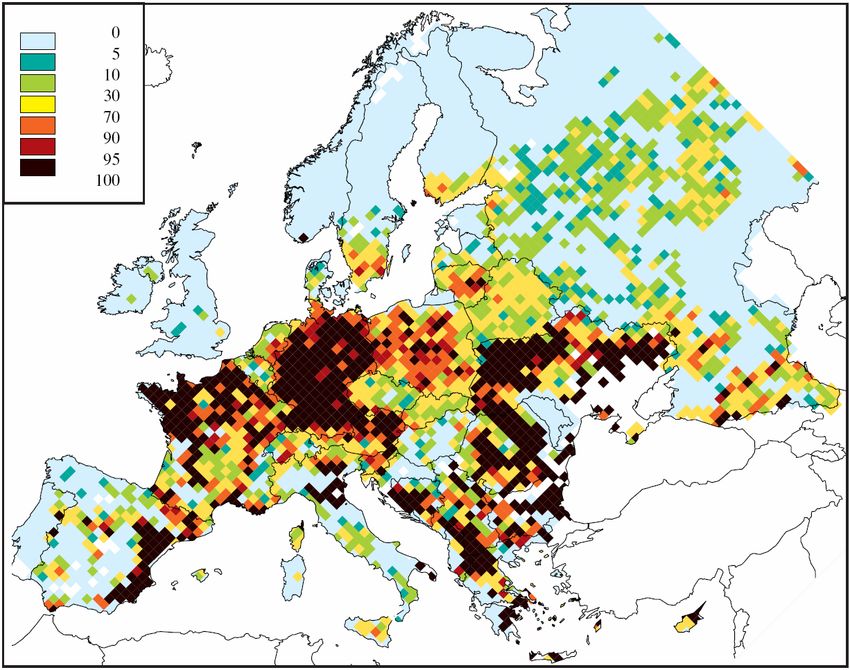
Figure 1. Percentage of total ecosystems area receiving nitrogen deposition above the
critical loads for eutrophication for the year 2020; current legislation baseline (top
graph) and the Strategy (bottom graph). Calculations are based on meteorological
conditions of 1997 using grid-average deposition. The report by Amann et al (2005b),
from which these figures were taken, provides further maps.
13AEAT/ ED48763001/Thematic Strategy. Issue 1
Acid deposition to forest ecosystems
Table 10 and Figure 2 show results for the Strategy and the MTFR scenario for the exceedance
of the critical load for acidity to forests. The RAINS model estimates that in the year 2000 more
than 20% of European forests, or almost 250,000 km2 (an area equivalent to that of the UK)
received acid deposition above their critical loads. The emission reductions that are already
agreed in the ‘current legislation’ should reduce this by the year 2020 to approximately
120,000 km2. With its environmental objectives, the Strategy would bring this area below
67,000 km2. The worst affected country in terms of % area affected is the Netherlands, by some
considerable distance.
Table 10. Percent of forest area with acid deposition above the critical loads for
acidification. Results calculated for 1997 meteorology, using ecosystem-specific
deposition. Critical loads data base of 2004. The shading highlights countries where the
area subject to exceedance is 50% or more than total ecosystem area (black) or between
25% and 49% of total ecosystem area (grey).
2000 2020 2020 2020
Ecosystems area Current the Strategy MTFR 2)
(km2) 1) legislation
Austria 34573 15.2% 4.7% 2.5% 0.5%
Belgium 6526 55.4% 25.2% 16.3% 13.3%
Cyprus 1854 0.0% 0.0% 0.0% 0.0%
Czech Rep. 18344 80.8% 29.9% 10.2% 1.8%
Denmark 3009 31.8% 5.7% 1.5% 0.3%
Estonia 21252 0.3% 0.0% 0.0% 0.0%
Finland 236139 1.6% 0.9% 0.8% 0.4%
France 168823 12.4% 4.2% 2.6% 0.7%
Germany 103113 72.3% 43.0% 25.3% 12.9%
Greece 13714 0.6% 0.0% 0.0% 0.0%
Hungary 10763 3.9% 1.1% 0.4% 0.0%
Ireland 4166 47.0% 23.0% 17.7% 9.1%
Italy 92577 2.3% 0.7% 0.3% 0.3%
Latvia 28941 0.6% 0.5% 0.0% 0.0%
Lithuania 12438 2.9% 1.0% 0.4% 0.0%
Luxembourg 934 35.1% 13.7% 1.8% 0.0%
Malta3)
Netherlands 3778 88.3% 80.6% 71.1% 52.3%
Poland 88281 59.0% 19.7% 1.1% 0.2%
Portugal 11053 2.6% 0.5% 0.2% 0.0%
Slovakia 18211 22.7% 6.9% 3.1% 0.4%
Slovenia 4190 2.8% 0.0% 0.0% 0.0%
Spain 84269 1.0% 0.0% 0.0% 0.0%
Sweden 180911 23.7% 15.3% 12.8% 8.4%
UK 19822 49.0% 23.4% 12.4% 6.0%
EU25 1167682 20.8% 10.2% 5.7% 3.1%
Source: Amann et al (2005b)
1
) Ecosystems area for which critical loads data have been supplied
2
) Maximum technically feasible emission reductions assumed for all European countries (including non-EU
countries)
3
) Data for Malta are not available
14AEAT/ ED48763001/Thematic Strategy. Issue 1
Figure 2. Percentage of forest area receiving acid deposition above the critical loads for
the year 2020 current legislation baseline (top graph) and the Strategy (bottom graph).
Calculations are based on meteorological conditions of 1997 using ecosystem specific
deposition. Source: Amann et al (2005b).
15AEAT/ ED48763001/Thematic Strategy. Issue 1
Acid deposition to semi-natural ecosystems
A number of countries have provided estimates of critical loads for so-called “semi-natural”
ecosystems. This group typically contains nature and landscape protection areas, many of
them designated as “Natura2000” areas of the EU Habitat directive.
Results in Table 11 and Figure 3 demonstrate the scale of the problem in aggregate terms for
each country. As in other parts of this section, however, the aggregate data provide only
limited guidance on the scale of the problem, given that different types of ecosystem will be
affected to very differing extents. This reflects differences in deposition patterns at finer
scales than can be investigated in the current analysis, and variation in the sensitivity of
ecosystems. Results are not complete (given the number of countries not represented, and the
limited area considered in some countries for which data are available), and for this reason,
the information on area exceeded in km2 is not provided. The most robust guidance provided
by the results probably concerns the trends observed. However, exceedance in Germany and
the Netherlands remains relatively high in both countries.
Table 11. Percent of the area of semi-natural ecosystems considered by the RAINS
model with acid deposition above the critical loads for acidification. 1997 meteorology,
ecosystem-specific deposition. The shading highlights countries where the area subject
to exceedance is 50% or more than total area of semi-natural ecosystem (black) or
between 25% and 49% of total area of semi-natural ecosystem (grey).
2000 2020 2020 2020
Ecosystems area Current the Strategy MTFR 2)
(km2) 1) legislation
France 10014 37.6% 9.0% 2.5% 0.6%
Germany 3946 68.1% 40.9% 25.1% 11.3%
Ireland 4609 10.3% 2.3% 1.0% 0.4%
Italy 26085 0.0% 0.0% 0.0% 0.0%
Netherlands 1296 63.0% 47.8% 26.7% 17.8%
UK 49700 30.8% 9.3% 4.0% 1.3%
Source: Amann et al (2005b)
1
) Ecosystems area for which critical loads data have been supplied
2
) Maximum technically feasible emission reductions assumed for all European countries (including non-EU
countries)
16AEAT/ ED48763001/Thematic Strategy. Issue 1
Figure 3. Percentage of the area of semi-natural ecosystems receiving acid deposition
above the critical loads for the year 2020 current legislation baseline (top graph) and the
Strategy (bottom graph). Calculations are based on meteorological conditions of 1997
using ecosystem specific deposition. Source: Amann et al (2005b).
17AEAT/ ED48763001/Thematic Strategy. Issue 1
Acid deposition to freshwater bodies
The effects of acidification on freshwater ecosystems are better understood than impacts on
terrestrial ecosystems. The impact of greatest public concern has been the loss of game fish
(salmon and trout) from rivers and lakes in acid sensitive areas, particularly in northern
Europe, though this is linked to other ecological changes also. Reductions in acidifying
emissions are starting to show benefits in terms of ecosystem recovery (WGE, 2004).
Improvements are not uniform, however, and recovery will take some time, first for water
chemistry to stabilise and improve, and then for biological recovery.
Table 12. Percent of catchments area with acid deposition above the critical loads for
acidification. Results calculated for 1997 meteorology, using grid-average deposition.
Critical loads data base of 2004.
2000 2020 2020 2020
Ecosystems area Current the Strategy MTFR 2)
(km2) 1) legislation
Finland 30886 0.7% 0.7% 0.6% 0.2%
Sweden 204069 14.9% 10.5% 9.0% 5.2%
UK 7757 8.1% 3.7% 2.3% 1.3%
Source: Amann et al (2005b)
1
) Ecosystems area for which critical loads data have been supplied
2
) Maximum technically feasible emission reductions assumed for all European countries (including non-EU
countries)
18AEAT/ ED48763001/Thematic Strategy. Issue 1
Figure 4. Percentage of freshwater ecosystems area receiving acid deposition above the
critical loads for the year 2020 current legislation baseline (top graph) and the Strategy
(bottom graph). Calculations are based on meteorological conditions of 1997 using grid-
average deposition. Source: Amann et al (2005b).
19AEAT/ ED48763001/Thematic Strategy. Issue 1
Impacts on forests from ground-level ozone
For the CAFE baseline projection, the forest area where critical levels are exceeded is
estimated to decline from 61% of the European forests in 2000 to 56% in the year 2020
(Table 13). The table also demonstrates a sharp division between countries with respect to
the extent of critical levels exceedance.
Table 13. Percent of forest area where the critical levels for ozone are exceeded. Results
calculated for 1997 meteorology. The shading highlights countries where the area
subject to exceedance is 50% or more than total ecosystem area (black) or between 25%
and 49% of total ecosystem area (grey).
2000 2020
Ecosystems area Current the Strategy MTFR 2)
2 1)
(km ) legislation
Austria 37211 100% 100% 100% 41%
Belgium 5964 100% 100% 100% 100%
Cyprus 1116 100% 100% 100% 11%
Czech Rep. 25255 100% 100% 100% 14%
Denmark 2807 99% 89% 89% 18%
Estonia 18420 0% 0% 0% 0%
Finland 207003 0% 0% 0% 0%
France 137329 100% 100% 93% 61%
Germany 104559 100% 100% 100% 80%
Greece 21854 100% 100% 99% 23%
Hungary 16451 100% 100% 100% 0%
Ireland 2464 99% 19% 6% 0%
Italy 79743 100% 100% 100% 99%
Latvia 25101 6% 0% 0% 0%
Lithuania 18901 38% 3% 2% 0%
Luxembourg 1054 100% 100% 100% 100%
Malta 3 100% 100% 100% 100%
Netherlands 2912 100% 100% 99% 98%
Poland 89100 100% 95% 65% 0%
Portugal 27336 100% 100% 93% 32%
Slovakia 20144 100% 100% 69% 0%
Slovenia 10724 100% 100% 100% 17%
Spain 104595 100% 100% 100% 55%
Sweden 273144 18% 4% 1% 0%
UK 14557 85% 50% 43% 25%
EU25 1247749 61% 56% 52% 28%
Source: Amann et al (2005b)
1
) Ecosystems area for which critical loads data have been supplied
2
) Maximum technically feasible emission reductions assumed for all European countries (including non-EU
countries)
Aggregating the indicators for forest effects
The analysis carried out in the RAINS model does not permit the total ecosystem area subject
to exceedance of one or more critical load/level for acidification, eutrophication and ozone to
be calculated. However, given that the ozone results for forests indicate extremely high
exceedance in most countries and close to zero exceedance in a few cases, it is possible to use
the aggregated national data to estimate the area of forest subject to exceedance of both the
critical load for eutrophication or acidification and the critical level for ozone. These results
are useful as they demonstrate the extent to which forests are subject to more than one
pollutant stress (Table 14).
20AEAT/ ED48763001/Thematic Strategy. Issue 1
Table 14. Summary statistics for the EU25 showing area of forest subject to exceedance
of the critical level for ozone, critical loads for eutrophication and acidification, and
combined exceedances of ozone and acidification and ozone and eutrophication. Black
and grey shading highlights cases where exceedance covers >50% and 25 to 50% of
forest area.
2000 Current Legislation the Strategy MTFR
in 2020
Ozone 61% 56% 52% 28%
Acidification 21% 10% 6% 3%
Eutrophication 57% 46% 33% 15%
Ozone + acidification 16% 6% 3% 1%
Ozone + eutrophication 47% 35% 28% 9%
Table 15 repeats the analysis, but excludes Estonia, Finland, Latvia, Lithuania and Sweden as
exceedance of the critical level for ozone in these countries is close to zero. It is seen that
summary results for the European Union outside of these countries are substantially more
severe than when they are included.
Table 15. As Table 14, but excluding the Baltic countries (Estonia, Finland, Latvia,
Lithuania and Sweden).
2000 Current Legislation the Strategy MTFR
in 2020
Ozone 99.7% 98% 91% 50%
Acidification 28% 13% 6% 3%
Eutrophication 80% 68% 52% 26%
Ozone + acidification 27% 11% 5% 2%
Ozone + eutrophication 80% 68% 48% 15%
21AEAT/ ED48763001/Thematic Strategy. Issue 1
Initial Comparison of Costs and Benefits
The information in the previous sections on benefits has been compared against the
annualised costs of the scenarios, as estimated by the RAINS model. This is referred to as
the ‘initial comparison of costs and benefits’, as no account is taken at this stage of
uncertainty in estimates of either cost or benefit. The annualised costs from RAINS are
shown in Table 16 and the annual monetized benefits are shown in Table 17. The monetized
health benefits over total costs are shown in Table 18. Data are also presented graphically in
Figure 5 to Figure 10.
Table 16. Annualised Costs in Million € in 2020 - change over base line, including road
transport measures for the Strategy and the MTFR.
the Strategy MTFR
Austria 95 1403
Belgium 298 981
Cyprus 9 80
Czech Rep. 172 614
Denmark 86 800
Estonia 15 158
Finland 63 1088
France 1177 7787
Germany 1401 4340
Greece 74 1000
Hungary 144 567
Ireland 94 707
Italy 692 3412
Latvia 14 137
Lithuania 48 433
Luxembourg 19 51
Malta 3 20
Netherlands 328 979
Poland 633 3787
Portugal 153 1457
Slovakia 68 367
Slovenia 29 187
Spain 688 4449
Sweden 71 1567
UK 776 3349
EU-25 7149 39720
Source: Amann et al 2005b
22AEAT/ ED48763001/Thematic Strategy. Issue 1
Table 17. Health benefits (€million) for the Strategy and MTFR over the Current
Legislation baseline in 2020.
Health benefit for the Strategy Health benefit for the MTFR
LOW HIGH LOW HIGH
(VOLY median) (VSL mean) (VOLY median) (VSL mean)
Austria 659 2070 974 3056
Belgium 1417 4495 1935 6127
Cyprus 6 14 10 24
Czech Rep. 1181 3931 1513 5026
Denmark 313 1068 501 1706
Estonia 27 100 49 181
Finland 41 130 127 407
France 5872 17384 8399 24830
Germany 10198 35273 12975 44777
Greece 304 1112 472 1715
Hungary 1426 5307 1754 6516
Ireland 186 478 278 712
Italy 4319 16100 5970 22175
Latvia 96 251 157 413
Lithuania 102 488 165 787
Luxembourg 79 189 105 252
Malta 12 36 18 53
Netherlands 2517 7623 3296 9968
Poland 3911 12243 5031 15723
Portugal 462 1574 706 2396
Slovakia 676 2065 874 2662
Slovenia 180 610 257 867
Spain 1626 5310 2290 7462
Sweden 207 656 482 1532
UK 5902 16800 7772 22089
EU-25 41717 135307 56109 181457
Note for acute mortality (O3), two alternative values are presented, based on a range reflecting the median and mean values
for VOLY from the NewExt study. For chronic mortality (PM), four alternative values are presented, based on
quantification using years of life lost (using the median and mean YOLL value from NewExt) and numbers of premature
deaths (using the median and mean VSL value from NewExt) . These are not additive. The numbers above show the low
and high estimates.
The ratio of benefits to costs (combining the above tables) is presented below. A ratio > 1
indicates that benefits are greater than costs (i.e. there are net benefits). Note the numbers are
presented for health benefits only.
23You can also read