Removal of Paracetamol Using Effective Advanced Oxidation Processes - MDPI
←
→
Page content transcription
If your browser does not render page correctly, please read the page content below
International Journal of
           Environmental Research
           and Public Health

Article
Removal of Paracetamol Using Effective Advanced
Oxidation Processes
Francesca Audino 1 , Jorge Mario Toro Santamaria 2 , Luis J. del Valle Mendoza 3 ,
Moisès Graells 1 and Montserrat Pérez-Moya 1, *
 1    Center for Process and Environmental Engineering CEPIMA, Chemical Engineering Department, Universitat
      Politècnica de Catalunya, Escola d’Enginyeria de Barcelona Est (EEBE), Av. Eduard Maristany 16, 08019
      Barcelona, Spain; francesca.audino@upc.edu (F.A.); moises.graells@upc.edu (M.G.)
 2    Institute for Interfacial Engineering and Biotechnology, Fraunhofer, Nobelstrasse 12, 70569 Stuttgart,
      Germany; jorge.toro@igb.fraunhofer.de
 3    Barcelona Research Center in Multiscale Science and Engineering, Chemical Engineering Department,
      Universitat Politècnica de Catalunya, Escola d’Enginyeria de Barcelona Est (EEBE),
      Av. Eduard Maristany 16, 08019 Barcelona, Spain; luis.javier.del.valle@upc.edu
 *    Correspondence: montserrat.perez-moya@upc.edu

 Received: 30 November 2018; Accepted: 30 January 2019; Published: 11 February 2019

 Abstract: Fenton, photo-Fenton, and photo-induced oxidation, were investigated and compared
 for the treatment of 0.26 mmol L−1 of paracetamol (PCT) in a deionised water matrix, during
 a reaction span of 120.0 min. Low and high Fenton reagent loads were studied. Particularly, the initial
 concentration of Fe2+ was varied between 0.09 and 0.18 mmol L−1 while the initial concentration
 of H2 O2 was varied between 2.78 and 11.12 mmol L−1 . The quantitative performance of these
 treatments was evaluated by: (i) measuring PCT concentration; (ii) measuring and modelling TOC
 conversion, as a means characterizing sample mineralization; and (iii) measuring cytotoxicity to
 assess the safe application of each treatment. In all cases, organic matter mineralization was always
 partial, but PCT concentration fell below the detection limit within 2.5 and 20.0 min. The adopted
 semi-empirical model revealed that photo induced oxidation is the only treatment attaining total
 organic matter mineralization (ξMAX = 100% in 200.0 min) at the expense of the lowest kinetic
 constant (k = 0.007 min−1 ). Conversely, photo-Fenton treatment using high Fenton reagent loads gave
 a compromise solution (ξMAX = 73% and k = 0.032 min−1 ). Finally, cytotoxicity assays proved the safe
 application of photo-induced oxidation and of photo-Fenton treatments using high concentrations of
 Fenton reagents.

 Keywords: photo-induced oxidation; Fenton; photo-Fenton; hydrogen peroxide dosage; kinetic
 model; cytotoxicity; paracetamol; by-products

1. Introduction
     The increasing sensitivity of analytical instruments has allowed the detection of a growing number
of new organic substances in wastewater, natural water and groundwater. Particularly, special attention
has recently been paid to Contaminants of Emerging Concern (CECs) a group of chemicals including
pharmaceuticals and personal care products that resist treatment by conventional wastewater treatment
plants (WWTPs) and accordingly require alternative and more effective treatment processes.
     Several studies have reported the presence of persistent pharmaceuticals in effluents from
conventional WWTPs and in surface waters affected by such effluents [1–5]. Other studies have
reported the presence of pharmaceuticals also in groundwaters, the major source of drinking waters [6].
     Advanced Oxidation Processes (AOPs) have been widely investigated as a promising and effective
alternative for the removal of such Contaminants of Emerging Concern (CECs).

Int. J. Environ. Res. Public Health 2019, 16, 505; doi:10.3390/ijerph16030505   www.mdpi.com/journal/ijerph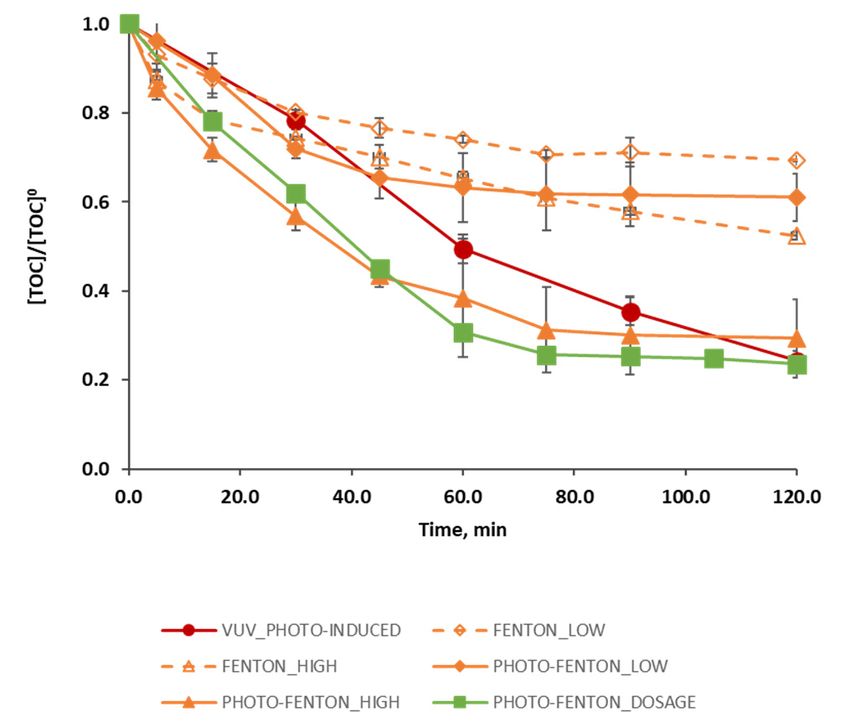
Int. J. Environ. Res. Public Health 2019, 16, 505                                                  2 of 17

      Particularly, several studies have addressed the use of photo-Fenton process for the
removal of microcontaminants [7] and the treatment of several kinds of industrial wastewaters
(e.g., pharmaceuticals, olive-oil, cork, dye, pesticides wastewaters) with a high organic content [8].
The photo-Fenton process has attracted widespread attention in the scientific community because of the
possibility of using solar light for its activation but also because it can be combined with conventional
and cheaper biological processes to develop innovative, efficient and cost effective treatments [9].
      The photo-Fenton process results from the photo-induced enhancement of the Fenton process.
The Fenton process [10] occurs by means of the addition of hydrogen peroxide to Fe2+ salts (see
Equations (1–3)) while the photo-Fenton process occurs by the additional use of UV-VIS light irradiation
at wavelength higher than 300 nm [11,12], which produces the photolysis of Fe3+ complexes and
subsequently causes a faster Fe2+ regeneration (see Equation (4)):

                                           Fe2+ + H2 O2 → Fe3+ + HO− + HO•                            (1)

                                             Fe3+ + H2 O2 ↔ FeOOH2+ + H+                              (2)

                                                    FeOOH2+ → Fe2+ + HO2 •                            (3)
                                                             hv
                                                    Fe(OH)2+ → Fe2+ + HO•                             (4)

     The extensive experimental work dedicated in the last decades to the understanding of the
photo-Fenton process has revealed the importance of the Fenton reagent ratio (H2 O2 :Fe2+ ) as one of
the most significant factors for the enhancement of its performance [13].
     Furthermore, several studies [14–16] have also shown the importance of developing an efficient
hydrogen peroxide dosage strategy aimed at avoiding or limiting the activation of inefficient reactions
scavenging hydrogen peroxide:

                                                H2 O2 + HO• → HO2 • + H2 O                            (5)

     Photochemical AOPs, as the photo-Fenton process, are processes that use UV/VIS radiation as
a means to generate hydroxyl radicals in presence of oxidants and/or photo-catalysts. However,
hydroxyl radicals can also be generated by photolysing water using the higher energies of the vacuum
ultraviolet or VUV (λ < 190nm); in such a case, the process is known as VUV photo-induced oxidation.
     A literature review reveals the great potential of VUV photo-induced oxidation for achieving the
oxidation and mineralization of organic pollutants. Particularly, relevant studies have investigated
the use of VUV photo-induced oxidation for the treatment of solvents (e.g., 1,1,1-trichloroethane)
in concentrations between 1.00 and 24.90 mg L−1 [17]; of phenols (e.g., 2,4-diclorophenol) in
concentrations in the order of 100.00 mg L−1 [17–19]; and also the treatment of organic contaminants
such as 3-amino-5-methylisoxazole [20] and 1,2-dichloroethene [17] in concentrations of 49.00 and
20.00 mg L−1 , respectively.
     The photochemical reaction known as homolysis of water is shown in Equation (6):

                                                       hv
                                                H2 O → HO• +H• + H+ + eaq
                                                                       −
                                                                                                      (6)

      The chemical bond dissociation leads to the formation of H+ , H• , hydrated electrons eaq
                                                                                              − , and the

main reactive and non-selective species that is the HO• radical.
      The VUV photo-induced technology is an interesting alternative to other AOPs as well as
a solution suitable to be combined with conventional treatments due to several advantages such as:
(i) no requirement of chemical additives, (ii) completely unselective oxidation, (iii) high light-energy
density, and (vi) flexibility as scalable process.
      The present study investigates the performance of different AOPs (Fenton, photo-Fenton and
VUV photo-induced oxidation) in the degradation of paracetamol (PCT) in aqueous solution.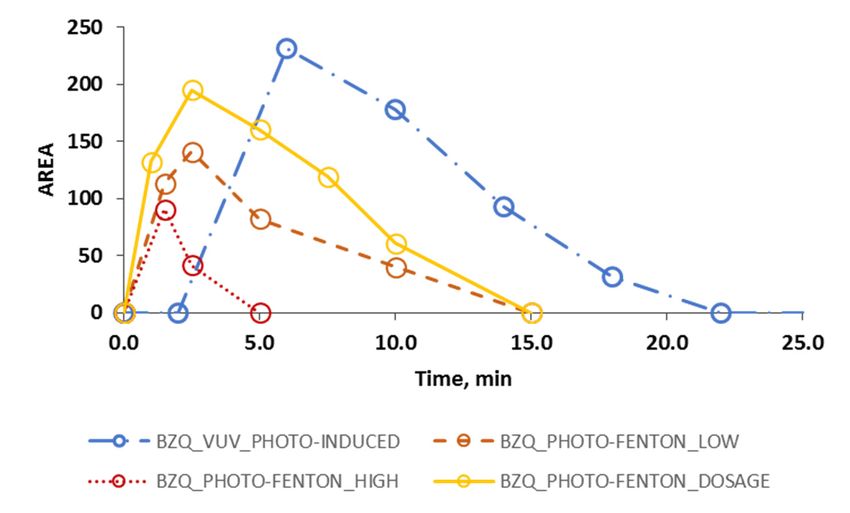
Int. J. Environ. Res. Public Health 2019, 16, 505                                                 3 of 17

       The quantitative performance of the AOPs was addressed by:
I.        Measuring the evolution of PCT concentration, aimed at estimating the time at which PCT
          concentration decays below a threshold (HPLC limit detection),
II.       Measuring and modelling, following a semi-empirical modeling approach, the Total
          Organic Carbon (TOC) conversion, aimed at estimating and comparing the limits of
          sample mineralization,
III.      Measuring cytotoxicity at planned intervals (trading-off the effort of this analysis and the
          information produced), aimed at determining the real environmental outcome of the treatment.
     Paracetamol was selected as model contaminant because it is one of the most frequently prescribed
analgesics and antipyretics worldwide. It has been detected in concentrations up to 11.30 µg L−1
in European WWTPs effluents [3,5,21–24] but also in natural waters in concentrations greater than
65.00 µg L−1 in the Tyne River, UK [5,25].
     In all cases, the initial concentration of the target compound was fixed to 0.26 mmol L−1 (40.00 mg
L−1 ) corresponding and to an initial TOC concentration of 2.16 mmol L−1 (25.92 mg L−1 ), which is a
value higher than that of the concentrations observed in wastewaters and surface waters [3,5,21–23].
This higher concentration was fixed with the aim of simulating the treatment of a real-wastewater
characterized by higher PCT concentrations, as also studied by other authors. For example, a recent
study [26] addressed the Fenton treatment of a paracetamol wastewater of a pharmaceutical industry
characterized by a PCT concentration between 37.00 and 294.00 mg L−1 . Finally, this value also
simplifies the monitoring of PCT and TOC concentrations along the treatment span.
     In all cases, deionised water was set as the water matrix in order to study the pure and specific
degradation of paracetamol and its by-products, as well as their effect on the toxicity evolution.
This also prevents the interference of other organic substances that are present in a real wastewater
matrix with an uncertain composition.
     In the case of Fenton and photo-Fenton processes, the effects of Fenton reagents (H2 O2 and Fe2+ )
and the effects of H2 O2 dosage were also analyzed for further insight and discussion. Especially, low
(2.78 mmol L−1 of H2 O2 and 0.09 mmol L−1 of Fe2+ –94.50 mg L−1 and 5.00 mg L−1 respectively)
and high (11.12 mmol L−1 of H2 O2 and 0.18 mmol L−1 of Fe2+ –378.00 mg L−1 , and 10.00 mg L−1
respectively) concentrations of the Fenton reactants were studied.
     Besides, an additional, illustrative photo-Fenton experiment based on a dosage strategy of the
oxidant was performed. This additional experiment was aimed at comparing the performance
of the VUV photo-induced and the photo-Fenton process. Indeed, the dosage of the oxidant led
to a continuous generation of the HO• radicals as in the case of VUV photo-induced oxidation
experiments. On the contrary, in the case of a photo-Fenton experiment without H2 O2 dosage, the
generation of HO• radicals occurs mostly at the beginning of the assay.

2. Materials and Methods

2.1. Reagents and Chemicals
      Paracetamol (PCT) 98% purity purchased from Sigma-Aldrich (St. Louis, MO, USA) was used as
target compound. Reagent-grade hydrogen peroxide (H2 O2 ) 33% w/v from Panreac Química SLU
(Barcelona, Spain) and iron sulfate (FeSO4 ·7H2 O) from Merck (Kenilworth, NJ, USA), adopted as the
ferrous ion (Fe2+ ) source, were used as Fenton reagents. HPLC gradient grade methanol, MeOH,
purchased from J.T. Baker Inc. (Phillipsburg, NJ, USA)) and filtered milli Q grade water were used
as HPLC mobile phases. High purity (>99%) ascorbic acid from Riedel de Haën (Seelze, Germany)),
0.2% 1,10-phenanthroline from Scharlab SL (Barcelona, Spain), sodium acetate anhydrous and 95–98%
sulfuric acid, both from Panreac Química SLU (Barcelona, Spain), were used to perform measurements
of iron species. Hydrogen chloride HCl 37% from J.T. Baker Inc. (Phillipsburg, NJ, USA) was used to
adjust the initial pH. Deionised water with a conductivity lower than 1.25 µs was provided by Adesco
S.A. (Barcelona, Spain) and was used as water matrix in all experiments.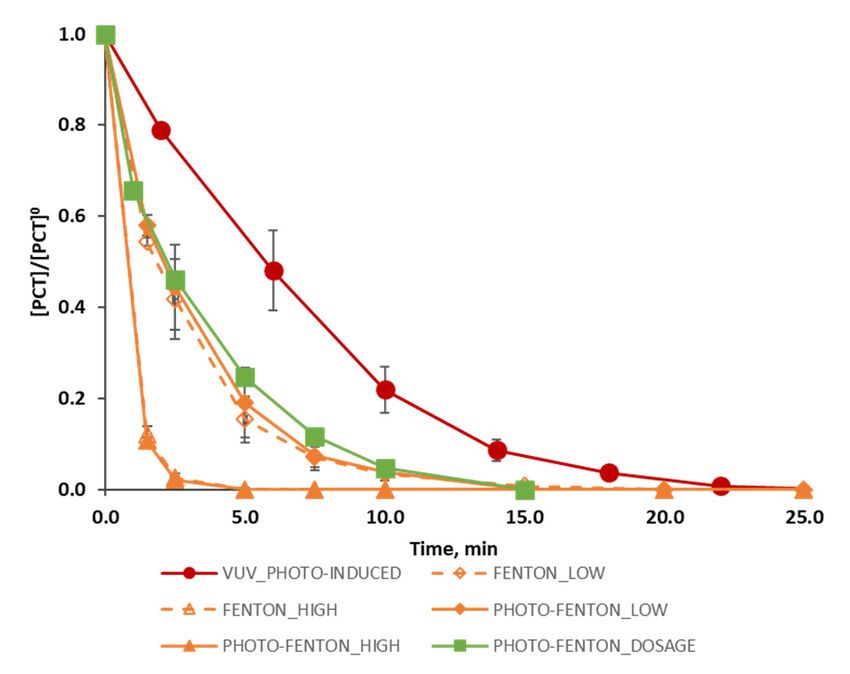
Int. J. Environ. Res. Public Health 2019, 16, 505                                                         4 of 17

      Dulbecco’s Modified Eagle Medium (DMEM), Phosphate-Buffered Saline (PBS) and
foetal bovine serum (FBS) purchased from Gibco®(Thermo Fisher Scientific, Madrid, Spain),
(3-(4,5-dimethyl-2-thiazolyl)-2,5-diphenyl-2H-tetrazolium bromide (MTT) and dimethyl sulfoxide
(DMSO) reagents purchased from Sigma-Aldrich were used to perform cytotoxicity assays using cell
line cultures.

2.2. Experimental

2.2.1. Experimental Design, Analytical Determinations, Pilot Plants
     The Fenton, photo-Fenton and VUV photo-induced assays were all performed in batch mode
with recirculation and fixing the reaction time to 120.0 min for the treatment of a PCT water solution
with an initial concentration of [PCT]0 = 0.26 mmol L−1 corresponding to an initial TOC concentration
of [TOC]0 = 2.16 mmol L−1 .The experiments summarized in Table 1 were set up and performed.
Particularly, the design of experiments was composed of:

I.        a set of preliminary blank experiments for Fenton (dark conditions, or rather with an irradiated
          volume VIRR = 0.0 L) and photo-Fenton (irradiated conditions, or rather with an irradiated
          volume VIRR = 1.5 L) processes, investigating the role of the oxidant under dark (BLANK_1)
          and irradiated (BLANK_3) conditions, the role of the catalyst under dark (BLANK_2) and
          irradiated (BLANK_4) conditions, and the direct photolysis of the PCT molecule (BLANK_5);
II.       a set of Fenton experiments based on the use of low (FENTON_LOW) and high
          (FENTON_HIGH) concentrations of the Fenton reagents;
III.      a set of photo-Fenton experiments based on the use of low (PHOTO-FENTON_LOW) and
          high (PHOTO-FENTON_HIGH) concentrations of the Fenton reagents;
IV.       a photo-induced oxidation experiment (VUV_PHOTO INDUCED)

       Table 1. Design of experiments performed for an initial PCT concentration of [PCT]0 = 0.26 mmol L−1
       corresponding to an initial TOC concentration of [TOC]0 = 2.16 mmol L−1 .

                                      [H2 O2 ]0      [Fe2+ ]0                  T          λ        VIRR
           Experiments                                            pH          ◦C
                                     mmol L−1       mmol L−1                             nm         L
             BLANK_1                    11.12         0.00      2.8 ± 0.2   28.0 ± 2   300–420      0.0
             BLANK_2                    0.00          0.18      2.8 ± 0.2   28.0 ± 2   300–420      0.0
             BLANK_3                    11.12         0.00      2.8 ± 0.2   28.0 ± 2   300–420      1.5
             BLANK_4                    0.00          0.18      2.8 ± 0.2   28.0 ± 2   300–420      1.5
             BLANK_5                     0.00         0.00      2.8 ± 0.2   28.0 ± 2   300–420      1.5
         FENTON_LOW                      2.78         0.09      2.8 ± 0.2   28.0 ± 2   300–420      0.0
         FENTON_HIGH                    11.12         0.18      2.8 ± 0.2   28.0 ± 2   300–420      0.0
       PHOTO-FENTON_LOW                  2.78         0.09      2.8 ± 0.2   28.0 ± 2   300–420      1.5
       PHOTO-FENTON_HIGH                11.12         0.18      2.8 ± 0.2   28.0 ± 2   300–420      1.5
           VUV_PHOTO
                                         0.00         0.00      5.0 ± 0.2   25.0 ± 2     172     1.1 × 10⁻³
            INDUCED

     The maximum initial concentration of Fe2+ was set to the maximum legal value in wastewaters in
Spain [27]. The initial concentration of H2 O2 was changed between half (low doses) and twice (high
doses) the stoichiometric value (5.56 mmol L−1 ) required for the total mineralization of 0.26 mmol L−1
of PCT, considering H2 O2 as the only oxidant in the media (Equation (7)):

                               C8 H9 NO2 + 21H2 O2 → 8CO2 + 25H2 O + H+ + NO3−                                (7)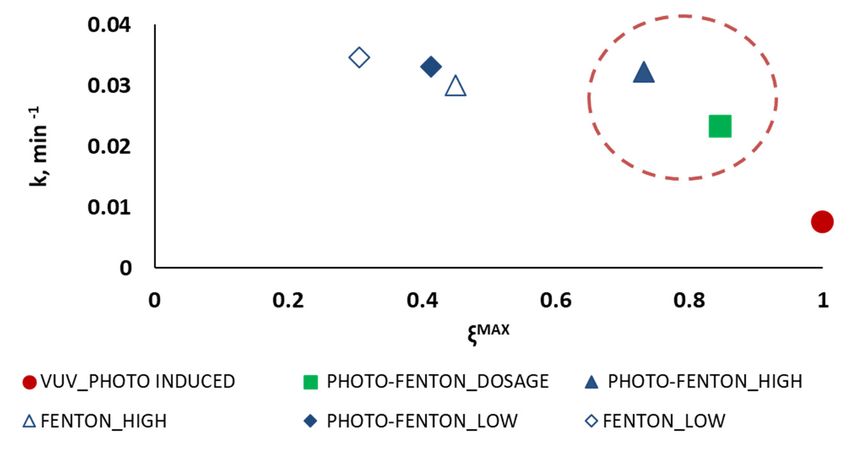
Int. J. Environ. Res. Public Health 2019, 16, 505                                                       5 of 17

     An additional illustrative photo-Fenton experiment including H2 O2 dosage was also performed
(coded as PHOTO-FENTON_DOSAGE).
     In this case, the initial concentration of PCT was fixed to 0.26 mmol L−1 and the initial
concentration of ferrous ion was set to 0.18 mmol L−1 . The total amount of hydrogen peroxide
to be added during the experiment ([H2 O2 ]TOT ) was fixed to 11.12 mmol L−1 in order to evaluate the
effect of a high dose of the oxidant. Particularly, an initial amount of 4.0 mL of hydrogen peroxide
(2.58| mmol L−1 ) was added at the beginning of the assay. Then, 5.0 ml (3.24 mmol L−1 ) were added
during the first 5.0 min (corresponding to a flowrate of 1.0 ml min−1 ) while 8.0 mL (5.18 mmol L−1 )
were added during the following 55.0 min (corresponding to a flowrate of 0.2 ml min−1 ). Hence,
the total dosage time was 60.0 min.
     Regarding the experimental protocol followed to perform Fenton and photo-Fenton assays, the
glass reservoir was first filled with 10.0 L of deionised water. After 10.0 min of recirculation, 4.9 L of
deionised water in which PCT was previously dissolved were added and were recirculated during
15.0 min with the aim of ensuring a good homogenization of the matrix. After that, a sample was
taken to measure the initial concentrations of TOC and PCT ([TOC]0 , [PCT]0 ). Once pH was adjusted
to 2.8±0.2, the remaining 0.1 L of deionised water, in which Fe2+ was previously dissolved, were
poured into the reactor and, after 10.0 min of recirculation, a sample was taken to measure the initial
concentrations of the iron species ([Fe2+ ]0 , [Fe3+ ]0 , [FeTOT ]0 ). For the photo-Fenton experiments, H2 O2
was added 10.0 min after the light was switched on in order to ensure the lamp to stabilize.
     Contrariwise, the VUV_PHOTO-INDUCED experimental protocol consisted in filling the four
tank reservoirs with 2.0-L of deionised water in which PCT had been previously dissolved (initial
pH = 5.0 ± 0.5). Then, after 15.0 min of recirculation and homogenization, a sample was taken so to
measure [TOC]0 and [PCT]0 , and the Xenon Excimer Flat Lamps were switched on in order to start
the assay.
     During Fenton and photo-Fenton experiments, pH was continuously monitored and it resulted
to lay in the range pH = 2.8 ± 0.2, which is the range defined by [28] as the range ensuring the use
of the iron as a catalyst or rather, ensuring the reduction of Fe3+ to Fe2+ (Fenton-like reaction) at an
appreciable rate [29] and avoiding its precipitation. Temperature was also continuously monitored
and checked to lay in the range T = 28.0 ± 2.0 ◦ C. On the other hand, performing the photo-induced
experiments required no pH adjustment; after the addition of PCT, pH naturally remained in the
5.0 ± 0.5 range. Temperature remained at a value of 25.0 ± 2.0 ◦ C.
     Concentration measurements of PCT, by-products (BPs), Total Organic Carbon (TOC), H2 O2 and
iron species (Fe2+ , Fe3+ , FeTOT ) were carried out during the experiments. The PCT and by-products
concentrations ([PCT], [BPs]) were determined using an HPLC Agilent 1200 series with UV-DAD
(Agilent Technologies, Santa Clara, CA, USA) and the samples were previously treated with methanol
(in proportion 50:50) in order to stop further degradation of the organic matter. The HPLC analysis
used an Akady 5 µm C-18 150×4.6 mm column maintained at 25 ◦ C as stationary phase and a mixture
of methanol:water (25:75) flowing at 0.4 mL min−1 as mobile phase. The diode array detector was set
at 243 nm.
     TOC concentration ([TOC]) was measured with a VCHS/CSN TOC analyzer (Shimadzu; Kyoto,
Japan). Samples were refrigerated after extraction in order to slow down any further degradation of
the organic matter.
     Finally, during Fenton and photo-Fenton experiments, the concentrations of hydrogen
peroxide ([H2 O2 ]) and iron species ([Fe2+ ], [Fe3+ ], [FeTOT ]) were determined with a U-2001
UV-VIS spectrophotometer (Hitachi, Tokyo, Japan). Standard methods [30,31] were followed to
ensure the proper determination of oxidant and catalyst concentrations, respectively. Particularly,
the spectrophotometric technique [30] is based on the measurement of the absorption at 450 nm of
the complex formed after reaction of H2 O2 with ammonium metavanadate. The 1,10-phentranoline
method [31] used to analyze the evolution of iron species follows ISO 6332 and is based on the
absorbance measurements of the Fe2+ -phenantroline complex at 510 nm. Total iron concentration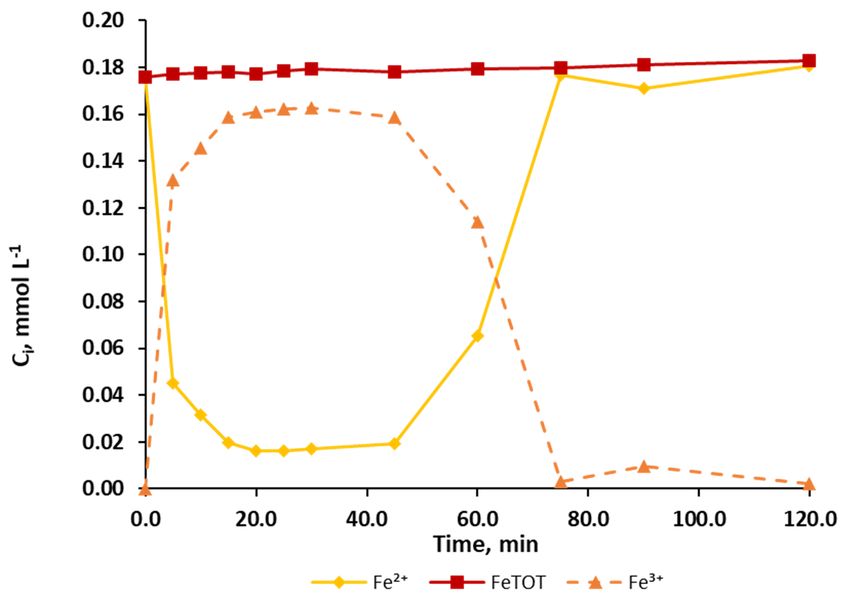
Int. J. Environ. Res. Public Health 2019, 16, 505                                                     6 of 17

 h       i
( FeTOT ) is measured using ascorbic acid to convert all ferric ions (Fe3+ ) to ferrous ions (Fe2+ ); then,
                                                                     h     i h       i h        i
ferric ion concentration is determined through the iron balance ( Fe3+ = FeTOT − Fe2+ ).
      Fenton and photo-Fenton assays were performed in a 15.0 L pilot plant composed by a glass
jacketed reservoir tank and a glass annular photo-reactor (Termo Fisher Scientific, Barcelona, Spain)
equipped with an Actinic BL TL-DK 36 W/10 1SL lamp (UVA-UVB) (Barcelona LED, Barcelona, Spain)
with an irradiated volume of 1.5 L. A pumping system allows keeping a constant recirculation flow of
12 L min−1 , which ensures perfect mixing. The incident photon power, E = 3.4 × 10⁻⁴ Einstein min−1
(300 and 420 nm), was measured by [32] using potassium ferrioxalate actinometry [33]. Continuous pH
and temperature measurements are given by on-line sensing equipment, while a flowmeter ensures
the on-line control of the recirculation flow rate. The pilot-plant is also equipped with four peristaltic
pumps controlled by a PLC system connected to a SCADA system allowing reactants dosage during
the experiments. For more specifications, please refer to [32,34]. Photo-induced oxidation experiments
were performed in a pilot plant equipped with four Flat Lamp reactor systems, each containing a Xenon
Excimer Flat Lamp emitting VUV at 172 nm and connected to a 2.0-L jacketed glassware reservoir tank.
A magnetically coupled centrifugal pump Sondermann BGR 1.5 (Sondermann, Köln, Germany) is used
to control the flow-rate that can be varied between 4.2 and 0.8 L min−1 . The irradiated volume (VIRR )
is given by the product of the lamp surface (310.0 cm2 ) for the effective absorbing path (3.6 × 10⁻³ cm)
resulting in a value of 1.1 cm3 or rather 1.1 × 10⁻³ L. Hence, the photochemical reaction (see Equation
(6)) only takes place in a volume that corresponds to the 0.056% of the total volume of 2.0 L. This
pilot plant was developed at the Institute for Interfacial Engineering and Biotechnology (Fraunhofer,
Germany) and for more information please refer to [35].

2.2.2. Toxicity tests
      The safe application of the treatments under study for the removal of PCT was also investigated.
Toxicity tests based on the use of specific bacteria (E. coli and S. aureus bacteria) were performed and all
the studied AOPs resulted to be environmentally friendly. The results agree the observations reported
by other authors who tested the toxicity of the produced effluents on the Vibrio Fishery bacteria [36].
      Hence, a system with a sensitivity higher than the one based on the use of specific bacteria was
selected with the purpose of addressing a more general case study. In particular, the cytotoxicity tests
based on cell lines culture were carried out. Particularly, VERO and COS-1 cells were selected and
tested. Both cell lines were isolated from an African green monkey kidney [37] but their morphology
is different. The morphology of VERO cells corresponds to epithelial-like cells while the morphology
of COS-1 cells corresponds to fibroblast-like cells (ATCC® , Manassas, VA, USA).
      The cells were cultured in a DMEM medium (supplemented with 100.00 U/mL penicillin,
100.00 µg mL−1 streptomycin and 10%-v/v FBS at 37.0 ◦ C) and a wet atmosphere containing 5%
CO2 and 95% air. In order to allow the formation of monolayers, VERO and COS-1 cells were seeded
in culture plates of 96 wells 24 h before performing the assay. Cells with viability greater than 95%
were seeded at a density of 104 cells/well.
      Aqueous samples of PCT were taken before, during and after the treatment by Fenton,
photo-Fenton and VUV photo-induced AOP and were evaluated at serial one-third dilutions.
Specifically, 150.0 µL of each PCT dilution and 150.0 µL of culture medium were added to each
well in order to obtain 300.0 µL on the cell monolayer in each well. In all cases, the pH of the samples
was adjusted to 7.2–7.4.
      Additionally, two controls were performed: (i) a control of maximum cell growth achieved
culturing the cells in medium alone (300.0 µL of culture medium) and (ii) a control to evaluate the
effect of the aqueous dilution of the medium achieved by adding 150.0 µL of water and 150.0 µL of
culture medium. Then, the plates were incubated for 24 h under culture conditions. The samples were
evaluated in triplicate on independent plates.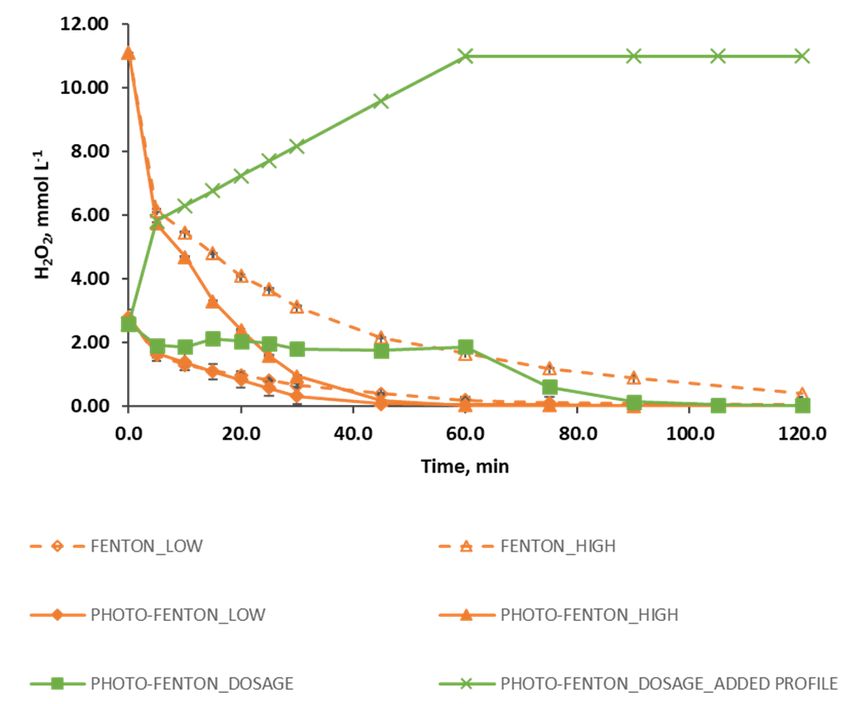
Int. J. Environ. Res. Public Health 2019, 16, 505                                                   7 of 17

     Cytotoxicity was assessed by measuring the viability of the cells exposed to PCT and possible
by-products. The viability was determined by the MTT method. First, after 24.0 h of culture,
the media were aspirated and plates were washed with PBS (100.0 µL/well). Then, 50.0 µL of culture
medium supplemented with 5.00 mg mL−1 MTT reagent were added to each well. The plates were
incubated for 3.0 h in culture conditions to allow the formation of formazan crystals in the viable cells.
The quantification was performed solubilizing the formazan crystals in a DMSO/methanol/water
mixture (20/70/10%-v) using 100.0 µL/well, and the absorbance at 570 nm was measured with
a microplate reader (Biochrom, Cambridge, UK).

2.3. Modelling
      The semi-empirical model by [38] summarized in Equations (8–12), has been adopted in order to
rate the progress of the degradation of organic matter through a lumped parameter such as the TOC.
      The term “semi-empirical” refers to a model that represents a balanced approach between detailed
first-principles modeling and pure empirical modeling (e.g., response surface). On one hand this
model describes the degradation of the model contaminant by measuring a lumped parameter such as
the concentration of total organic carbon. On the other hand, the model has been expressed in terms of
physically meaningful factors with the aim of overcoming the limitations of pure statistical modeling.
      Especially, the model describes the degradation as follows:

                                              d[TOC]
                                                     = −k([TOC] − [TOC]∞ )                             (8)
                                                dt

where k is a kinetic constant (min−1 ) and [TOC]∞ represents the limit concentration (mmol L−1 ) from
which, regardless the reaction time, and under specific conditions, further degradation of the organic
matter cannot be attained.
    By integrating the Equation (8), the analytical expression of the TOC evolution under given initial
conditions can be derived and results in:

                                      [TOC] = [TOC]∞ + k([TOC]0 − [TOC]∞ )e−kt                         (9)

where [TOC]0 represents the initial TOC concentration (mmol L−1 ).
    TOC evolution in Equation (9) can be also expressed in terms of conversion (ξ) as follows:

                                                    ξ = ξMAX 1 − e−kt                                (10)

                                                            [TOC]0 −[TOC]
                                                       ξ=      [TOC]0                                (11)
                                                              [TOC]0 −[TOC]∞
                                                    ξMAX =        [TOC]0                             (12)

    Hence, this allows characterizing the process performance by determining two parameters: the
maximum conversion ξMAX and the kinetic constant k. For more details, please refer to [38].

3. Results and Discussion

3.1. Fenton, Photo-Fenton and VUV Photo-Induced Assays
    Concerning Fenton and photo-Fenton processes, results of the preliminary blank assays (not
shown) revealed that, when disregarding first the catalyst and then the oxidant, PCT and TOC
remained almost constant, and that the adopted UV radiation (300–420 nm) was not able to appreciably
photolyze PCT.
    Before starting analyzing the processes performance in terms of TOC and PCT evolution, the
evolution of iron species is presented for Fenton and photo-Fenton experiments (see Figure 1).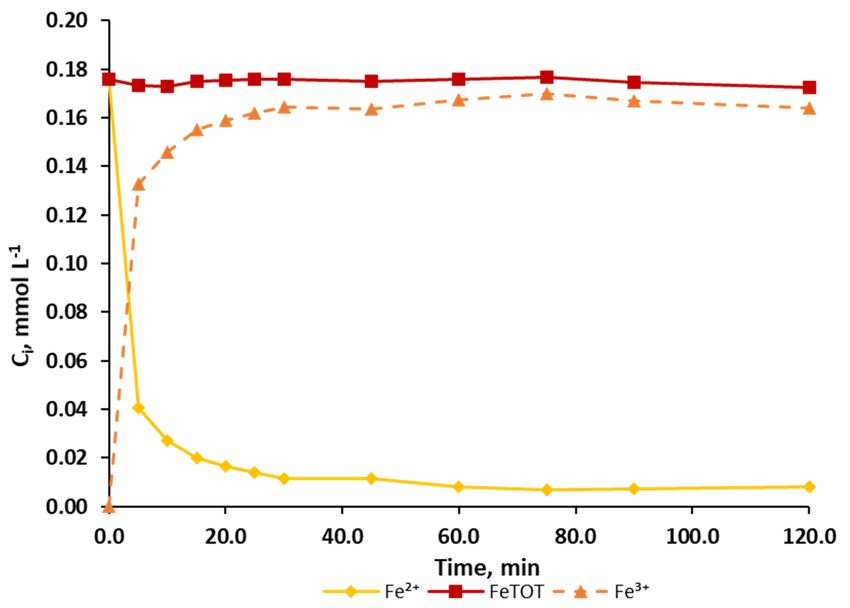
Int. J. Environ. Res. Public Health 2019, 16, 505                                                       8 of 17

          Particularly, Figure 1 shows the evolution of the concentrations of Fe2+ , Fe3+ and total iron in the case
          of FENTON_HIGH
Int. J. Environ.                     (Figure
                 Res. Public Health 2019, 16, x 1a) and PHOTO-FENTON_HIGH (Figure 1b) experiments. 8 of 16

                                                                                                       (a)

                                                                                                       (b)

            Figure 1. Evolution of the measured concentration of Fe2+ (♦,) and total iron (,) represented by a
            continuous line and of the calculated concentration of Fe3+ (∆,N), represented by a dashed line, during
      Figure 1. Evolution of the measured concentration of Fe2+ (◊,♦) and total iron (□,■) represented
            (a) Fenton (empty symbols) and (b) photo-Fenton (solid symbols ) experiments performed with high
      by a continuous line and of the calculated concentration of Fe3+ (∆,▲), represented by a dashed
            concentrations of the Fenton reagents.
      line, during a) Fenton (empty symbols) and b) photo-Fenton (solid symbols ) experiments
      performed
            Duringwith high
                        the concentrations
                              first minutes of the of
                                                   Fenton
                                                       thereagents.
                                                              reaction, both cases (FENTON_HIGH and
       PHOTO-FENTON_HIGH) show a fast increase of Fe3+ concentration together with a fast
     During the first      minutes of the reaction, both cases (FENTON_HIGH and PHOTO-
       decrease of Fe2+ concentration. In the 3+FENTON_HIGH (Figure 1a), Fe3+ and Fe2+ concentrations
FENTON_HIGH) show a fast increase of Fe concentration                  together with a fast decrease of Fe2+
       reach stable values around 0.17 mmol L−1 3+and 0.012+ mmol L−1 , respectively. Conversely,
concentration. In the FENTON_HIGH (Figure 1a), Fe and Fe concentrations reach stable values
       the PHOTO-FENTON_HIGH case (Figure 1b) presents a different behavior. After 45.0 min,
around 0.17 mmol L−1 and 0.01 mmol L−1, respectively. Conversely, the PHOTO-FENTON_HIGH                case
      when hydrogen peroxide is depleted (see Figure 2c), the concentration of Fe3+ decreases while the
(Figure 1b) presents a different   behavior. After 45.0 min, when hydrogen peroxide is depleted (see
       concentration of Fe2+ increases up to a value of about 0.17 mmol L−1 . Hence, Fe2+ becomes the main
Figure 2c), the concentration of Fe3+ decreases while the concentration of Fe2+ increases up to a value
       iron species in solution.
of about 0.17 mmol L−1. Hence, Fe2+ becomes the main iron species in solution.
     This different behavior can be explained by analyzing the Fenton and photo-Fenton kinetics
together with the different hydrogen peroxide evolution. In the Fenton case, the fastest reaction is the
Fenton reaction (Equation (1)), which generates Fe3+ from Fe2+ with a kinetic constant in a range of 63.0
76.0 mol L−1 s−1 [39]. On the other hand, the only reaction generating Fe2+ (Equation (3)) has a kinetic
constant in the range of 1.0 × 10⁻² 2.0 × 10⁻² mol L−1 s−1 [39]. In the PHOTO-FENTON_HIGH case, unlike
the FENTON_HIGH case, for which H2O2 concentration never drops to zero, the concentration of H2O2
reaches a null value. As a consequence, the Fenton reaction (Equation (1)) is no longer effective unless
further Fe2+ is supplied (Equation (3) and Equation (4)). The generation of Fe2+ is here particularly
Finally, constant total iron concentration can be ensured because all the experiments were
performed under a pH range (2.8±0.2) that prevents its precipitation, which is in accordance with the
remarks reported by other authors [28,29] and which was experimentally confirmed as well.
Subsequently, with the aim of discussing the performance of the different treatments studied, Figures
2 (a, b, and
Int.c)J. presents results
Environ. Res. Public in terms
Health the
2019, 16,evolution
505 of PCT and TOC (normalized concentrations) and 9 of 17
H2O2 (mmol L ), the latter, in the case of Fenton and photo-Fenton assays, with and without H2O2 dosage.
−1
(a)
(b)
Int. J. Environ. Res. Public Health 2019, 16, x 10 of 16
(c)
Figure 2. Evolution
Figure 2. Evolution of the degradation
of the degradation of a) PCTof (a) PCT (normalized
(normalized values), b)values), (b) TOC (normalized
TOC (normalized values) values)
and (c) H O (concentration, mmol L −1 ) for different process: photo induced advanced oxidation (•);
and c) H2O2 (concentration, mmol L ) for different process: photo induced advanced oxidation (●);
2 2 −1
Fenton,
Fenton, using using
low and low
high and high concentrations
concentrations of Fenton
of Fenton reagents (◊,∆);reagents (♦,∆); using
photo-Fenton photo-Fenton using low and
low and high
high concentrations of Fenton reagents ( , N ); and photo-Fenton process
concentrations of Fenton reagents (♦,▲); and photo-Fenton process following a H2O2 dosage strategy following a H2 O2 dosage
(■). Figure 2c also(shows
strategy ). Figure
the2c also shows
profile of thethe profile
added of the added
hydrogen hydrogen
peroxide duringperoxide during
the reaction spanthe reaction
span (concentration values, mmol L −1 ). The error bars display the standard deviation for the set of
(concentration values, mmol L ). The error bars display the standard deviation for the set of three
−1
three experiments.
experiments.
Figure 2a allows concluding that all the treatments efficiently removed PCT. The model compound
was not detected by HPLC within a minimum time of 2.5 min and a maximum time of 20.0 min. PHOTO-
FENTON_LOW and PHOTO-FENTON_HIGH assays led to the best results: PCT concentrationInt. J. Environ. Res. Public Health 2019, 16, 505 10 of 17
This different behavior can be explained by analyzing the Fenton and photo-Fenton kinetics
together with the different hydrogen peroxide evolution. In the Fenton case, the fastest reaction
is the Fenton reaction (Equation (1)), which generates Fe3+ from Fe2+ with a kinetic constant in
a range of 63.0 ÷ 76.0 mol L−1 s−1 [39]. On the other hand, the only reaction generating Fe2+
(Equation (3)) has a kinetic constant in the range of 1.0 × 10⁻² ÷ 2.0 × 10⁻² mol L−1 s−1 [39].
In the PHOTO-FENTON_HIGH case, unlike the FENTON_HIGH case, for which H2 O2 concentration
never drops to zero, the concentration of H2 O2 reaches a null value. As a consequence, the Fenton
reaction (Equation (1)) is no longer effective unless further Fe2+ is supplied (Equations (3) and (4)).
The generation of Fe2+ is here particularly enhanced by the photo-Fenton reaction (Equation (4)) under
a convenient light source (quantum yields Φ = 0.21 ± 0.04 mol Einstein−1 ) [39]. Conversely, in the
PHOTO-FENTON_DOSAGE case, the change from Fe3+ to Fe2 was not observed (results not shown).
In this case, higher concentrations of Fenton reagents were used and, as a consequence, H2 O2 was
never depleted.
Finally, constant total iron concentration can be ensured because all the experiments were
performed under a pH range (2.8±0.2) that prevents its precipitation, which is in accordance with the
remarks reported by other authors [28,29] and which was experimentally confirmed as well.
Subsequently, with the aim of discussing the performance of the different treatments studied,
Figure 2a–c) presents results in terms the evolution of PCT and TOC (normalized concentrations)
and H2 O2 (mmol L−1 ), the latter, in the case of Fenton and photo-Fenton assays, with and without
H2 O2 dosage.
Figure 2a allows concluding that all the treatments efficiently removed PCT. The model
compound was not detected by HPLC within a minimum time of 2.5 min and a maximum
time of 20.0 min. PHOTO-FENTON_LOW and PHOTO-FENTON_HIGH assays led to the best
results: PCT concentration decayed beyond the HPLC detection limit in 2.5 min. Conversely,
the VUV_PHOTO-INDUCED produced a slightly slower decrease of the PCT during the time, and in
this case PCT concentration decayed below the HPLC detection limit in about 20.0 min.
It is worth noting that for all the studied treatments, TOC concentration after 20.0 min of reaction
(maximum time at which PCT is no longer detected) was lower than that established by wastewater
disposal regulations or than that required by a subsequent biological treatment. However, although
all the AOPs under study allowed the efficient removal of PCT, none of them attained the complete
mineralization of the organic matter within the 120.0 min reaction span.
Particularly, VUV_PHOTO-INDUCED and PHOTO-FENTON_DOSAGE experiments (Figure 2b)
obtained the best results in terms of final TOC conversion for the studied time span. In both
cases, a final TOC conversion of about 77% was attained, that is a 6% more if compared with the
final TOC conversion reached in the case of the PHOTO-FENTON_HIGH experiment (71%). It is
important to observe that such improvement was obtained also without the enhancement introduced
by a convenient dosage. Hence, even better results could be expected if H2 O2 dosage was approached
by systematic optimization [40]. Furthermore, the VUV_PHOTO-INDUCED case also indicates that
if the reaction time would had been extended (> 120.0 min), organic matter degradation would
have continued, and higher levels of mineralization would have been attained. Conversely, for the
PHOTO-FENTON_DOSAGE case study the TOC reached a stable value starting from a reaction
time of 75.0 min so showing that an increase in reaction time would not lead to an increase in
mineralization level.
This result is consistent with the hydrogen peroxide evolution observed during the experiment
(Figure 2c). As a matter of fact, Figure 2c reveals that when hydrogen peroxide dosage stops
(at 60.0 min), the concentration of H2 O2 in the reactor quickly drops to zero, thus determining the end
of the organic matter degradation.
The analysis of the experimental results solely in terms of PCT removal is not enough
for sensibly deciding one AOP out of the rest. For this reason, the semi-empirical model by
introduced in Section 2.3 [38] was adopted with the aim of aiding decision making. Such a modelInt. J. Environ. Res. Public Health 2019, 16, 505 11 of 17
Int. J. Environ. Res. Public Health 2019, 16, x 11 of 16
allows deriving the maximum conversion ξMAX and the kinetic constant k for each treatment,
and conveniently display them as means to describe the process performance. Thus, Figure 3
to describe the process performance. Thus, Figure 3 displays the kinetic constant ki as a function of the
displays the kinetic constant ki as a function of the maximum attainable conversion ξMAX ,
maximum attainable conversion ξ , with i= VUV_PHOTO-INDUCED, FENTON_LOW, i
with i = VUV_PHOTO-INDUCED, FENTON_LOW, FENTON_HIGH, PHOTO-FENTON_LOW,
FENTON_HIGH, PHOTO-FENTON_LOW, PHOTO-FENTON_HIGH, PHOTO-FENTON_DOSAGE.
PHOTO-FENTON_HIGH, PHOTO-FENTON_DOSAGE.
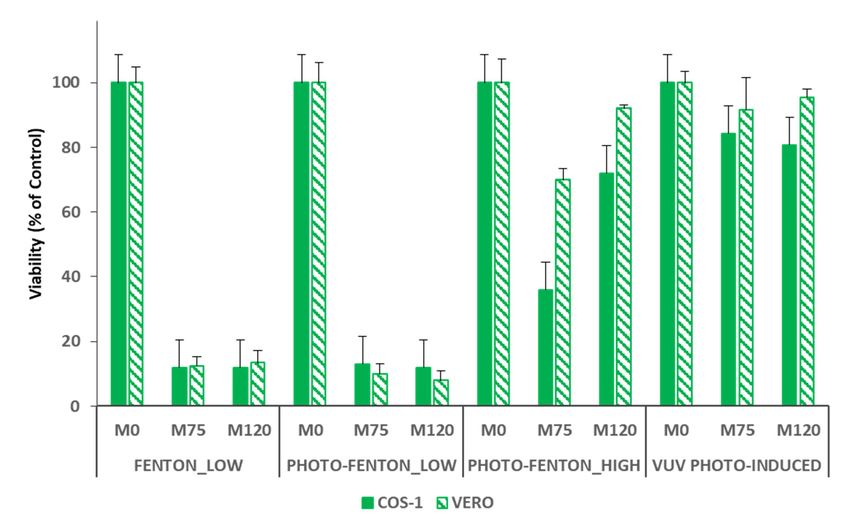
Figure 3. Reaction rate as a function of the maximum attainable conversion evaluated for photo
Figure 3. Reaction rate as a function of the maximum attainable conversion evaluated for photo
induced advanced oxidation process (•); Fenton (♦) and photo-Fenton () process without H2 O2
induced advanced oxidation process (●); Fenton (◊) and photo-Fenton (♦) process without H2O2
dosage using low concentrations of the Fenton reagents; Fenton (∆) and photo-Fenton (N) process
dosage using low concentrations of the Fenton reagents; Fenton (∆) and photo-Fenton (▲ ) process
without H2 O2 dosage using high concentrations of the Fenton reagents; and photo-Fenton process
without H2O2 dosage using high concentrations of the Fenton reagents; and photo-Fenton process
following a H2 O2 dosage strategy ().
following a H2O2 dosage strategy (■).
The results, as displayed in Figure 3, highlight that the photo induced advanced oxidation process
The one
is the only results,
thatas displayed
allows in Figure
attaining 3, highlight
the total organic that themineralization
matter photo induced(ξ advanced
MAX oxidation
= 100% process
in 200.0 min),is
theitonly
but is theone that allows
process with the attaining
lowestthe totalconstant
kinetic organic matter × 10−2 min−1().ξ The low
(k = 0.7mineralization =100%
rateinof200.0 min), but
this process
it is the process with the lowest kinetic constant (k=0.7 × 10 −2 min−1). The low rate of this process is a
is a consequence of the insufficient illuminated volume of the pilot plant (VIRR = 1.1 × 10 L), which − 3
consequence
suggests of the insufficient
that increasing this volumeilluminated
would led volume of the pilot
to increasing the plant (Vconstant
kinetic IRR=1.1 × 10⁻³ L), which suggests
and to reaching total
that increasing
mineralization this time.
in less volume would
On the led toFENTON_LOW
contrary, increasing the and kinetic constant and to reaching
PHOTO-FENTON_LOW show thetotal
mineralization in less time. On the
− 2 contrary, FENTON_LOW
− 2 − 1 and
highest kinetic constants (3.5 × 10 and 3.3 × 10 min , respectively) but only a 30% and a 41% PHOTO-FENTON_LOW show the
highest kinetic constants
TOC conversion, respectively. (3.5 × 10 −2 and 3.3 × 10⁻² min−1, respectively) but only a 30% and a 41% TOC
conversion,
The arearespectively.
highlighted in Figure 3 by a red dashed circle represents the area where the intermediate
solutionsThearearea highlighted
located. in Figurethe
Particularly, 3 by a red dashed circle represents
PHOTO-FENTON_HIGH the area where the intermediate
and PHOTO-FENTON_DOSAGE
solutions are
experiments canlocated. Particularly,
be considered the PHOTO-FENTON_HIGH
a compromise solution, since theyand allowPHOTO-FENTON_DOSAGE
reaching 73% and 84%
maximum TOC conversion with a kinetic constant of 3.2 × 10 and 2.3 × 10−273%
experiments can be considered a compromise solution, since they
− 2 allow reaching minand
−1 , 84% maximum
respectively.
TOC conversion with a kinetic constant of 3.2 × 10⁻² and 2.3 × 10⁻² min−1, respectively.
Thus, in order to solve the trade-off between TOC conversion and kinetics, toxicity tests are
Thus,toinprovide
considered order to solve the trade-off
complementary resultsbetween
for further TOC conversion
decision makingand kinetics,
support. toxicity
This tests are
is connected
considered to provide complementary results for further decision making
with the analysis of the by-products (BPs) generated during the treatments presented in Figure 4. support. This is connected
with Fortheall
analysis
the AOPs of theunder
by-products
study, (BPs)
HPLCgenerated
analysisduring
allowedthedetecting
treatmentstwo presented in Figure 4. that
main by-products
For all theasAOPs
were identified under study,
hydroquinone (HDQ) HPLC andanalysis allowed(BZQ)
benzoquinone detecting two main
(retention timeby-products
for HDQ = that were
7.0 min,
identified as hydroquinone (HDQ) and benzoquinone (BZQ) (retention time for HDQ=7.0 min,
retention time for BZQ = 10.0 min). Since Fenton and photo-Fenton experiments produced similar
retention time for BZQ=10.0 min). Since Fenton and photo-Fenton experiments produced similar
results in this regard, for the sake of simplicity Figure 4 only considers photo-Fenton, which gave
results in this regard, for the sake of simplicity Figure 4 only considers photo-Fenton, which gave just
just a slightly faster BPs degradation than that of the Fenton case. Besides, Figure 4 only presents the
a slightly faster BPs degradation than that of the Fenton case. Besides, Figure 4 only presents the
evolution of BZQ in order to allow a better display of the results.
evolution of BZQ in order to allow a better display of the results.
Figure 4 shows that a slightly faster decrease of BZQ was obtained by the
Figure 4 shows that a slightly faster decrease of BZQ was obtained by the PHOTO-FENTON_HIGH
PHOTO-FENTON_HIGH process compared to that of the FENTON_HIGH process:
process compared to that of the FENTON_HIGH process: particularly, BZQ was no longer detected after
particularly, BZQ was no longer detected after 5.0 and 15.0 min, respectively. Contrariwise,
5.0 and 15.0 min, respectively. Contrariwise, when PHOTO-FENTON_DOSAGE assay was performed,
when PHOTO-FENTON_DOSAGE assay was performed, BZQ was no longer detected after 15.0 min
BZQ was no longer detected after 15.0 min while, when VUV_PHOTO-INDUCED experiment was
while, when VUV_PHOTO-INDUCED experiment was performed, BZQ concentration decayed below
performed, BZQ concentration decayed below the HPLC detection limit in 22.0 min.
the HPLC detection limit in 22.0 min.Int. J. Environ. Res. Public Health 2019, 16, 505 12 of 17
Int. J. Environ. Res. Public Health 2019, 16, x 12 of 16
Figure 4. Evolution (HPLC AREA) of the degradation intermediate BZQ (#) during photo induced
Figure 4. Evolution (HPLC AREA) of the degradation intermediate BZQ (○) during photo induced
oxidation process (line and dots), photo-Fenton process using high (dotted line) and low (dashed line)
oxidation process (line and dots), photo-Fenton process using high (dotted line) and low (dashed line)
concentrations of the Fenton reactants and without dosing the hydrogen peroxide, and photo-Fenton
concentrations of the Fenton reactants and without dosing the hydrogen peroxide, and photo-Fenton
process following a H2 O2 dosage strategy (solid line).
process following a H2O2 dosage strategy (solid line).
It is worth noting that in the VUV_PHOTO-INDUCED case, the HO• radicals, which are
It is worth noting that in the VUV_PHOTO-INDUCED case, the HO• radicals, which are
responsible of the degradation of the organic matter, are formed only in the illuminated volume
responsible of the degradation of the organic matter, are formed only in the illuminated volume (1.1 ×
(1.1 × 10−3 L), which is also much lower than the illuminated volume of the Fenton/photo-Fenton
10−3L), which is also much lower than the illuminated volume of the Fenton/photo-Fenton pilot plant
pilot plant (1.5 L). Thus, increasing this volume would improve the kinetics of the process. Contrariwise,
(1.5 L). Thus, increasing this volume would improve the kinetics of the process. Contrariwise, the
the presence of Fenton reaction (see Equation (1)) in the Fenton and photo-Fenton process, ensures the
presence of Fenton reaction (see Equation (1)) in the Fenton and photo-Fenton process, ensures the
generation of HO• radicals in all the volume of the reactor (both dark and irradiated).
generation of HO• radicals in all the volume of the reactor (both dark and irradiated).
It is also important to remark that the detected by-products show coherence with the literature
It is also important to remark that the detected by-products show coherence with the literature
related to the Fenton and photo-Fenton degradation of PCT [36,41] and, in addition, the analytical
related to the Fenton and photo-Fenton degradation of PCT [36,41] and, in addition, the analytical results
results obtained in this work point that the same intermediates were generated during the
obtained in this work point that the same intermediates were generated during the photo-induced AOP.
photo-induced AOP.
Regarding Fenton and photo-Fenton experiments, another important factor is the presence of
Regarding Fenton and photo-Fenton experiments, another important factor is the presence of
chemical additives in high concentrations that allows a faster generation of HO• • radicals if compared
chemical additives in high concentrations that allows a faster generation of HO radicals if compared
with the VUV photo induced AOP. Actually, when hydrogen peroxide was dosed, and so when a
with the VUV photo induced AOP. Actually, when hydrogen peroxide was dosed, and so when a lower
lower concentration of H2O2 was present in the reactor at the beginning of the assay, the photo-Fenton
concentration of H2 O2 was present in the reactor at the beginning of the assay, the photo-Fenton
process performance in terms of TOC, PCT, and BPs evolution, approaches the performance recorded
process performance in terms of TOC, PCT, and BPs evolution, approaches the performance recorded
by the photo induced AOP.
by the photo induced AOP.
3.2.
3.2. Cytotoxicity
CytotoxicityAssays
Assays
Even
Even though
though allall the
the AOPs
AOPsunderunderstudy
studygenerate
generatehydroxyl
hydroxyl radicals
radicals andandthethesamesame by-products,
by-products, the
the
global kinetics are different and other side reactions could lead to different by-products and/or to
global kinetics are different and other side reactions could lead to different by-products and/or to
different
different amounts
amounts of of the
thesame
sameby-products
by-productsand andthis
this could
could affect
affect thethe toxicity
toxicity of theof the samples
samples during
during and
and
afterafter the processes.
the processes. ForFor
thisthis reason,
reason, it isitimportant
is important to test
to test thethe toxicity
toxicity of of
thethe target
target compound
compound andandof
of the treated solution during and at the end
the treated solution during and at the end of the treatment.of the treatment.
Initially, the toxicity
Initially, the toxicitystudy
studywas was carried
carried outout incoli
in E. E. and
coli S.
and S. aureus
aureus bacteria; bacteria;
however, however, both
both bacteria
bacteria were capable of metabolizing PCT and taking advantage of it
were capable of metabolizing PCT and taking advantage of it as a carbon source during its growth as a carbon source during its
growth (data not shown). In this sense, the toxicity study has used the culture
(data not shown). In this sense, the toxicity study has used the culture system of eukaryotic cell lines system of eukaryotic
cell lines for greater
for offering offeringsensitivity
greater sensitivity
to PCT and to PCT and its by-products
its by-products to produce to cellular
produceinjury.cellular injury.
Hence, toxicity tests based on cell lines culture were performed
Hence, toxicity tests based on cell lines culture were performed by using VERO by using VERO and COS-1 cells
and COS-1
(epithelial-like and fibroblast-like cells, respectively). First, the value of the
cells (epithelial-like and fibroblast-like cells, respectively). First, the value of the LC50 , or rather the LC 50, or rather the
concentration
concentrationofofthe theselected
selectedchemical
chemical that
that kills 50%
kills 50% of of
thethe
tested
testedcellcell
in aingiven
a given time, waswas
time, evaluated
evaluatedfor
PCT with both line cells. Particularly, the LC 50 of PCT resulted to be very high (> 1000.0 mg L−1) for
for PCT with both line cells. Particularly, the LC50 of PCT resulted to be very high (>1000.0 mg L ) for − both
1
line cells under study, and this result shows that PCT is tolerated by both cells. Figure 5 shows the
results of the cytotoxicity assays performed to check the viability of all the treatments under study.Int. J. Environ. Res. Public Health 2019, 16, 505 13 of 17
both line cells under study, and this result shows that PCT is tolerated by both cells. Figure 5 shows
Int. J. Environ. Res. Public Health 2019, 16, x 13 of 16
the results of the cytotoxicity assays performed to check the viability of all the treatments under study.
Figure 5. Results of the cytotoxicity assays performed using COS-1 (full symbols) and VERO (slashed
Figure 5. Results of the cytotoxicity assays performed using COS-1 (full symbols) and VERO (slashed
symbols) and tested on samples taken after 0 (M0), 75 (M75) and 120 (M120) minutes of reaction.
symbols) and tested on samples taken after 0 (M0), 75 (M75) and 120 (M120) minutes of reaction.
Particularly, results are presented for samples (M0) taken before adding the Fenton reagents
Particularly,
(or rather beforeresults
starting arethepresented for samples (M0) taken
VUV_PHOTO-INDUCED before adding
treatment, the Fentononly
thus containing reagents
PCT(or in
rather before starting the VUV_PHOTO-INDUCED
− 1 treatment,
a concentration of 0.26 mmol L ), after 75.0 min of reaction (M75) and at the end of each treatment thus containing only PCT in a
concentration of 0.26 mmol L −1), after 75.0 min of reaction (M75) and at the end of each treatment (M120).
(M120). Cytotoxicity tests performed using samples M0 and M120 allow evaluating the toxicity of the
Cytotoxicity
target compound tests in performed
the initialusing samples set
concentration M0for and M120
this study allow evaluating
and the the toxicity
safe application of treatments
of the the target
compound
under study infor
thePCTinitial concentration
removal, set for this
respectively. study and
Moreover, the safe application
the presence of possibleoftoxicthe treatments
by-products under
was
study for PCT removal, respectively. Moreover, the presence of possible toxic
analyzed by taking samples after 75.0 min of reaction. In this way, it was possible to ensure that, in case by-products was analyzed
by taking samples
of Fenton after 75.0 min
and photo-Fenton of reaction.
treatments, withIn this way, it wasofpossible
the exception to ensure that,
FENTON_HIGH (for in case aofresidual
which Fenton
and
H2 O2 concentration of about 0.38 mmol L was detected at the end of the experiment), H2 O2 H
photo-Fenton treatments, with the exception
− 1 of FENTON_HIGH (for which a residual is2O
no2
concentration of about 0.38 mmol L −1 was detected at the end of the experiment), H2O2 is no longer present
longer present in solution. Actually, hydrogen peroxide could be toxic for the cells and may affect
in
thesolution.
toxicity Actually, hydrogen
tests preventing peroxide could
to determine if the be toxic depends
toxicity for the cellson aand
toxicmay affect theortoxicity
compound tests
the oxidant.
preventing to determine if the toxicity depends on a toxic
For this reason, cytotoxicity results obtained for the FENTON_HIGH case are not shown. compound or the oxidant. For this reason,
cytotoxicity resultsand
Both COS-1 obtained
VERO for cellsthewere
FENTON_HIGH
not affected bycase PCT areinnot
theshown.
initial concentration of 0.26 mmol L−1
(see results of M0 samples in Figure 5). A strong increase of cells initial
Both COS-1 and VERO cells were not affected by PCT in the concentration
mortality (about 85%) of 0.26
was mmol
observed L−1
(see
when results of M0and
both M75 samples
M120 in Figureof
samples 5).theA strong
FENTON_LOW increase ofand cells mortality (about 85%) was
PHOTO-FENTON_LOW observed
experiments
when both M75
were tested. Hence,andthisM120 case samples
revealsofthat theitFENTON_LOW
is not possible toand PHOTO-FENTON_LOW
ensure the safe application ofexperiments
Fenton and
were tested. Hence, this case reveals that it is not
photo-Fenton treatments for the PCT removal for mild Fenton reagent loads. possible to ensure the safe application
The final TOC of Fenton and
conversion
photo-Fenton treatments for the PCT removal for mild
values attained by applying FENTON_LOW (31%) and PHOTO-FENTON_LOW (39%) treatments Fenton reagent loads. The final TOC conversion
values attained
also confirm byresult.
this applying FENTON_LOW (31%) and PHOTO-FENTON_LOW (39%) treatments also
confirm this result.
On the contrary, the PHOTO-FENTON_HIGH treatment is able to finally generate a non-toxic
effluent the
On contrary,
(M120) that canthe be PHOTO-FENTON_HIGH
safely discharged into the treatment
aquaticisenvironment,
able to finallydespite
generate thea formation
non-toxic
effluent
of more(M120) that can be safely
toxic by-products duringdischarged
the process into the aquatic environment,
(highlighted despite theofformation
by a 70% mortality the COS-1 of more
cells,
toxic
and a 25% mortality of the VERO cells, when M75 samples were tested). A 25% mortality of the aCOS-1
by-products during the process (highlighted by a 70% mortality of the COS-1 cells, and 25%
mortality
cells, andofa the
10%VERO cells, of
mortality whenthe M75
VERO samples
cells was wererecorded
tested). Awhen 25% mortality
M120 samples of the COS-1 cells, and
were tested. Thisa
10% mortality of the VERO cells was recorded when M120 samples were
result is consistent with the higher mineralization value reached at the end of the treatment (71%). tested. This result is consistent
with the higher
The slightly mineralization
different value reached
result obtained usingatCOS-1
the endand of the
VEROtreatment (71%).
cells can be The slightlyby
explained different result
considering
obtained
that bothusing COS-1have
cell types and different
VERO cells can be explained
morphological by considering
characteristics that
(e.g., both cell
VERO types
cells, have different
as epithelial cells,
morphological characteristics (e.g. VERO cells, as epithelial cells, have
have a large contact surface during cellular spreading, whereas COS-1 cells such as fibroblasts have a large contact surface duringan
cellular spreading, whereas COS-1
adhesion to the surface by focal contacts). cells such as fibroblasts have an adhesion to the surface by focal
contacts).
Finally, regarding the VUV_PHOTO-INDUCED treatment, all the cytotoxicity assays using both
VERO and COS-1 cells confirm the safe application of this treatment for the removal of PCT. For both cell
types, Figure 5, shows a percentage of mortality similar to the control when both M75 and M120 samples
were analyzed. Moreover, despite the fact Figure 5 only shows the results for samples M0, M75 and M120,Int. J. Environ. Res. Public Health 2019, 16, 505 14 of 17
Finally, regarding the VUV_PHOTO-INDUCED treatment, all the cytotoxicity assays using both
VERO and COS-1 cells confirm the safe application of this treatment for the removal of PCT. For both
cell types, Figure 5, shows a percentage of mortality similar to the control when both M75 and M120
samples were analyzed. Moreover, despite the fact Figure 5 only shows the results for samples M0,
M75 and M120, the toxicity assays for the VUV_PHOTO-INDUCED treatment were performed also
using samples taken after 5.0, 15.0, 20.0, 25.0, 30.0, 45.0, 60.0, and 120.0 min. Furthermore, it is worth
noting that, for all the samples, the mortality of both cell types was similar to the control. Since the
intermediates detected for VUV_PHOTO-INDUCED, Fenton and photo-Fenton treatments are the
same, this result can be probably due to the kinetics of the reactions, which in this case can lead
to the generation of a certain amount of intermediates whose total balance determines a nontoxic
solution. Alternatively, no more toxic by-products could be formed beyond those generated (even if
not detected) during the Fenton and photo-Fenton processes. This can be related to the continuous
generation of hydroxyl radicals during the VUV_PHOTO-INDUCED treatment; or rather, HO• are not
generated mostly at the beginning of the process, as it occurs in the Fenton and photo-Fenton cases
instead. Hence, interesting further work could be testing the toxicity of the photo-Fenton treatment
when dosing H2 O2 , because also in this case, as shown in the previous sections, there is a continuous
generation of the hydroxyl radicals during the process.
These results allow concluding that, unlike Fenton and photo-Fenton processes,
the VUV_PHOTO-INDUCED treatment can be safely stopped when it is convenient (e.g., according to
the desired percentage of TOC conversion and/or PCT removal).
4. Conclusions
On the one hand, photo-induced oxidation resulted to be a very promising treatment. It allows
the efficient removal of the model compound (which was no longer detected after 20.0 min) and it
could allow the total organic matter mineralization by increasing the reaction time span to 200.0 min.
Moreover, cytotoxicity assays revealed the feasibility of the VUV photo-induced treatment for PCT
removal as well as the possibility to stop this process at any convenient time because it was never
possible to detect any increase of toxicity.
The bottleneck of the photo-induced oxidation is the kinetics of the process, which is likely due to
the illuminated volume (VIRR = 1.1 × 10⁻³ L) employed, much lower than the illuminated volume
of the Fenton/photo-Fenton pilot plant (VIRR = 1.5 L). Therefore, further investigation is required to
address the reactor design with the aim of increasing the irradiated volume.
On the other hand, the photo-Fenton process using high concentrations of Fenton reagents
demonstrated good performance in terms of both PCT removal and organic matter mineralization.
However, cytotoxicity results highlighted that only after 120 min of reaction it was possible to generate
a non-toxic effluent, so showing that it is not possible to stop such process at any convenient time and
that is mandatory to monitor the cytotoxicity evolution.
Author Contributions: Conceptualization, M.P.-M. and M.G.; methodology, M.P.-M., M.G., J.M.T.S., L.J.d.V.M.
and F.A.; software, M.P.-M. and M.G.; validation, M.P.-M. and M.G.; formal analysis, F.A., and L.J.D.V.M.;
investigation, F.A and J.M.T.S.; resources, M.P.-M., M.G. and J.M.T.S.; data curation, F.A.; writing—original draft
preparation, F.A.; writing—review and editing, F.A., M.P.-M. and M.G.; visualization, F.A.; supervision, M.P.-M.
and M.G.; project administration, M.P.-M.; funding acquisition, M.G.
Acknowledgments: This work was supported by the Spanish “Ministerio de Economía, Industria y
Competitividad (MINECO)” and the European Regional Development Fund, both funding the research
Project AIMS (DPI2017-87435-R). Francesca Audino, particularly acknowledges the MINECO for the PhD
grant [BES-2013-065545]. German authors also want to thank the Institute for Interfacial Engineering and
Biotechnology, Fraunhofer.
Conflicts of Interest: The authors declare no conflict of interest.You can also read