CZECH TECHNICAL UNIVERSITY IN PRAGUE
←
→
Page content transcription
If your browser does not render page correctly, please read the page content below
CZECH TECHNICAL UNIVERSITY IN PRAGUE
                      FACULTY OF ELECTRICAL ENGINEERING
                                DEPARTMENT OF PHYSICS

                                     Bachelor Thesis

Experimental study into sub-lethal exposure of bacteria to nanoparticles
                   and the possible development of resistance

  Mohammed Fadel
  Electrical Engineering and Computer Science

  Supervisor: Ph.D. David Rutherford
 Prague, 2020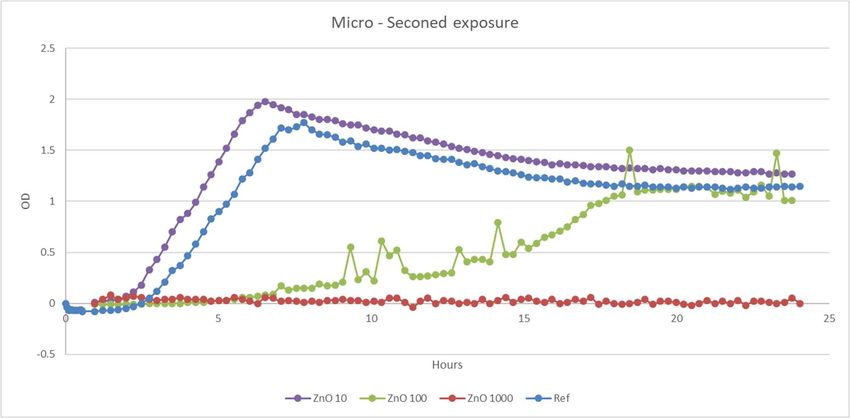
2

Acknowledgements                Declaration

   I have to thank my thesis supervisor, Mr.       I hereby declare that I’m the author of this
        David Rutherford, Ph.D. Without his        thesis work and that I have not used any
  assistance and dedicated involvement, this       sources other than those listed in the
paper would have never been accomplished.          bibliography and identified as references. I
  I would like to thank you for your support       further declare that I have not submitted this
           and understanding over these past       thesis at any other institution in order to
                        challenging months.        obtain a degree.

           In Prague 04.01.2021                                  Mohammed Fadel
                                                                 Signature…………….

                                               3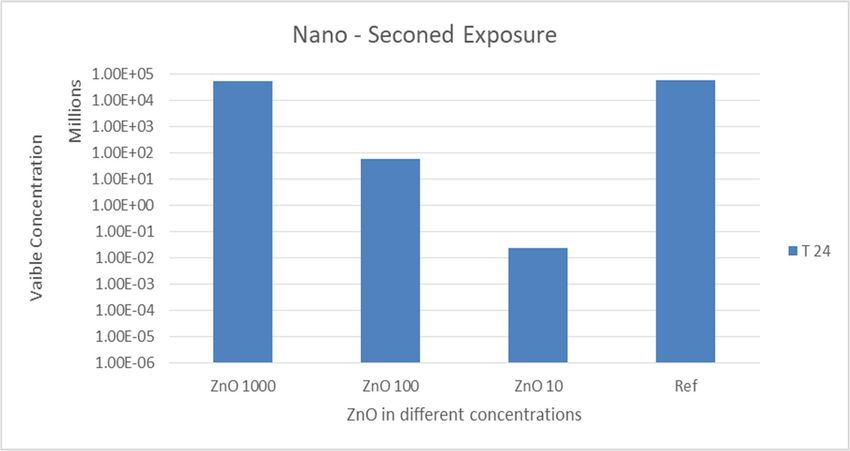
TABLE OF CONTENTS

LIST OF FIGURE ...................................................................................................................................... 6
ABSTRACT ................................................................................................................................................. 7
CHAPTER 1 ................................................................................................................................................ 8
1.     INTRODUCTION .............................................................................................................................. 8
CHAPTER 2 .................................................................................................................................................. 10
2.     AIMS AND OBJECTIVES ....................................................................................................................... 10
     2.1.      Goals and Structure of the Thesis ........................................................................................... 10
     2.2.      Rationale of the study ............................................................................................................... 10
     2.3.      Experimental outline ................................................................................................................ 10
CHAPTER 3 .............................................................................................................................................. 12
3.     METHODOLOGY .......................................................................................................................... 12
     3.1.      Re-exposure Protocols .............................................................................................................. 12
       3.1.1.         General info ....................................................................................................................... 12
       3.1.2.         Protocol for Week 1 .......................................................................................................... 12
       3.1.3.         Protocol for Week 2 .......................................................................................................... 13
     3.2.      Tools and devices....................................................................................................................... 13
       3.2.1.         RTS – 1C: Personal bioreactor ........................................................................................ 13
       3.2.2.         Autoclave ........................................................................................................................... 14
       3.2.3.         Elmasonic P bath............................................................................................................... 14
       3.2.4.         Advanced vortex mixer ..................................................................................................... 14
       3.2.5.         Sphere flash ....................................................................................................................... 14
       3.2.6.         Other tools ......................................................................................................................... 14
     3.3.      Materials .................................................................................................................................... 15
     3.4.      Cell viability............................................................................................................................... 15
     3.5.      Nano – First exposure ............................................................................................................... 15
     3.6.      Nano – Second Exposure .......................................................................................................... 15
     3.7.      E. coli Growth............................................................................................................................ 16
CHAPTER 4 .............................................................................................................................................. 17
4.     RESULTS AND DISCUSSION ....................................................................................................... 17
     4.1.      Nanoparticle characterization ................................................................................................. 17

                                                                                4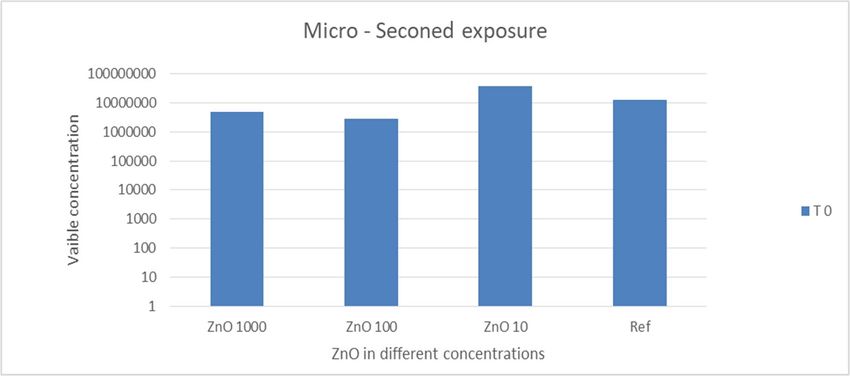
4.2.      Cell viability............................................................................................................................... 19
     4.3.      Micro Exposure ......................................................................................................................... 22
     4.4.      Nano First exposure ................................................................................................................... 22
     4.5.      Nano second exposure ............................................................................................................... 24
     4.6.      Micro First Exposure ................................................................................................................ 25
     4.7.      Micro– Second Exposure .......................................................................................................... 27
CHAPTER 5 ............................................................................................................................................. 29
5.     IMPLEMENTATION ...................................................................................................................... 29
CHAPTER 6 .................................................................................................................................................. 31
6.     CONCLUSION ................................................................................................................................. 31
REFERENCES ................................................................................................................................................ 32

                                                                               5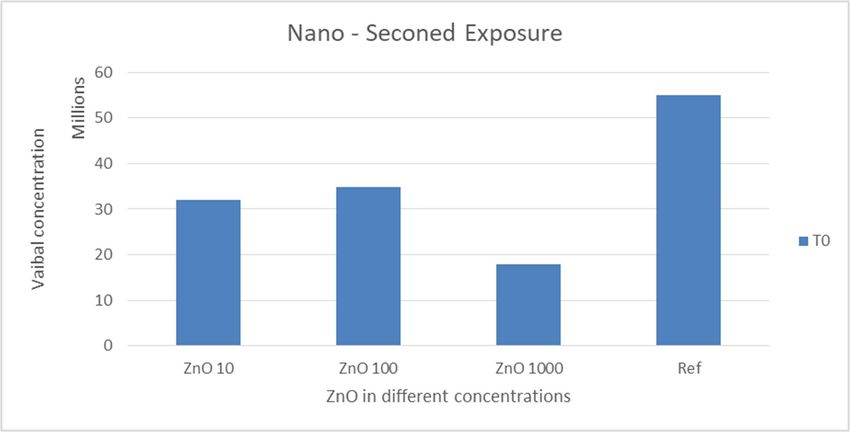
LIST OF FIGURE

Figure no   Content                                                   Pages no
Fig 1       Bacterial growth curve                                    14
Fig 2       SEM images for nano (SEM Ec NS 11-6um)                    18
Fig 3       SEM images for micro ZnO (3-200 um)                       20
Fig 4       E.coli Growth                                             20
Fig 5       Nano Second Exposure - Viable concentration against       21
            ZnO concentration (T0)
Fig 6       Nano Second Exposure - Viable concentration against       21
            ZnO concentration (T24)
Fig 7       Micro Second Exposure - Viable concentration against      21
            ZnO concentration (T0)
Fig 8       Micro Second Exposure - Viable concentration against      22
            ZnO concentration (T24)
Fig 9       Optical density against E. coli cell membrane viability   23
            in hours
Fig 10      Impact of NPs on biofilms of E. coli under different      25
            concentrations
Fig 11      Viable concentration against ZnO concentration            26

Fig 12      Optical density against hours under different ZnO         28
            concentrations

                                       6
ABSTRACT
Zinc nanoparticles are the most common nanotechnology NPs that provides a major
contribution to the production of large-scale consumer goods. In developed nations, hazardous
microbe infections pose a major public health issue, largely due to less awareness of antibiotic
usage and vaccination. The creation of compounds to treat infection is essential to handle certain
pathogenic bacteria, such as multiple drug resistance lines. To research the resistance to
hazardous microbial strains, scientists use nanoparticles (NPs). These NPs are also used to treat
diseases like cancer that kill cells with DNA. The thesis aimed to study the effects of nano ZnO
and micro ZnO against E. coli, by analyzing cell viability. Zinc oxide nanoparticle was
characterized and was exposed to the E. coli. The cell viability of E. coli concentration between
100 to 1000 μg/mL was observed. The growth concentration nano and micro exposure was
observed in T0 and T24. The exposure effects indicate that stock solution exhibited a higher
impact on its cell membrane viability as the concentration tends towards 0 μg/mL. Viable
concentrations are expressed in terms of ZnO concentration and the length of unit time in stock
solution. In conclusion, the research findings show the importance of incorporating a wide range
of possible endpoints to determine NPs toxicity as it provides an in-depth assessment of discrete
impacts, otherwise not revealed by a narrow choice of endpoints.
Keywords: Nanoparticles, toxicity, zinc oxide nanoparticles, sub-lethal exposure.
7CHAPTER 1
1. INTRODUCTION
In the recent past, multiple consumer goods have reinvented nanoparticles to enhance consumer
experience due to their special properties that provide for an enhancement of the primary
functionality of such products. As such, zinc oxide nanoparticles (ZnO NPs) represent some of
the most popular NPs in the field of nanotechnology that contributes significantly to the
manufacture of a wide-ranging consumer product [1]. For instance, ZnO NP is commonly
included in consumer products that include but are not limited to cosmetics and paints, mainly
because of its unique blocking characteristics of the UV radiation [2]. Hence, the extensive use
of the NP has contributed to its exponential accumulation in the environment, and the growth
is not assumed to slow down because of its wide-ranging applications. According to Hou et al.
2018 [3], the toxicity properties of the NP in causing inflammation can increase its chances of
negatively impacting the microbes, such as E. coli, once they are released into the water bodies.
Such microbe’s play a critical role in the fixation of nitrogen, as well as reducing the oxidizing
capacity of metals in the environment [4]. Hazardous microbe diseases are a significant public
health concern in developing countries, mainly because of less understanding of antibiotic
usage and vaccination. This has also contributed to the creation of multi-drug resistant strains
(MR). The development of compounds to fight many pathogenic bacteria, like MR strains, to
cure infection is highly significant. Scientists produced tiny particles known as nanoparticles
(NPs), which demonstrate tolerance to hazardous microbial strains. These NPs often are used
to cure diseases such as cancer, which either destroy cells individually or in conjunction
with DNA [5].
Studies have revealed that NP toxicity towards microbes has been due to oxidative stress when
reactive oxygen species are generated. Also, it is argued that the toxic metallic ions play a part
in the sub-lethal exposure of bacterial to NPs, such as Zn2+ [6]. Also, NPs-microbe’s
interaction, coupled with respective toxicity, depends on individual physicochemical
characteristics of NPs and water aqueous properties [7]. Specifically, multiple studies have
8illustrated the impact of aqueous properties such as pH and natural organic matter on NP
transformation, as well as subsequent toxicity to microbes such as E. coli. Of note, most of the
studies focused on the effect of aqueous chemistry on NP transformation together with
significant toxicity, evident in synthetic media [8].
The sub-lethal exposure of NPs has been studied at concentrations lower than the modeled
levels and recorded NP concentration [9]. As a result, the variations have constrained the ability
to obtain an accurate picture of the impacts on aquatic systems. However, a handful of studies
have assessed the effect of NPs on microbes at the concentration found within the levels that
have been measured in real settings using actual metrics [10,11]. For instance, the impact of Ag
NP on other microbes, notably E. coli, in a natural aqueous media. E. coli, a relatively
environmentally ubiquitous microbe, can be identified as a model microorganism because it
can endure extreme conditions, as well as a highly stressful environment. The bacterium can
also be identified because of its excellent record in nontoxicity studies, on which E. coli and S.
aureus, is more sensitive [12]. Understanding engineered toxicity of NPs on microbes in natural
aqueous systems by assessing the endpoints mentioned earlier: ROS, cell viability, ATP
concentrations, and membrane viability helps in a quest to develop better possible development
of the resistance.
9CHAPTER 2
2. AIMS AND OBJECTIVES
2.1. Goals and Structure of the Thesis
In this thesis, the outlines of the methods normally used based on prepared stock solutions, the
effects of zinc oxide nanoparticles in an aqueous medium, and in particular, the microorganism
in question - E. coli. In materials and methods (Chapter 3) of the thesis, mention the cell
viability to analysis the behavior of E. coli in response to exposure to different concentrations
of nanometer-sized ZnO (nZnO)and the possible development of resistance. The results and
discussion (Chapter 4) highlight the aforementioned endpoints and the implications of zinc
oxide nanoparticles on the microorganisms using the prepared stock solutions. In chapter 5, the
effects of the nanoparticle on the environment are discussed, focusing on past literature and
policy issues that govern the use of potentially dangerous nanoparticles such as nZnO. Finally,
the conclusion in chapter 6 summarizes the thesis by discussing the overarching components of
the nanoparticle in question in relation to its effect on the microorganism,
2.2. Rationale of the study
It is well documented that zinc oxide nanoparticles have an antibacterial activity that has the
ability to permeate the cell membrane, thus inhibiting its growth. Cellular functions are
disrupted major by lipid peroxidation that results from changes in the organism’s cell membrane
[13]. Such assertions have been echoed by the effects of oxidative stress that involve nZnO in
E. coli [14]. Thus, the consideration of nZnO toxicity includes toxic ions release owing to the
amphoteric nature of the chosen nanoparticles and is known to react with acids and alkalis to
yield Zn2+ ions. By analyzing the growth curves of subsequent generations of cells exposed to
ZnONP, it is hoped that one might observe differences in the shape that could be attributed to
re-exposure to treatment and relate that to the development of resistance or enhanced sensitivity.
2.3. Experimental outline
Bacteria (E. coli) will be exposed to two commercially available ZnO NP of different size and
morphology, 50 nm (Sigma Aldrich) and 10 μm (US nanomaterial research), at 3 different
concentrations: 1000, 100 and 10μg/mL. The optical density of incubated bacteria with different
10ZnO NP will be measured over 24h using separate bioreactors (BioScan). A sub-sample from
each condition after 24h will be used for the following experiment after cell concentration
equilibration by optical density. This process of recovering surviving cells and re-exposure to
fresh ZnO NP can be repeated multiple times. Viable cell concentration of all reference and test
samples at T0 and T24 will be assessed by serially diluting the bacteria suspension and
inoculation onto agar plates for enumeration after incubation using an automatic colony
counter.
11CHAPTER 3
3. METHODOLOGY
3.1. Re-exposure Protocols
3.1.1. General info
Week 1: E. coli + nano ZnO 1st-exposure (bacteria from the freezer - stock)
Week 2: E. coli + nano ZnO re-exposure (bacteria from agar plates - survivors from week 1)
Week 3: E. coli + micron ZnO 1st exposure (bacteria from freezer - stock)
Week 4: E. coli + micron ZnO re-exposure (bacteria from agar plates - survivors from week
3)
Weeks 1/2 and 3/4 are the same procedure, except for the size of ZnO used.
3.1.2. Protocol for Week 1
On day 1 the preparation process was followed. The ZnO stock solution, nanoparticles < 50
nm, add 2 mg/ml in 10ml of water were made. Then 200 mL broth and 500 mL agar were made.
The bacteria were cultivated and grown in freezer stock. On day 2, the experiment was carried
out. The ZnO solution was sonicated for 30 min at 37 Hz/100 W for better mixing and the two
dilutions (1:10 & 1:100) were prepared. This is followed by the removal of bacteria growth
from agar plate and added 5 mL broth, which was in dilute of 1:1000. 5mL of bacteria were
added to 4 labeled tubes which were labeled as Reference, 1000, 100 and 10 respectively. 5 mL
water was added to “reference” tube, 5mL of the 2 mg/mL stock were added to “1000”, 5 mL
of the 1:10 stock dilution were added to “100” and 5 mL of the 1:100 stock dilution were added
to “10”. This dilution series was performed on “reference” sample to determine initial bacteria
concentration (T0: -4, -5, -6). The tubes were placed into separate bioreactors and ‘E. coli test’
program was started. On day 3, the analysis procedure was carried out. After 24 h, dilution
series was performed on all 4 tubes to determine final bacteria concentration (T 24 Reference: -
7, -8, -9; 1000: -1, -2, -3; 100: -4, -5, -6; 10: -7, -8, -9). The images of colonies were taken using
a colony counter (Reference: T0). The data from the colony counter were exported into MS
Excel. And the data from bioreactor software were exported into MS Excel. Again on day 4,
the images of colonies were taken using colony counter (Reference, 1000, 100 & 10: T 24).
123.1.3. Protocol for Week 2
On day 1, preparation and experiment procedure were followed. ZnO stock solution (2 mg/ml)
was made, followed by that is autoclave and sonication (30 min @ 37 Hz/100 W), which was
then prepared in dilutions (1:10 & 1:100). 200 mL broth and 500 mL agar were prepared. The
colonies from T24 plates on each sample of week 1 were removed and added into 4 new tubes
with new broth; each tube's solution was adjusted to optical density value at 850 nm = 0.07 ±
0.01 (equivalent to 10^7 cfu/mL). The dilution series was performed on each sample tube to
determine initial bacteria concentration (T0: Reference, 1000, 100 & 10: -4, -5, -6). The tubes
were placed into separate bioreactors and ‘E. coli test’ program was started. On day 2, the
analysis procedure was followed. After 24 h, dilution series was performed on all 4 tubes to
determine final bacteria concentration (T24 Reference: -7, -8, -9; 1000: -1, -2, -3; 100: -4, -5, -
6; 10: -7, -8, -9). The images of colonies were captured using a colony counter (Reference,
1000, 100 & 10: T0). The data from the colony counter were exported into MS Excel. And the
data from bioreactor software were exported into MS Excel. On day 3, the analysis procedure
was followed. The images of colonies were captured using the colony counter (Reference, 1000,
100 & 10: T24).
3.2. Tools and devices
3.2.1. RTS – 1C: Personal bioreactor
E. coli was mounted on RTS – 1C personal bioreactor for analysis. For cell viability assessment,
a colony was inoculated in lysogenic broth at an optimum temperature of 37 °C. The process
was accompanied with continuous shaking at an average of 2000 rpm for the entire night until
the colony reached a mid-exponential phase of between 0.5 and 0.6 at OD 850nm. The
microbi1al cells were obtained through centrifugation for 15 minutes. The bacterial growth
curve is represented in Figure 1. The growth curve is hyperbolic as it has an exponential growth
pattern that involves Lag Phase, Log Phase or exponential Phase, Stationary Phase and Death
Phase or decline Phase. Lag Phase is the initial phase that involves inoculation, adaption to the
physical environment and preparation for cell division. In Log Phase, bacteria divide
continuously with balanced growth. In the Stationary Phase, there is no increase in the bacterial
population, which maintains cell death and cell division. In Death Phase, the bacteria decrease
continuously.
13Fig 1: Bacterial growth curve
Reference: Onlinebiologynotes.com
3.2.2. Autoclave
The NP solutions with a 2 mg/mL concentration were prepared using an Autoclave to sterilize
the tubes from ZnO and bacteria. On the other hand, the control experiment is run with the
exclusion of NP suspensions. Finally, both flasks are kept at an optimal temperature of 37°C.
3.2.3. Elmasonic P bath
The solution is sonicated at a frequency of 37 kHz for approximately 30 minutes in an
Elmasonic P bath before the sub-lethal exposure. Furthermore, the concentrations are diluted in
line with the projected nominal concentration of between 10 and 1000 μg/L in a 250 mL flasks
with the microbial cells at OD850nm of 0.5 for the medium to obtain the ultimate volume of 25
mL.
3.2.4. Advanced vortex mixer
An advanced vortex mixer was used to mix the sample after the microbes are exposed to NP.
A 100 mL of NP from the matrix is then put in specific wells, containing a 200 μL solution, and
mixed proportionately.
3.2.5. Sphere flash
After NP exposure, the microbial viability was determined by colony-forming units using the
Sphere flash, where the cell viability percentage is established by the CFU.
3.2.6. Other tools
The other necessary used tools are Scale ABT 320-4M, pipettes and pipette tips.
143.3. Materials
The serial dilution of the aqueous media was done using a 0.9% NaCl. Muller – Hinton broth
(CM0405) and Muller – Hinton agar (CM0337) lysogeny broth agar plated with a drop count
were used.
3.4. Cell viability
The serial dilution of the aqueous media was done using a NaCl at 0.9% concentration.
Thereafter, all viable bacteria are assessed using a lysogeny broth agar plate with a drop count
method. The microbial viability after NP exposure was determined by colony-forming units
CFU counting from respective agar plates. From there, the cell viability percentage was
established by the CFU.
3.5. Nano – First exposure
To determine the cell membrane viability, RTS – 1C: Personal bioreactor kit has been used
after the microbes are exposed to NP. The diluted concentrations of NP from the matrix is then
put in specific wells, containing a 250 mL Elmasonic P solution, and mixed proportionately.
After that, the sample was incubated at temperature of 37°C for 30 minutes in a dark
environment. After NP exposure, the microbial viability was determined by colony-forming
units using the Sphere flash, where the CFU established the cell viability percentage. From the
known proportion of intact, possibly alive cells, the resulting calibration curve was obtained for
analysis.
3.6. Nano – Second Exposure
The second nano- exposure as a result of NPs sub-lethal exposure in the sample was assessed
to represent the cell viability using RTS – 1C Personal bioreactor after NP-membrane reaction
took place. As a result, cells were observed for optical density after the exposure time of
approximately 24 hours, under different concentrations at temperature of 37°C.
153.7. E. coli Growth
This is attained by measuring the optical density over time in response to NP exposure.
Furthermore, a proportionate amount of Elmasonic P - of NP are transferred to respective wells
together with a 25 mL Muller – Hinton agar (CM0337) lysogeny broth and after that using
appropriately using an advanced vortex mixer. At an approximately 37 °C for up to 24 hours.
16CHAPTER 4
4. RESULTS AND DISCUSSION
4.1. Nanoparticle characterization
From the observation, zinc oxide nanoparticles have shown regular shapes, no rod-like and no
hexagonal-like shape with varying diameter measurements of between 16 to 18 nm, primarily
due to morphological asymmetry. Significantly elevated aggregation of NPs demonstrated in
some of the freshwater systems is due to low Zeta potential, ranging between −13.3 ± 0.5 and
−16.1 ±1.4 mV. The figures are a departure from the regular reading of up to ± 30 mV needed
to maintain NPs dispersed as a result of charge stabilization in comparison to aggregation [15].
According to Li et al. 2013 [16], nZnO dissolution is concentration-dependent. At a moderate
exposure level of approximately 100 μg/L , up to 15 μg/L dissolved in zinc. However, at an
elevated nominal exposure concentration of approximately 1000 μg/L, there can be a notable
increase in the dissolution effect of nZnO. Such significant differences are due to the
physicochemical characterization, which according to Connolly et al. 2016[17], is known to
determine the transformational processes of NPs in water systems. Also, NPs coating,
especially the natural organic matter in water systems, can promote or prevent aggregation and
stability through known mechanisms such as electrostatic interaction, together with ligand
exchange [18].
Furthermore, it is argued that in the absence of Natural organic matter (NOM), cation binding
will likely promote NPs aggregation [19]. Noteworthy, freshwater systems demonstrate
elevated natural organic matter content of more than 6 mg/L, which is in agreement with the
known normal ranges of 0.1 and 32 mg/L in aqueous systems, hence proved the concept of
natural organic matter dependent aggregation. Another study demonstrated that the release of
Zn2+ diminished with an increase in PO4 because of high metal-complexation between the two
metals [20]. The demonstrated ZnO dissolution differential could be due to aggregation
differences and aqueous characteristics. Accordingly, another study showed the higher
aggregation and minimal dissolution of zinc oxide nanoparticles in freshwater systems such as
rivers and lakes, which revealed enhanced aggregation of ionic strength of between 3.3 and 6.5
mM compared to those with low ionic strength characteristics [21]. The results from the study
17as mentioned earlier are echoed by other findings where river water demonstrate high ionic
strength of approximately 5.2 mM which had an enhanced aggregation and minimal dissolution
of zinc oxide nanoparticles as compared to minimal aggregation and enhanced dissolution in
the water system with the limited ionic strength of approximately 2.42 mM. Therefore, the
results lend credence to natural organic matter coating-controlled NPs ionic release in aquatic
systems because Zn2+ release is blocked, which as a result, inhibits ionic diffusion from NP.
Also, metal ion complexation with natural organic matter and phosphates can contribute to the
low dissolution of zinc oxide nanoparticles. The above-outlined developments directly or
indirectly impact the bioavailability and sub-lethal exposure of NP in water systems further
demonstrated in the subtopics below. Fig 2 represent SEM images for nano (SEM Ec NS 11-
6um) and Fig 3 represent SEM images for micro ZnO (3-200 um) show that they are regulrely
shaped.[22].
Fig 2: SEM images for nano (SEM Ec NS 11-6um)
18Fig 3: SEM images for micro ZnO (3-200 um)
4.2. Cell viability
Outcomes of E. coli exposure to zinc oxide nanoparticles showed distinctive cytotoxic effects
(Fig. 4). From the graph, an enhanced concentration, between 100 to 1000 μg/mL, there was a
notable reduction in E. coli’s cell viability with more notable effects at 1000 μg/mL.
Conversely, the effects are less visible at lower zinc oxide nanoparticles, notably at 10 μg/mL.
Also, for other aqueous systems, sub-lethal exposure of zinc oxide nanoparticles did not exhibit
adverse effects on cell viability, even at higher concentrations (1000 μg/mL). This is due to less
compromise on cell viability caused by larger aggregates that block contact with cells. Fig 5
and Fig 6 represent the Nanosecond exposure of T0 and T24 respectively. Fig 7 and Fig 8
represent the micro-second exposure of T0 and T24 respectively.
19Fig 4: E.coli Growth
E. coli growth v 10 µm ZnO
3
Optical density @ 850 nm (a.u.)
2.5
2
1.5
1
0.5
0
0 4 8 12 16 20 24
Time (h)
0 µg/mL 1000 µg/mL 100 µg/mL 10 µg/mL
Fig. 5: Nano Second Exposure - Viable concentration against ZnO concentration (T0)
20Fig. 6: Nano Second Exposure - Viable concentration against ZnO concentration (T24)
Fig. 7: Micro Second Exposure - Viable concentration against ZnO concentration (T0)
21Fig. 8: Micro Second Exposure - Viable concentration against ZnO concentration (T24)
Nano - Seconed Exposure
1.00E+05
Millions
1.00E+04
1.00E+03
Vaible Concentration
1.00E+02
1.00E+01
1.00E+00
1.00E-01
1.00E-02 T 24
1.00E-03
1.00E-04
1.00E-05
1.00E-06
ZnO 10 ZnO 100 ZnO 10000 Ref
ZnO in different concentrations
4.3. Micro Exposure
The effect of the typical nuclear morphological changes was analyzed. The changes like nuclear
condensation and strong fluorescent spots were observed that show apoptotic nuclei.
4.4. Nano First exposure
To date, the sub-lethal effects of zinc oxide nanoparticles on microbes such as bacteria have
been widely researched, with the reported results mainly associated with mechanisms such as
the release of ions, reactive agent species production, and NPs surface exchange and uptake.
For this study, the effects mentioned above mentioned is evaluated with a target of accounting
for existing cytotoxic implications of zinc oxide nanoparticles on E. coli, including outcomes
summarized in subsequent analyses. The effect of concentration on cell membrane viability was
noted in Fig. 9. From the observation, the impact of the NP on the membrane is observed to
depend on nZnO concentration as present in the aqueous media. To put it into perspective, Fig.
2 shows a summary of the effects indicate that stock solution exhibited a higher impact on its
cell membrane viability as the concentration tends towards 0 μg/mL, and witnessed the lowest
22percentage when concentration peaks at 1000 μg/mL. Conversely, the cell membrane viability
can be particularly higher at the same concentration at 7 μg/mL. Also, at a lower concentration,
the cell membrane viability was barely noticeable and was completely stable at OD 0.1. Further,
the cell membrane viability was comparative the same at different OD, after 7hrs., at 0 and 10
μg/mL. The notable difference of the same degrees of disruption at different concentrations was
attributed to a characteristic physicochemical differential, wherein stock solution significant
reduction is likely because of minimal aggregation and enhanced dissolution of NPs, especially
zinc oxide nanoparticles [23]. Still, OD effects are more evident in-stock solutions as the
concentration of nZnO decreased. The findings echo that of other studies by [24], where
microbial viability can be discovered to depend on zinc oxide nanoparticle exposure dosage of
ranges 3 μg/L and 4000 mg/L.
Fig. 9: Optical density against E. coli cell membrane viability in hours
Nano - First exposure
2.8
Optical density @ 850 nm (a.u.)
2.3
1.8
1.3
0.8
0.3
-0.2 0 5 10 15 20 25
Hours
1000 µg/mL 100 µg/mL 10 µg/mL 0 µg/mL
234.5. Nano second exposure
As observed in Fig. 10, the effects are likely due to the increased proportion of dissolved zinc
concentration, directly linked to the increase in concentration exposure, which depended on
stock solution chemistry. Such findings mirror other studies, [25], which argue that dissolved
zinc from its constituent nanoparticles plays a role in the evident toxicity to microbes such as
E. coli by aqueous media chemistry. The findings from other studies on the effects of zinc NPs
in water matrix may result from measure concentration of up to 355 μg/L in comparison to 180
μg/L. All measurements are pegged to a 1 μg/L concentration. Moreover, modeled speciation
outcomes of dissolved ions in-stock solutions, with Visual MINTEQ, revealed that there are
significant dissolved ions combined to form complexes with the dissolved organic stock
solution. In contrast, the others developed labile compounds, which according to other findings,
could have contributed to toxicity to bacteria [26]. Unlike other metal ions, such as iron oxide
nanoparticles, zinc oxide nanoparticles are particularly more damaging to cell membrane
viability. This can be attributed to repulsion and limited NP-cell interaction. For example, the
hydrodynamic diameter of, say 550 ± 30 nm for zinc nanoparticles as visible in DLS
measurement mirrors the size of an average of bigger particles, but this does not rule out the
interaction with the bacterial cells as a result of the impact of concentration as posited by other
scholars [27]. Such limitations can also be explained by examining other mechanisms such as
van der Waals forces, which exhibit weaker electrostatic repulsion. Such can be explained by
zinc homeostatic disruption resulting from internalized Zn2+ cell death that occurs due to
protein denaturation. In addition, the significant nZnO (1000 μg/L) inhibition, usually between
10 and 20 percent on E. coli under, both as well as light conditions without enhanced nano-
exposure and limited nZnO-cell interaction. Thus, the outcomes from other studies points to the
fact zinc ions could be occurring by cellular functioning limitation as a result of pure chemical
impact on the microbial cells.
24Fig 10: Impact of NPs on E. coli under different concentrations
Nano - Seconed Exposure
3
Optical density @ 850 nm (a.u.)
2.5
2
1.5
1
0.5
0
0 5 10 15 20 25
Ref ZnO 1000 ZnO 100 ZnO 10
4.6. Micro First Exposure
The evaluation of the capacity of NPs to distort OD was included. The results measured OD
after the exposure of the bacterium E. coli to ZnO in-stock solutions for up to 24 hours, as
summarized in Fig. 11. Viable concentrations are expressed in terms of ZnO concentration and
the length of unit time in stock solution. To put it into perspective, zinc oxide nanoparticles
exhibited enhanced concentration-dependent on viable concentrations. Noteworthy, there is
limited research that examines the possible impacts of nanoparticles on viable concentrations.
However, another study finding, that there is an enhanced concentration-dependent limitation
in the ZnO concentrations demonstrated using E. coli specimen by zinc oxide nanoparticles in
lake water at 1000 μg/L for 24 hours incubation. From other studies, the results showed an
enhanced reduction in viable concentrations at a lower concentration of less than 20 μg/L of
zinc oxide nanoparticles after an hour of incubation in an aqueous medium under visible light
[28].
25Fig. 11: Micro First Exposure - Viable concentration against ZnO concentration (T0)
Micro - First exposure
1.00E+10
Vaible concentration
1.00E+08
1.00E+06
1.00E+04 T 24
1.00E+02
1.00E+00
ZnO 1000 ZnO 100 ZnO 10 Ref
ZnO in different concentrations
To support the study findings, two possible mechanisms can be attributed to it. First, viable
concentrations can be depleted as a result of a cellular membrane distortion that contributed to
the loss of homeostatic balance in the bacterial cells. It could also be a result of ion release after
the zinc NPs dissolution that may have triggered energy-dependent reactions within the cells.
Such phenomena have been reported in other studies using silver and zinc nanoparticles. Zinc
is one of the most crucial micronutrients for most organisms, as it is necessary for a majority of
biochemical processes. But, when they exist in excess quantities, then they may be detrimental
to critical biological pathways. Thus, zinc ions might have been absorbed through transport
pathways without inflicting any significant damage to the cell membrane. However, much
indirect damage might have occurred in the form of denaturation of ribosomes and enzyme and
protein suppression that is responsible for cell viable concentrations – thus leading to the
distortion of normal cell functions. In conclusion, the results sub-lethal nature of zinc oxide
toxicity, as demonstrated by the diminishing of E. coli growth, as well as cell viability. The
conclusion was attributed to a number of reasons that include less established contact between
the cells and the nanoparticles. Also, other findings show that the viable concentrations are in
line with dissolution configurations that take part in the releasing of ions, as demonstrated
by Wilke et al. Hence, the noted differential in zinc oxide nanoparticles among different stock
solutions is a result of dissolution differential caused by aqueous chemistry properties.
26The findings illustrated in Fig. 11 demonstrates a nanoparticle-type effect on the production of
cell viable concentrations. The outcomes in Fig. 11 reveal that viable concentrations after the
exposure of nZnO is significant despite the difference in stock solution concentration. As shown
in Fig. 11, nZnO was shown to influence the viable concentration levels after a 24-hour
incubation period. Accordingly, the limited effects shown by viable concentrations
measurement are significantly low concentration suggest that nZnO, despite its reported high
toxicity, may not present a considerable danger to the aquatic microorganisms, particularly with
its increased use in the field of nanotechnology.
4.7. Micro– Second Exposure
Demonstrating the impact of NPs on OD, it can be deemed necessary to examine there can be
a contribution of ZnO on the cellular membrane of the microorganism under study - E. coli. As
summarized in Fig. 12, the findings indicate a less significant transformation in E. coli’s OD.
Therefore, the results have shown no direct relation in nZnO toxicity concerning OD. In other
studies, it has been stated that OD is a contributing factor to cell damage attributed to sub-lethal
mechanisms of NPs resulting from metals such as silver and zinc [29]. For instance, zinc oxide
nanoparticles have significantly impacted cell OD from a microorganism such as E.
coli compared to control organisms without UV illumination [30]. However, the finding can be
limited by lower nanoparticle concentration, particularly zinc oxide, which typically do not
exceed 8 mg/L in fresh aquatic systems. In addition, in their research, they observed that sub-
lethal effects in natural aqueous media after exposure of zinc oxide to microbial groupings at
an average of 100 μg/L.
27Fig. 12: Optical density against hours under different ZnO concentrations
The above findings echo that of [31], which showed no influence of ZnO on E. coli after it is
exposed to zinc oxide nanoparticles for concentrations of between 10 and 250,000 μg/mL . Still,
the results of the study showed no cytotoxic impact. Also, other findings indicate that
cytotoxicity triggered by nZnO as well as damage to the cell membrane of E. coli in both
aqueous media. However, there is no evidence of the impact of OD. Also, the findings by [32],
revealed that cytotoxicity could be present. Hence, more research needs to focus on the
possibility of the effects of oxidative stress on NPs toxicity and provide an insight that facilitates
understanding of current research findings.
28CHAPTER 5
5. IMPLEMENTATION
There is a pressing need to delve deeper into the research on NP toxicity, with interest in their
impact on the environment to enable the research world to better understand the effects on
microbes that are part of the ecosystem and their role in helping sustain it. The call cannot be
underestimated because of the adverse effects of NPs on the environment and especially to
bacteria that play a crucial role in the ecological balance. To this effect, the experiment related
herein contributes to the understanding of sub-lethal effects of NPs – zinc oxide – to bacteria,
particularly E. coli, at varying exposure concentrations in two aquatic media. The findings
reveal the water chemistry differential is the critical determinant in the observed impacts of NPs
on aquatic systems microorganisms because they determine the level of impact of NP change
in a particular aqueous medium.
This implies that the findings from this study reveal the overarching extent to which NPs affect
bioavailability in freshwater systems and the subsequent effects on microbes available therein.
Hence, the role of aquatic properties needs to be keenly considered. The research world has not
fully exploited the consequences of NPs to microbes in real environment settings using
sufficient exposure concentration, for instance, in freshwater systems. Hence, the in-depth
evaluation presented in this study incorporates a wide-ranging assessment of NPs and their
impact on the environment, and especially the sub-lethal exposure of zinc oxide nanoparticles
and their accompanying endpoints such as ATP production, reactive organic species, and cell
viability and viability. Of note, the exhaustive nature of the chosen parameters contributes to
an in-depth analysis of the adverse impacts of NPs on microbes. However, the current data
insufficiencies that focus on mechanisms that influence NPs toxicity and the levels of sub-lethal
exposure on microorganisms in an aqueous media limits the conclusively of the finding from
other studies. Hence, the focus needs to focus on expanding the scope of identifying
mechanisms that influence NPs and their impact on the environment with a particular emphasis
on freshwater systems.
Moreover, the particular areas for considerations entail non-standard techniques of assessing
the implications and mechanisms of toxicity at minimal NPs concentration and employing real
29environment parameters. Overall, the other findings point to the fact that zinc oxide
nanoparticles are increasingly posing considerable risk to bacteria using the toxicity impacts
results. Moreover, the impacts of zinc oxide nanoparticles on microorganisms are
concentration-dependent, where dissolved zinc ions form a basis for the observed toxicity
levels. As such, the subcellular implications need to be included in other widely known
endpoints to determine the true extent of NPs toxicity, as demonstrated by nZnO from other
studies. However, the study findings are not conclusive or representative of every
environmental condition or microorganisms present in freshwater systems. Hence, there is a
need to expand the test conditions and media to include other organisms present in various
water matrices. Extensive research will also generate more data using freshwater matrices to
represent different exposure, taking into account multiple sub-lethal endpoints to enhance NPs
risk assessment. Thus, such a comprehensive approach will help obtain exhaustive data and
draw more definitive conclusions that will help manage nanoparticles and regulate their release
into the environment and everything negative consequences on freshwater microorganisms.
30CHAPTER 6
6. CONCLUSION
The sub-lethal exposure of bacteria to nanoparticles – zinc oxide- and the subsequent effects
were assessed using the different varied freshwater systems with different physicochemical
characteristics. Using the cell viability, it can be revealed that river water matrices have
enhanced outcomes from the four parameters as compared to those from other water sources.
The findings from other studies also demonstrated the sub-lethal exposure of nZnO to E. coli
could be dependent majorly on ionic strength and natural organic matter in the water system.
Notably, natural organic matter production demonstrated a diminished level for the NP – zinc
oxide. Furthermore, there is no observable NP-bacterial interaction that points to the fact that
dissolved ions from the metal influenced the effects of zinc oxide nanoparticles. Also,
physicochemical properties greatly influenced the outcomes, as demonstrated by dissimilarities
in dissolution levels in both water matrices.
Finally, the research findings show the importance of incorporating a wide range of possible
endpoints to determine NPs toxicity as it provides an in-depth assessment of discrete impacts,
otherwise not revealed by a narrow choice of endpoints. For instance, cell viability endpoint
may not reveal the effects of NP otherwise shown by other endpoints, say ATP production or
cell membrane viability. The findings also reveal a possible correlation between the observed
effects of zinc oxide nanoparticles and dissolved zinc ions using a different concentration in the
two water matrices. Such may mean that engineered adverse interference on metabolic
mechanisms and cell membrane frameworks may lead to observed results on the microbe used
- E. coli, but the contribution of the present nanoparticle may not be entirely excluded. Overall,
some of the apparent complexities and physicochemical property differences in freshwater
matrices need to be considered when determining NP toxicity to bacteria.
31REFERENCES
[1] MAHAYE, N., THWALA, M., COWAN, D. A., & MUSEE, N. (2017). Genotoxicity of metal
based engineered nanoparticles in aquatic organisms: A review. Mutation
Research/Reviews in Mutation Research, 773, 134-160.
[2] MUSEE, N., THWALA, M., & NOTA, N. (2011). The antibacterial effects of engineered
nanomaterials: implications for can betewater treatment plants. Journal of Environmental
Monitoring, 13(5), 1164-1183.
[3] HOU, J., WU, Y., LI, X., WEI, B., LI, S., & WANG, X. (2018). Toxic effects of different
types of zinc oxide nanoparticles on algae, plants, invertebrates, vertebrates and
microorganisms. Chemosphere, 193, 852-860.
[4] QIU, T. A., BOZICH, J. S., LOHSE, S. E., VARTANIAN, A. M., JACOB, L. M., MEYER,
B. M., ... & KLAPER, R. D. (2015). Gene expression as an indicator of the molecular
response and toxicity in the bacterium Shewanella oneidensis and the water flea Daphnia
magna exposed to functionalized gold nanoparticles. Environmental Science: Nano, 2(6),
615-629.
[5] SHARMA, D. (2021). Insights into the synthesis and mechanism of green synthesized
antimicrobial nanoparticles, answer to the multidrug resistance, Materials Today
Chemistry: 19, 100-391.
[6] IVASK, A., JUGANSON, K., BONDARENKO, O., MORTIMER, M., ARUOJA, V.,
KASEMETS, K., ... & KAHRU, A. (2014). Mechanisms of toxic action of Ag, ZnO and
CuO nanoparticles to selected ecotoxicological test organisms and mammalian cells in
vitro: a comparative review. Nanotoxicology, 8(sup1), 57-71.
[7] ZHU, M., WANG, H., KELLER, A. A., WANG, T., & LI, F. (2014). The effect of humic
acid on the aggregation of titanium dioxide nanoparticles under different pH and ionic
strengths. Science of the Total Environment, 487, 375-380.
32[8] HEINLAAN, M., MUNA, M., KNÖBEL, M., KISTLER, D., ODZAK, N., KÜHNEL, D., ...
& SIGG, L. (2016). Natural water as the test medium for Ag and CuO nanoparticle hazard
evaluation: An interlaboratory case study. Environmental pollution, 216, 689-699.
[9] SHENG, Z., & LIU, Y. (2017). Potential impacts of silver nanoparticles on bacteria in the
aquatic environment. Journal of environmental management, 191, 290-296.
[10] EL-BATAL, A. I., ABD ELKODOUS, M., EL-SAYYAD, G. S., AL-HAZMI, N. E.,
GOBARA, M., & BARAKA, A. Gum Arabic polymer-stabilized and Gamma rays-assisted
synthesis of bimetallic silver-gold nanoparticles: Powerful antimicrobial and antibiofilm
activities against pathogenic microbes isolated from diabetic foot patients. International
Journal of Biological Macromolecules, 165, 169–186.
[11] FATEMI, H., ESMAIEL POUR, B., & RIZWAN, M. Isolation and characterization of lead
(Pb) resistant microbes and their combined use with silicon nanoparticles improved the
growth, photosynthesis and antioxidant capacity of coriander (Coriandrum sativum L.)
under Pb stress. Environmental Pollution, 266, 114-982.
[12] BAEK, Y. W., & AN, Y. J. (2011). Microbial toxicity of metal oxide nanoparticles (CuO,
NiO, ZnO, and Sb2O3) to Escherichia coli, Bacillus subtilis, and Streptococcus
aureus. Science of the total environment, 409(8), 1603-1608.
[13] BARATA, C., VARO, I., NAVARRO, J. C., ARUN, S., & PORTE, C. (2005). Antioxidant
enzyme activities and lipid peroxidation in the freshwater cladoceran Daphnia magna
exposed to redox cycling compounds. Comparative Biochemistry and Physiology Part C:
Toxicology & Pharmacology, 140(2), 175-186.
[14] ZHANG, L., JIANG, Y., DING, Y., POVEY, M., & YORK, D. (2007). Investigation into
the antibacterial behaviour of suspensions of ZnO nanoparticles (ZnO nanofluids). Journal
of Nanoparticle Research, 9(3), 479-489
[15] LIU, J., LEGROS, S., VON DER KAMMER, F., & HOFMANN, T. (2013). Natural organic
matter concentration and hydrochemistry influence aggregation kinetics of functionalized
engineered nanoparticles. Environmental science & technology, 47(9), 4113-4120.
33]16] LI, M., LIN, D., & ZHU, L. (2013). Effects of water chemistry on the dissolution of ZnO
nanoparticles and their toxicity to Escherichia coli. Environmental pollution, 173, 97-102.
[17] CONNOLLY, M., FERNÁNDEZ, M., CONDE, E., TORRENT, F., NAVAS, J. M., &
FERNÁNDEZ-CRUZ, M. L. (2016). Tissue distribution of zinc and subtle oxidative stress
effects after dietary administration of ZnO nanoparticles to rainbow trout. Science of the
Total Environment, 551, 334-343.
[18] BAALOUSHA, M. (2009). Aggregation and disaggregation of iron oxide nanoparticles:
influence of particle concentration, pH and natural organic matter. Science of the total
Environment, 407(6), 2093-2101.
[19] COLLIN, B., AUFFAN, M., JOHNSON, A. C., KAUR, I., KELLER, A. A., LAZAREVA,
A., ... & WHITE, J. C. (2014). Environmental release, fate and ecotoxicological effects of
manufactured ceria nanomaterials. Environmental Science: Nano, 1(6), 533-548.
[20] LI, M., ZHU, L., & LIN, D. (2011). Toxicity of ZnO nanoparticles to Escherichia coli:
mechanism and the influence of medium components. Environmental science &
technology, 45(5), 1977-1983.
[21] ODZAK, N., KISTLER, D., & SIGG, L. (2017). Influence of daylight on the fate of silver
and zinc oxide nanoparticles in natural aquatic environments. Environmental
Pollution, 226, 1-11.
[22] RUTHERFORD et al. (2021). Growth inhibition of Gram positive and Gram negative bacteria
by zinc oxide hedgehog particles. In press
[23] GUO, D., BI, H., LIU, B., WU, Q., WANG, D., & CUI, Y. (2013). Reactive oxygen species-
induced cytotoxic effects of zinc oxide nanoparticles in rat retinal ganglion cells.
Toxicology in Vitro, 27(2), 731–738. doi:10.1016/j.tiv.2012.12.001
[24] KUMAR, A., PANDEY, A. K., SINGH, S. S., SHANKER, R., & DHAWAN, A. (2011).
Engineered ZnO and TiO2 nanoparticles induce oxidative stress and DNA damage leading
to reduced viability of Escherichia coli. Free Radical Biology and Medicine, 51(10), 1872-
1881.
34[25] MIAO, A. J., ZHANG, X. Y., LUO, Z., CHEN, C. S., CHIN, W. C., SANTSCHI, P. H., &
QUIGG, A. (2010). Zinc oxide–engineered nanoparticles: dissolution and toxicity to
marine phytoplankton. Environmental Toxicology and Chemistry, 29(12), 2814-2822.
[26] BRAYNER, R., FERRARI-ILIOU, R., BRIVOIS, N., DJEDIAT, S., BENEDETTI, M. F., &
FIÉVET, F. (2006). Toxicological impact studies based on Escherichia coli bacteria in
ultrafine ZnO nanoparticles colloidal medium. Nano letters, 6(4), 866-870.
[27] BAUMERTE, A., SAKALE, G., ZAVICKIS, J., PUTNA, I., BALODE, M., MRZEL, A., &
KNITE, M. (2013). Comparison of effects on crustaceans: carbon nanoparticles and
molybdenum compounds nanowires. In Journal of Physics: Conference Series (Vol. 429,
No. 1, p. 012041). IOP Publishing.
[28] WILKE, C. M., TONG, T., GAILLARD, J. F., & GRAY, K. A. (2016). Attenuation of
microbial stress due to nano-Ag and nano-TiO2 interactions under dark
conditions. Environmental science & technology, 50(20), 11302-11310.
[29] BUFFET, P. E., PAN, J. F., POIRIER, L., AMIARD-TRIQUET, C., AMIARD, J. C.,
GAUDIN, P., ... & MOUNEYRAC, C. (2013). Biochemical and behavioural responses of
the endobenthic bivalve Scrobicularia plana to silver nanoparticles in seawater and
microalgal food. Ecotoxicology and environmental safety, 89, 117-124.
[30] SHUKLA, R. K., KUMAR, A., GURBANI, D., PANDEY, A. K., SINGH, S., & DHAWAN,
A. (2013). TiO2 nanoparticles induce oxidative DNA damage and apoptosis in human liver
cells. Nanotoxicology, 7(1), 48-60.
[31] ZANNI, E., DE PALMA, S., CHANDRAIAHGARI, C. R., DE BELLIS, G., CIALFI, S.,
TALORA, C., ... & MANCINI, P. (2016). In vitro toxicity studies of zinc oxide nano-and
microrods on mammalian cells: A comparative analysis. Materials Letters, 179, 90-94.
[32] RENZI, M., & GUERRANTI, C. (2015). Ecotoxicity of nanoparticles in aquatic
environments: a review based on multivariate statistics of meta-data. J. Environ. Anal.
Chem, 2(149), 2380-2391.
35You can also read