A prognostic nomogram for lung adenocarcinoma based on immune-infiltrating Treg-related genes: from bench to bedside
←
→
Page content transcription
If your browser does not render page correctly, please read the page content below
Original Article

A prognostic nomogram for lung adenocarcinoma based on
immune-infiltrating Treg-related genes: from bench to bedside
Xiaofei Wang#, Zengtuan Xiao#, Jialin Gong, Zuo Liu, Mengzhe Zhang, Zhenfa Zhang

Department of Lung Cancer Surgery, Tianjin Medical University Cancer Institute and Hospital, Tianjin, China
Contributions: (I) Conception and design: Z Zhang, X Wang; (II) Administrative support: Z Zhang; (III) Provision of study materials or patients: X
Wang; (IV) Collection and assembly of data: Z Xiao; (V) Data analysis and interpretation: X Wang; (VI) Manuscript writing: All authors; (VII) Final
approval of manuscript: All authors.
#
These authors contributed equally to this work.
Correspondence to: Zhenfa Zhang, MD. Department of Lung Cancer Surgery, Tianjin Medical University Cancer Institute and Hospital, Huanhu
West Rd, Tianjin, China. Email: zhangzhenfa@tmu.edu.cn.

                 Background: Accumulating evidence suggests that lymphocyte infiltration in the tumor microenvironment
                 is positively correlated with tumorigenesis and development, while the role of Tregs (regulatory T cells) has
                 been controversial. Therefore, we attempted to discover the possible value of Tregs for lung adenocarcinoma
                 (LUAD).
                 Methods: The gene-sequencing data of LUAD were applied from three Gene Expression Omnibus (GEO)
                 datasets—GSE10072, GSE32863 and GSE43458; the corresponding fractions of tumor-infiltrating immune
                 cells were extracted from the CIBERSORTx portal. Weighted gene coexpression network analysis (WGCNA)
                 and protein-protein interaction (PPI) network analysis were conducted to identify the significant module
                 and candidate genes related to Tregs. The role of candidate genes in LUAD was further verified using data
                 from The Cancer Genome Atlas (TCGA) database. Finally, we constructed a nomogram model to predict
                 the prognosis of LUAD by plotting Kaplan-Meier (K-M), receiver operating characteristic (ROC) and
                 calibration curves, which elucidated the performance of the nomogram.
                 Results: In total, 10,047 genes in 333 samples (196 tumor and 137 normal samples) from the GEO
                 database were included. By WGCNA and PPI analysis, we identified a significant black module and 36
                 candidate genes related to Treg. Next, the candidate genes were verified using TCGA data by Cox regression
                 analysis to screen 13 hub genes that stratified LUAD patients into low- or high-risk groups. Low-risk
                 patients showed a significantly longer overall survival (OS) than high-risk patients (3-year OS: 70.2% vs.
                 35.2%; 5-year OS: 36.6% vs. 0; P=1.651E-09), and the areas under the ROC curves (AUCs) showed good (3-
                 year AUC: 0.733; 5-year AUC: 0.777). Next, we constructed a survival nomogram combining the hub genes
                 and clinical parameters; the low-risk patients still showed a favorable prognosis compared with that of the
                 high-risk patients (P=7.073E-13), and the AUCs were better (3-year AUC: 0.763; 5-year AUC: 0.873).
                 Conclusions: We revealed the role of immune-infiltrating Treg-related genes in LUAD and constructed
                 a prognostic nomogram, which may help clinicians make optimal therapeutic decisions and help patients
                 obtain better outcomes.

                 Keywords: Tregs (regulatory T cells); lung adenocarcinoma (LUAD); Gene Expression Omnibus (GEO); TCGA;
                 WGCNA

                 Submitted Jul 06, 2020. Accepted for publication Nov 18, 2020.
                 doi: 10.21037/tlcr-20-822
                 View this article at: http://dx.doi.org/10.21037/tlcr-20-822

© Translational Lung Cancer Research. All rights reserved.            Transl Lung Cancer Res 2021;10(1):167-182 | http://dx.doi.org/10.21037/tlcr-20-822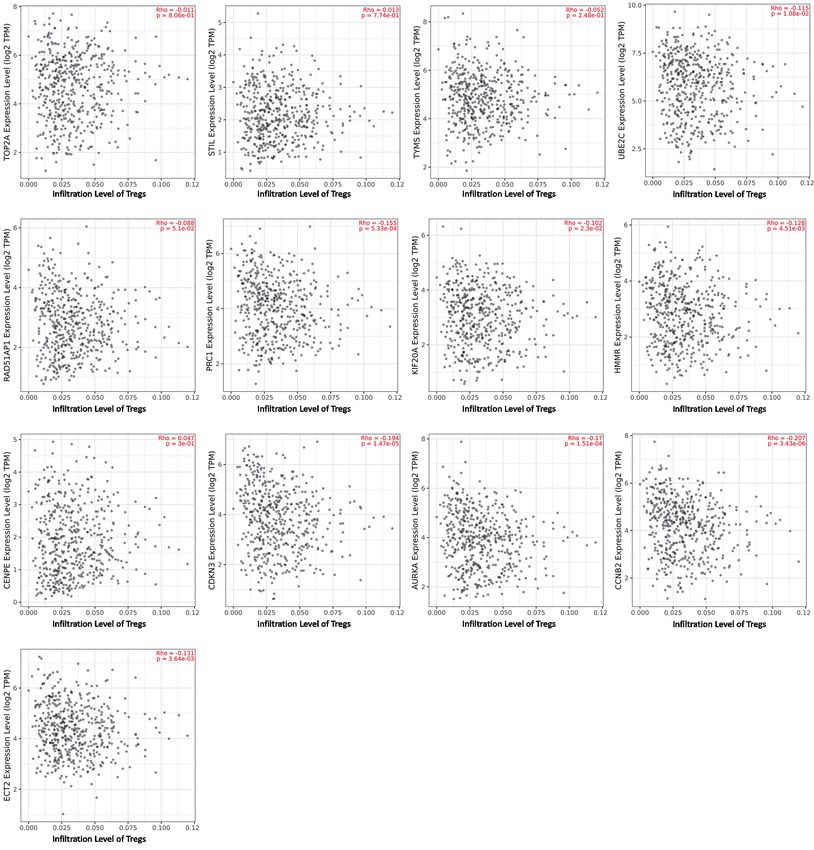
168                                                              Wang et al. A Treg-infiltrating nomogram for lung adenocarcinoma

Introduction                                                        sequen cin g datasets, GS E10072, GS E32863, a nd
                                                                    GSE43458, from the Gene Expression Omnibus (GEO)
Lung cancer is the leading cause of malignancy-related
                                                                    database and extracted the relevant fractions of 22 immune-
death worldwide, with approximately 2.2 million new cases
                                                                    infiltrating cells from the CIBERSORTx portal. Next,
and 1.9 million deaths worldwide in 2017 (1), despite great
                                                                    weighted gene coexpression network analysis (WGCNA)
progress in diagnosis and therapeutics over the years. As
                                                                    and protein-protein interaction (PPI) network analysis
the most prevailing histological type of lung cancer, lung
                                                                    were conducted to identify the most significant module
adenocarcinoma (LUAD) always derives from the acinar
                                                                    and candidate genes related to Tregs. The candidate genes
cells of the lung periphery and has a poor prognosis. This
                                                                    were then further validated using data from The Cancer
cause may be mainly due to the high heterogeneity of
                                                                    Genome Atlas (TCGA) database, and 13 hub genes were
LUAD and advanced stage of patients when diagnosed (2).
                                                                    screened. The correlation between hub genes and Tregs was
However, the current TNM (tumor size, lymph nodes and
                                                                    tested using Spearman’s method. Finally, we constructed
distant metastasis) staging system tends to be insufficient to
                                                                    a nomogram model combining the hub genes and clinical
accurately characterize and stage tumors at an early stage
                                                                    parameters, which showed a better performance to predict
and even after surgery (3,4), features that are necessary
                                                                    the risk of LUAD. The flow diagram of this study is shown
to design an optimal initial treatment plan and offer
                                                                    in Figure 1. We present the following article in accordance
adequate postoperative adjuvant therapy. Therefore, more
                                                                    with the TRIPOD reporting checklist (available at http://
complementary methods to enhance TNM staging and
                                                                    dx.doi.org/10.21037/tlcr-20-822).
identify the behavior of LUAD are needed.
   In recent years, our view of cancer has changed
drastically. Tumors are no longer regarded as simple                Methods
malignant masses or cells but as a complex tumor
                                                                    Data source and processing
microenvironment: tumor cells recruit other infiltrating
immune cell subpopulations to constitute a self-sufficient          The LUAD sequencing data were applied from three GEO
biological unit (5). The composition of the tumor                   (http://www.ncbi.nlm.nih.gov/geo/) datasets, GSE10072,
microenvironment varies in different patients and even in           GSE32863, and GSE43458. We used the sav and limma
the same type of cancer, such as different fractions of B           packages of R to perform batch calibration and data
cells, NK cells, M1/M2 macrophages, granulocytes, mast              normalization. When a gene corresponds to multiple
cells, CD8+ T cells, CD4+ helper T cells, and regulatory            probes, the mean value is taken as the final expression value.
T cells, which determine tumor characteristics and the
patient prognosis (6-8). Previous studies showed that the
                                                                    Estimation of immune infiltrating cells
expansion and accumulation of suppressive Tregs always
caused the development, metastasis and recurrence of                Using the sequencing data, we estimated the fractions of
multiple malignancies including lung cancer (9-12). Some            22 tumor-infiltrating immune cells using CIBERSORTx
studies found that FoxP3+CD4+Tregs infiltrating correlated          (https://cibersortx.stanford.edu/), an online tool that
negatively with the survival of small cell lung cancer (SCLC)       imputes gene expression profiles by a deconvolution
(13,14). Other researches on non-small cell lung cancer             algorithm and provides an estimated abundance of known
(NSCLC) revealed that whether in peripheral blood or                cell types within a mixed cell population (19).
intratumor, high level of Tregs was associated with high
metastasis and low survival rates (15-17). However, a study
                                                                    Construction of the coexpression network and module-trait
published in ‘Nature Immunology’ from Ferreira et al.,
                                                                    relationships
highlighted the role of type 1 Tregs in enhancing the
immunity barrier in peripheral tissues, which challenged the        The expression values of the 10,048 genes of the LUAD
classical view of Tregs in immunosuppression (18). Given            samples were used to construct a weight coexpression
that the role of Tregs (regulatory T cells) in tumors has           network employing the R package “WGCNA”, a biological
been controversial, we attempted to explore the potential           method used to integrate genes with coexpression into the
value of Tregs for LUAD.                                            same module. The correlations between the modules and
   In the present study, we integrated three LUAD                   sample traits are calculated to screen the models with a high

© Translational Lung Cancer Research. All rights reserved.   Transl Lung Cancer Res 2021;10(1):167-182 | http://dx.doi.org/10.21037/tlcr-20-822
Translational Lung Cancer Research, Vol 10, No 1 January 2021                                                                                           169

                                                  Sequencing data of LUAD from three GEO
                                                                 datasets

                                                                                           Calculation of the abundance of tumor-infiltrating
                                                                                               immune cells on the CIBERSORTx page.
                         Construction of the weighted co-
                       expression network analysis (WGCNA)
                                                                                            Selection of the fractions of 22 immune cells as
                                                                                                                   traits

                                                 Pearson’s correlation analysis: modules and
                                                                  the traits

                                                      The significant module and genes
                                                              ( related to Tregs)

                                                                                             Protein-protein interaction (PPI) network
                   Gene Ontology (GO) and Kyoto
                Encyclopedia of Genes and Genomes                Candidate genes
                (KEGG) pathway enrichment analyses
                                                                                           Download validation data: TCGA database

                                                                    Validation

                                                                                                           Kaplan-Meier (K-M) survival curve
                  3/5-year receiver operating
                                                       Cox proportional hazards model
                  characteristic (ROC) curves
                                                                                                       Validation of the Spearman’s correlations
                                                                                                           between the hub genes and Tregs

                                                             Risk scores (formula)

                                     Clinical parameters: age,
                                           gender, stage, T, N

                                                             Prognostic nomogram

                                         K-M curve               ROC curve             Calibration curve

Figure 1 Flow diagram of the study.

correlation with traits, and the genes in the modules are                            and the module with the highest correlation with Tregs was
analyzed to identify target genes (20).                                              selected for further study.
   Here, we used the fractions of 22 immune-infiltrating cells
as sample traits and chose an optimal soft threshold power (β)
                                                                                     Construction of the PPI network and identification of
to build a scaleless network when setting the index of scale-
                                                                                     candidate genes
free topologies as 0.90. Next, we assigned genes with similar
expression patterns to the same module (minimum size =30)                            From the significant module, we obtained Treg-related
using the “dynamic tree cutting” algorithm. Moreover, we                             module genes, with which the PPI network was developed
estimated the correlation of the module eigengenes with the                          using Search Tool for the Retrieval of Interacting Genes
infiltrating level of the 22 immune-infiltrating cells to screen                     (STRING; https://string-db.org/). Next, the PPI network
the significance of the modules by Pearson’s test. Finally, we                       was presented using Cytoscape (version 3.7.2), which is a free
selected the “Tregs (regulatory T cells)” subtype of interest                        app for visualizing sophisticated networks and integrating

© Translational Lung Cancer Research. All rights reserved.                 Transl Lung Cancer Res 2021;10(1):167-182 | http://dx.doi.org/10.21037/tlcr-20-822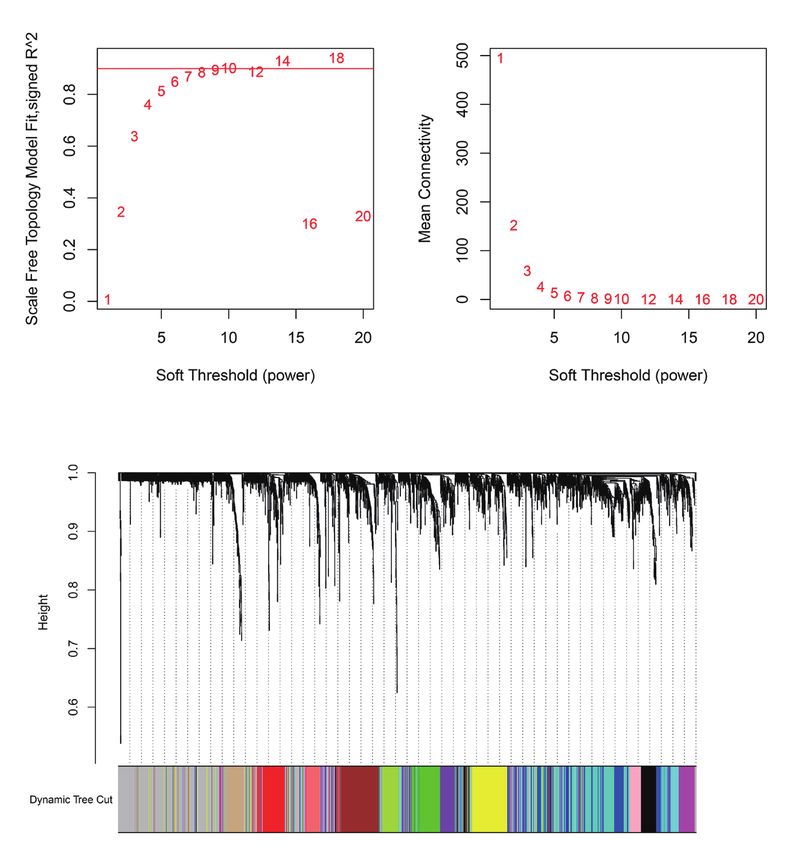
170                                                                  Wang et al. A Treg-infiltrating nomogram for lung adenocarcinoma

them with attribute data. The “CytoHubba” module of                     hub genes related to Tregs, Gene Ontology (GO) and
Cytoscape is a plug-in that recognizes hub genes in a network           Kyoto Encyclopedia of Genes and Genomes (KEGG)
based on the properties of nodes in a network (21), from                pathway enrichment analyses were performed in R using
which we screened the candidate genes related to Tregs.                 the packages org.Hs.eg.db, Cluster Profiler, enrichplot, and
                                                                        ggplot2 with both P values and q-values less than 0.05.
Verification of candidate genes using TCGA data and
screening of the hub genes                                              Construction and validation of the prognostic nomogram
                                                                        model for LUAD
To further verify the role of candidate genes in LUAD, we
applied gene sequencing and the corresponding completely                To apply the Treg-related genes better clinically, we
clinical data (375 LUAD and 48 normal samples) at the                   constructed a prognostic nomogram model for LUAD,
TCGA (https://portal.gdc.cancer.gov/) portal, from which                combining the risk score with traditional clinical parameters
we extracted the expression values of the Treg-related genes.           (age, gender, stage, T, N and M). A nomogram is an effective
The expression values of LUAD and normal tissues were                   tool that formulates the scoring criteria for all the variables
averaged using the “mean” function. Next, we used log2                  in the regression equation according to their regression
transform to normalize all the average expression values.               coefficients. Next, each patient receives a summed
Analysis of the statistically significant differences between           score, which can be converted into the probability of the
the LUAD and normal expression data was conducted                       outcome time of each patient through the function (22).
using the Wilcoxon signed-rank test built into R (version               We then performed ROC, calibration and K-M curve
3.6.3; https://www.r-project.org/), defining the threshold              analyses to elucidate the performance of the nomogram.
of |log(fold change)| no less than 1 and the false discovery
rate (FDR) less than 0.05. Finally, we implemented a Cox
proportional hazards model to screen the Treg-related hub               Statistical analysis
genes and their coefficients, from which the patients were              All statistical analyses and graphics were generated using
assigned a high- or low-risk score. The risk scores were                the R and Perl packages. A Cox proportional hazards model
calculated using the following formula: Risk score= ∑1 eg ∗ cg
                                                             n
                                                                        was applied to identify survival genes related to Tregs. K-M
(eg is the expression value of gene g in a sample; n is the             curve analysis was performed to show the differences in
number of independent indicators, and c g refers to the                 OS between the low- and high-risk groups, using the log-
regression coefficient of gene g in the Cox proportional                rank test to estimate the significance of the differences.
hazards model).                                                         The calibration curve, ROC curve and area under the curve
                                                                        (AUC) values were used to determine the efficacy of the
Validation of Treg-related hub genes                                    model. A P value less than 0.05 was defined as statistically
                                                                        significant.
The Kaplan-Meier (K-M) curve was illustrated to estimate                   The study was conducted in accordance with the
the differences in overall survival (OS) between the low-               Declaration of Helsinki (as revised in 2013).
and high-risk groups using the log-rank test to analyze the
statistical significance. Moreover, we implemented receiver
operating characteristic (ROC) curves to evaluate the                   Results
accuracy of grouping (low/high risk). Spearman’s correlation
                                                                        Gene sequencing data and estimation of immune-
between the Treg infiltration level and expression of hub
                                                                        infiltrating cells
genes was calculated using the data from Tumor Immune
Estimation Resource (TIMER2.0; http://timer.cistrome.                   We acquired the gene expression data of 10,048 genes
org/), and the results were visualized using the “ggstatsplot”          from 196 LUAD and 137 normal tissues from the GEO
package of R.                                                           database and calculated the abundance of 22 immune-
                                                                        infiltrating cells for each sample using the CIBERSORTx
                                                                        portal. Next, the fractions of 22 immune-infiltrating
Enrichment analysis of hub genes related to Tregs
                                                                        cells with gene expression data were selected as traits of
To identify tumor-related molecular mechanisms of the                   WGCNA.

© Translational Lung Cancer Research. All rights reserved.       Transl Lung Cancer Res 2021;10(1):167-182 | http://dx.doi.org/10.21037/tlcr-20-822
Translational Lung Cancer Research, Vol 10, No 1 January 2021 171
A Scale independence B Mean connectivity
C Gene dendrogram and module colors
Figure 2 Selection of the appropriate soft threshold (power) and construction of the hierarchical clustering tree. (A) Selection of the soft
threshold made the index of scale-free topologies reach 0.90. (B) Analysis of the average connectivity of 1–20 soft threshold power. (C)
Treg-related genes with similar expression patterns were merged into the same module using a dynamic tree-cutting algorithm, creating a
hierarchical clustering tree.
Coexpression network and protein-protein interaction related genes (Table S1) in the black module with P172 Wang et al. A Treg-infiltrating nomogram for lung adenocarcinoma
A Module-trait relationships
B
Figure 3 Heatmap of the correlations between the modules and immune-infiltrating cells (traits). (A) Within every square, the number on
the top refers to the coefficient between the cell infiltrating level and corresponding module, and the bottom is the P value. (B) The protein-
protein interaction network of Treg-related genes.
KIF20A, STIL, CDKN3, PRC1, AURKA, HMMR) and (HRs: 1.0030–2.6878; all PTranslational Lung Cancer Research, Vol 10, No 1 January 2021 173
Table 1 Univariate and multivariate cox regression analyses of Treg-related genes in lung adenocarcinoma
Univariate analysis Multivariate analysis
Genes
HR (95% CI) P HR (95% CI) P Coef
CCNB2 1.2865 (1.1052, 1.4975) 0.0011 0.5618 (0.3248, 0.9717) 0.0391 −0.5766
CENPF 1.3786 (1.1801, 1.6106) 0.0001
ECT2 1.3876 (1.1780, 1.6344) 0.0001 1.4995 (1.0674, 2.1066) 0.0195 0.4051
TPX2 1.2902 (1.1383, 1.4624) 0.0001
RAD51AP1 1.2278 (1.0348, 1.4568) 0.0187 0.5962 (0.3927, 0.9052) 0.0152 −0.5172
UBE2C 1.2097 (1.0799, 1.3551) 0.0010 1.1744 (0.938, 1.4706) 0.1610 0.1608
KIF11 1.4513 (1.2191, 1.7276) 0.0000
CDC20 1.2925 (1.1298, 1.4786) 0.0002
CENPE 1.6591 (1.3094, 2.1023) 0.0000 1.7341 (0.9894, 3.0393) 0.0545 0.5505
CEP55 1.3132 (1.1228, 1.5359) 0.0007
TOP2A 1.1981 (1.0513, 1.3654) 0.0067 0.6710 (0.4736, 0.9507) 0.0248 −0.3989
TYMS 1.4399 (1.2047, 1.7209) 0.0001 1.5270 (1.0734, 2.1721) 0.0186 0.4233
KIF20A 1.5165 (1.2591, 1.8266) 0.0000 1.4245 (0.9433, 2.1511) 0.0925 0.3538
ASPM 1.5214 (1.2596, 1.8375) 0.0000
BUB1 1.3451 (1.1377, 1.5903) 0.0005
TRIP13 1.2308 (1.0550, 1.4360) 0.0083
STIL 1.4508 (1.1313, 1.8605) 0.0034 0.5235 (0.2895, 0.9465) 0.0322 −0.6472
CDKN3 1.3521 (1.1623, 1.5730) 0.0001 1.3149 (0.9192, 1.8809) 0.1339 0.2738
PTTG1 1.4207 (1.1964, 1.6871) 0.0001
MCM4 1.2973 (1.0940, 1.5385) 0.0028
MCM6 1.3489 (1.0960, 1.6602) 0.0047
DEPDC1 1.4407 (1.2008, 1.7286) 0.0001
NUSAP1 1.3527 (1.1465, 1.5960) 0.0003
MCM2 1.2728 (1.0766, 1.5049) 0.0047
PRC1 1.4413 (1.2203, 1.7022) 0.0000 1.6418 (1.0030, 2.6873) 0.0486 0.4958
KNTC1 1.3367 (1.0618, 1.6826) 0.0135
AURKA 1.2579 (1.0781, 1.4677) 0.0036 0.7174 (0.5122, 1.0049) 0.0534 −0.3321
PAICS 1.4356 (1.1493, 1.7933) 0.0014
MELK 1.3452 (1.1507, 1.5726) 0.0002
HMMR 1.4166 (1.1914, 1.6844) 0.0001 1.4713 (1.0176, 2.1274) 0.0401 0.3862
TTK 1.3397 (1.1229, 1.5984) 0.0012
PBK 1.2934 (1.1217, 1.4914) 0.0004
CCNB1 1.3997 (1.1978, 1.6355) 0.0000
HR, hazard ratio; Coef, regression coefficient of genes in the multivariate Cox regression analysis.
© Translational Lung Cancer Research. All rights reserved. Transl Lung Cancer Res 2021;10(1):167-182 | http://dx.doi.org/10.21037/tlcr-20-822174 Wang et al. A Treg-infiltrating nomogram for lung adenocarcinoma
A B
Figure 4 K-M and ROC curves based on the risk score model. (A) K-M curve of the high-risk (red) and low-risk (blue) LUAD patients. (B)
Three-year (red) and five-year (blue) ROC curves of the risk score model.
and high-risk groups. To t e s t t h e d i s c r i m i n a b i l i t y o f t h e m o d e l , w e
K-M survival curve analysis was performed to determine implemented the calibration curve, which is used to assess
the difference between the two groups. The median survival the accuracy of the (disease) risk model in predicting the
time of the low-risk patients was 4.38 years, while that of probability of an individual outcome event in the future and
the high-risk patients was 2.48 years (Figure 4A). The low- reflects the degree of consistency between the predicted
risk patients had a significantly better OS than the high-risk model risk and actual occurrence risk (23). In the study,
patients (3-year OS: 70.2% vs. 35.2%; 5-year OS: 36.6% the calibration curves showed that the predicted survival
vs. 0; P=1.651E-09), and the areas under the ROC curve rate was consistent with the actual incidence rate within
(AUCs) were good (3-year AUC: 0.733; 5-year AUC: 0.777) 3/5 years (Figure 7A,B). Moreover, we plotted the K–
(Figure 4B). M curve, which showed good discriminating ability of
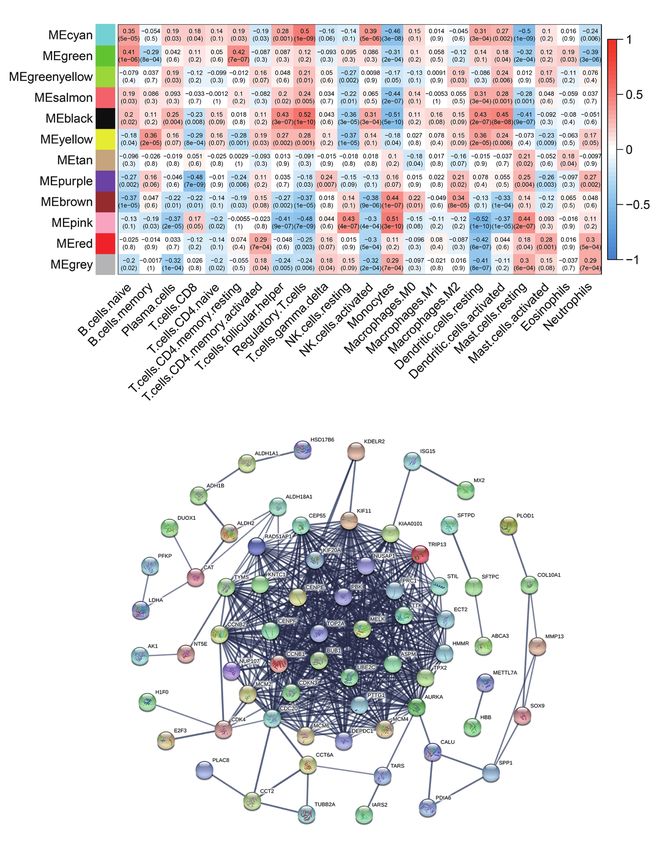
Spearman’s correlation between the Treg infiltration the nomogram (P=7.073e−13) (Figure 8A), and the AUC
level and expression level of 13 hub genes were illustrated was improved (3-year AUC: 0.763; 5-year AUC: 0.873)
using the R package “ggstatsplot” (Figure 5). Of the (Figure 8B).
13 hub genes, we found that the expression levels of
AURKA, CCNB2, CDKN3, ECT2, HMMR, KIF20A,
GO and KEGG pathway enrichment analyses
PRC1, UBE2C, RAD51AP1, TOP2A and TYMS all had
a positive correlation with Treg infiltration in the tumor To identify molecular mechanisms of the candidate genes
microenvironment. By contrast, the correlation between the in LUAD, GO and KEGG pathway enrichment analyses
gene expression (of CENPE and STIL) and the infiltration were performed (Table 2). GO analysis includes 3 categories:
level was negative. biological processes (BP), cellular components (CC) and
molecular function (MF). We found that the top enriched
terms were (mitotic) nuclear division, spindle organization,
Prognostic nomogram model for LUAD: construction and
organelle fission and chromosome segregation in BP;
validation
spindle, kinetochore and chromosome/centromeric region
To apply Treg-related genes to clinical use, we constructed a in CC; protein serine/threonine kinase activity, DNA-
nomogram model, combining the risk score with traditional dependent ATPase activity and catalytic activity, acting on
clinical indicators, to predict the prognosis of LUAD. DNA in MF (Figure 9A). For KEGG enrichment pathways,
Given the high correlation between pathologic staging of M the Treg-related hub genes were mostly enriched in the
and T/N/stage, we finally included five clinical indicators cell cycle, oocyte meiosis, DNA replication, p53 signaling
(age, gender, stage, T and N) in the model (Figure 6). pathway, human T-cell leukemia virus 1 infection, cellular
© Translational Lung Cancer Research. All rights reserved. Transl Lung Cancer Res 2021;10(1):167-182 | http://dx.doi.org/10.21037/tlcr-20-822Translational Lung Cancer Research, Vol 10, No 1 January 2021 175 Figure 5 Spearman’s correlations between 13 candidate genes and the infiltration level of Tregs (the “Rho” in the pictures indicates the Spearman’s rank correlation coefficient, and “p” indicates the P value). © Translational Lung Cancer Research. All rights reserved. Transl Lung Cancer Res 2021;10(1):167-182 | http://dx.doi.org/10.21037/tlcr-20-822
176                                                                       Wang et al. A Treg-infiltrating nomogram for lung adenocarcinoma

Figure 6 Prognostic nomogram for lung adenocarcinoma. According to the 6 variables (age, gender, stage, pathologic_T, pathologic_N
and riskScore) in the model, 6 corresponding “points” values can be obtained, and the “total points” can be calculated by summing them.
Therefore, the 3-/5-year survival rate of patients can be predicted

                 A                                                      B

Figure 7 Calibration curve of the nomogram model at the 3-/5-year survival. Good concordance was obtained at the 3-year (A) and 5-year (B)
year survivals of the nomogram-predicted probability with the actual survival.

senescence and ubiquitin-mediated proteolysis (Figure 9B).                   revealed that the infiltration of inflammatory cells
                                                                             and lymphocytes is an important activity of the tumor
                                                                             microenvironment that may impact tumorigenesis, invasion,
Discussion
                                                                             metastasis, and prognosis. Therefore, increasing emphasis
As the predominant histological phenotype of lung cancer,                    has been placed on immune infiltration cell targeting
LUAD has a poor prognosis with a 5-year survival rate                        compared with direct tumor cell killing (28). In recent
less than 25% (24,25), likely because of its undetected                      years, immunotherapy for LUAD has advanced rapidly and
pathogenesis and complicated patterns of invasive growth,                    has been markedly beneficial to patients (29). The 2018
such as lymphovascular invasion, pleural invasion, and                       Nobel Prize in physiology and medicine was awarded to
aerogenous invasion (26,27). Histopathological analysis                      Professor James P. Allison, and Professor Tasuku Honjo for

© Translational Lung Cancer Research. All rights reserved.            Transl Lung Cancer Res 2021;10(1):167-182 | http://dx.doi.org/10.21037/tlcr-20-822
Translational Lung Cancer Research, Vol 10, No 1 January 2021 177
A B
P=7.073e–13
Figure 8 K-M and ROC curves based on the nomogram model. (A) K-M curve of high-risk (red) and low-risk (blue) LUAD patients. (B)
Three-year (red) and five-year (blue) ROC curves of the risk score model.
their contribution to immune checkpoint therapy. To date, nomogram for LUAD, integrating the Treg-related risk
antibodies against PD-1/L1—nivolumab, pembrolizumab, score with traditional clinical parameters (age, gender, stage,
cemiplimab, atezolizumab, durvalumab and avelumab—have T and N). The AUC value and calibration curve indicated
been approved by the U.S. Food and Drug Administration that the nomogram performed better. Additionally, GO
(FDA) for first-line and/or late-stage treatment of 17 enrichment analysis revealed that the prognostic Treg-
cancers (including NSCLC) (30,31). Pembrolizumab has related genes were mainly enriched in BP involving cell
been recommended for non-squamous cell carcinoma proliferation, such as mitosis, chromosome separation, and
patients with high PD-L1 expression levels (tumor DNA replicase activity. For the KEGG pathway analysis,
proportion score ≥50%) (32). However, the intratumor or Treg-related genes were mostly involved in the cell cycle,
inter-tumor heterogeneity and the non-standardized cut- DNA replication and ubiquitin-mediated proteolysis, which
off values for PD-1/L1, tumor mutation burden (TMB) and were similar to the GO enriched terms for the cell cycle.
other independent immune-related biomarkers are far from This may reflect the reason for Treg enrichment in the
being efficient (33-36). Thus, more potential and effective tumor microenvironment, a finding that was consistent
biomarkers are required. with that in previous studies (37-39). Moreover, the p53
In this study, we integrated three different GEO and FoxO signaling pathways were included in the KEGG
datasets (GSE10072/GSE32863/GSE43458) and obtained enriched pathways. P53 is a tumor suppressor that monitors
196 LUAD and 137 normal samples. First, we acquired the cell cycle, maintains genomic stability by participating
the abundances of 22 tumor-infiltrating immune cells in DNA repair and is coexpressed with angiogenic genes
using a deconvolution algorithm with the help of the such as Smad4 to inhibit tumor angiogenesis (40,41). FoxO
CIBERSORTx portal, and then we identified candidate is a nuclear protein subfamily that mediates the inhibition
modules (black) and 36 candidate genes highly related to of insulin or insulin-like growth factor to further influence
Tregs using the method of weighting gene coexpression cell cycle regulation, energy metabolism, protein stability,
network and PPIs. To verify the Treg-related genes, we oxidative stress, apoptosis, and immunity (42,43).
generated the expression data of Treg-related genes as Akimova et al. found that the number and inhibitory
well as the clinical parameters from the TCGA database function of Treg intratumor were significantly higher
and then implemented a Cox proportional hazards model than those in blood, lungs and lymph nodes by single-cell
to calculate a risk score for each LUAD patient. The studies (37,38). Conventional research has highlighted
model performed well in that the low-risk patients had the protective role of Tregs in alleviating inflammation
significantly longer 3- and 5-year survival times than the in autoimmune diseases (44). Xie et al. showed that Tregs
high-risk patients. Moreover, to further apply the Treg- recruited to tumors played a role as “accomplices” in
related risk score in the clinic, we constructed a prognostic helping tumor cells escape immunological surveillance (45).
© Translational Lung Cancer Research. All rights reserved. Transl Lung Cancer Res 2021;10(1):167-182 | http://dx.doi.org/10.21037/tlcr-20-822178 Wang et al. A Treg-infiltrating nomogram for lung adenocarcinoma
Table 2 GO and KEGG pathway enrichment analysis of candidate genes in the most significant terms
Terms ID Description Gene ratio Padjust Gene ID Count
Biological GO:0000280 Nuclear division 15/35 4.15E-14 CENPF/TPX2/UBE2C/KIF11/CDC20/CENPE/ 15
process TOP2A/ASPM/TRIP13/NUSAP1/PRC1/KNTC1/
AURKA/TTK/CCNB1
GO:0048285 Organelle fission 15/35 8.22E-14 CENPF/TPX2/UBE2C/KIF11/CDC20/CENPE/ 15
TOP2A/ASPM/TRIP13/NUSAP1/PRC1/KNTC1/
AURKA/TTK/CCNB1
GO:0140014 Mitotic nuclear 13/35 8.22E-14 CENPF/TPX2/UBE2C/KIF11/CDC20/CENPE/ 13
division TRIP13/NUSAP1/PRC1/KNTC1/AURKA/TTK/
CCNB1
GO:0007088 Regulation of mitotic 11/35 6.79E-13 CENPF/UBE2C/KIF11/CDC20/CENPE/TRIP13/ 11
nuclear division NUSAP1/KNTC1/AURKA/TTK/CCNB1
GO:0051783 Regulation of nuclear 11/35 2.50E-12 CENPF/UBE2C/KIF11/CDC20/CENPE/TRIP13/ 11
division NUSAP1/KNTC1/AURKA/TTK/CCNB1
GO:0007051 Spindle organization 10/35 2.06E-11 TPX2/KIF11/CDC20/CENPE/ASPM/STIL/ 10
PRC1/AURKA/TTK/CCNB1
GO:1902850 Microtubule 9/35 1.01E-10 TPX2/KIF11/CDC20/CENPE/STIL/NUSAP1/ 9
cytoskeleton PRC1/TTK/CCNB1
organization involved
in mitosis
GO:0007059 Chromosome 11/35 2.72E-10 CENPF/ECT2/CDC20/CENPE/TOP2A/BUB1/ 11
segregation TRIP13/NUSAP1/PRC1/TTK/CCNB1
GO:0051983 Regulation of 8/35 6.96E-10 CENPF/ECT2/CDC20/CENPE/BUB1/TRIP13/ 8
chromosome TTK/CCNB1
segregation
GO:0098813 Nuclear chromosome 10/35 6.96E-10 CENPF/ECT2/CDC20/CENPE/BUB1/TRIP13/ 10
segregation NUSAP1/PRC1/TTK/CCNB1
Cellular GO:0005819 Spindle 13/35 8.73E-13 CENPF/ECT2/TPX2/KIF11/CDC20/CENPE/ 13
component KIF20A/ASPM/PRC1/KNTC1/AURKA/TTK/
CCNB1
GO:0000922 Spindle pole 9/35 2.76E-10 CENPF/TPX2/KIF11/CDC20/ASPM/PRC1/ 9
KNTC1/AURKA/CCNB1
GO:0030496 Midbody 8/35 2.02E-08 CENPF/ECT2/CENPE/CEP55/KIF20A/ASPM/ 8
PRC1/AURKA
GO:0098687 Chromosomal region 9/35 1.62E-07 CENPF/CENPE/BUB1/MCM4/MCM6/MCM2/ 9
KNTC1/TTK/CCNB1
GO:0072686 Mitotic spindle 6/35 3.66E-07 ECT2/TPX2/KIF11/CENPE/ASPM/AURKA 6
GO:0005876 Spindle microtubule 5/35 5.84E-07 KIF11/CENPE/PRC1/KNTC1/AURKA 5
GO:0000776 Kinetochore 6/35 1.48E-06 CENPF/CENPE/BUB1/KNTC1/TTK/CCNB1 6
GO:0005813 Centrosome 9/35 1.48E-06 CCNB2/CENPF/CDC20/CEP55/ASPM/STIL/ 9
AURKA/HMMR/CCNB1
GO:0042555 MCM complex 3/35 7.85E-06 MCM4/MCM6/MCM2 3
GO:0000775 Chromosome, 6/35 7.85E-06 CENPF/CENPE/BUB1/KNTC1/TTK/CCNB1 6
centromeric region
Table 2 (continued)
© Translational Lung Cancer Research. All rights reserved. Transl Lung Cancer Res 2021;10(1):167-182 | http://dx.doi.org/10.21037/tlcr-20-822Translational Lung Cancer Research, Vol 10, No 1 January 2021 179
Table 2 (continued)
Terms ID Description Gene ratio Padjust Gene ID Count
Molecular GO:0004674 Protein serine/ 6/35 9.86E-03 BUB1/AURKA/CDK4/MELK/TTK/PBK 6
function threonine kinase
activity
GO:0008094 DNA-dependent 3/35 2.04E-02 TOP2A/MCM4/MCM6 3
ATPase activity
GO:0016538 Cyclin-dependent 2/35 2.04E-02 CDK4/CCNB1 2
protein serine/
threonine kinase
regulator activity
GO:0003697 Single-stranded DNA 3/35 2.07E-02 RAD51AP1/MCM4/MCM6 3
binding
GO:0004003 ATP-dependent DNA 2/35 3.66E-02 MCM4/MCM6 2
helicase activity
GO:0004386 Helicase activity 3/35 3.80E-02 MCM4/MCM6/MCM2 3
GO:0004712 Protein serine/ 2/35 4.11E-02 AURKA/TTK 2
threonine/tyrosine
kinase activity
GO:0003678 DNA helicase activity 2/35 4.11E-02 MCM4/MCM6 2
GO:0140097 Catalytic activity, 3/35 4.11E-02 TOP2A/MCM4/MCM6 3
acting on DNA
GO:0008026 ATP-dependent 2/35 4.62E-02 MCM4/MCM6 2
helicase activity
KEGG hsa04110 Cell cycle 10/17 9.47E-15 CCNB2/CDC20/BUB1/PTTG1/MCM4/MCM6/ 10
pathways MCM2/CDK4/TTK/CCNB1
hsa04114 Oocyte meiosis 6/17 1.56E-07 CCNB2/CDC20/BUB1/PTTG1/AURKA/CCNB1 6
hsa04914 Progesterone- 4/17 4.57E-05 CCNB2/BUB1/AURKA/CCNB1 4
mediated oocyte
maturation
hsa03030 DNA replication 3/17 5.39E-05 MCM4/MCM6/MCM2 3
hsa04115 p53 signaling pathway 3/17 4.47E-04 CCNB2/CDK4/CCNB1 3
hsa05166 Human T-cell leukemia 4/17 9.68E-04 CCNB2/CDC20/PTTG1/CDK4 4
virus 1 infection
hsa04218 Cellular senescence 3/17 4.00E-03 CCNB2/CDK4/CCNB1 3
hsa04068 FoxO signaling 2/17 3.06E-02 CCNB2/CCNB1 2
pathway
hsa04120 Ubiquitin mediated 2/17 3.46E-02 UBE2C/CDC20 2
proteolysis
hsa00670 One carbon pool by 1/17 4.15E-02 TYMS 1
folate
GO, Gene Ontology; KEGG, Kyoto Encyclopedia of Genes and Genomes.
© Translational Lung Cancer Research. All rights reserved. Transl Lung Cancer Res 2021;10(1):167-182 | http://dx.doi.org/10.21037/tlcr-20-822180 Wang et al. A Treg-infiltrating nomogram for lung adenocarcinoma
A B
Figure 9 Gene Ontology (GO) functional annotation and Kyoto Encyclopedia of Genes and Genomes (KEGG) pathway enrichment
analyses. (A) Enriched GO terms. The changing colors from blue to red elucidate the Padjust value increasing, and the length of the bar
indicates the numbers of gene enrichment terms. (B) Enriched KEGG pathways. The depth of red indicates the size of the Z value, and the
number of blue points indicates the number of enriched genes.
Shimizu et al. and Marshall et al. revealed that the Acknowledgments
enrichment of Tregs in tumors usually indicates a poor
Funding: This work was supported by the National Natural
prognosis (16,46). However, the latest discovery of Ferreira
Science Foundation of China (No. 81772488).
et al. found that Tregs promoted the differentiation of
CD8+ effector memory T cells into tissue-resident memory
T cells by providing the necessary cytokines, yielding more Footnote
effective antitumor immunity (18). Therefore, studying the
role of Treg cell infiltration into tumor tissue may provide Reporting Checklist: The authors have completed the
a new perspective for immunotherapy or prognosis of TRIPOD reporting checklist. Available at http://dx.doi.
LUAD. org/10.21037/tlcr-20-822
Infiltrating Tregs in the tumor microenvironment play
a potentially important role, which has been partially Conflicts of Interest: All authors have completed the ICMJE
confirmed and applied in our study. However, this study uniform disclosure form (available at http://dx.doi.
has certain limitations. Although we drew the conclusion org/10.21037/tlcr-20-822). The authors have no conflicts of
through multiple sequencing data and across different interest to declare.
databases, more studies are needed to verify our results.
Additionally, our results were obtained at the transcriptome Ethical Statement: The authors are accountable for all
level, and more proteomics level validation and clinical aspects of the work in ensuring that questions related
trials are needed to accelerate the clinical application. to the accuracy or integrity of any part of the work are
appropriately investigated and resolved. The study was
conducted in accordance with the Declaration of Helsinki (as
Conclusions
revised in 2013).
We provide insights into the roles of Treg-related genes
in LUAD and constructed a promising nomogram, which Open Access Statement: This is an Open Access article
may help clinicians formulate more adequate treatment and distributed in accordance with the Creative Commons
follow-up plans. Attribution-NonCommercial-NoDerivs 4.0 International
© Translational Lung Cancer Research. All rights reserved. Transl Lung Cancer Res 2021;10(1):167-182 | http://dx.doi.org/10.21037/tlcr-20-822Translational Lung Cancer Research, Vol 10, No 1 January 2021 181
License (CC BY-NC-ND 4.0), which permits the non- 13. Koyama K, Kagamu H, Miura S, et al. Reciprocal
commercial replication and distribution of the article with CD4+ T-cell balance of effector CD62Llow CD4+ and
the strict proviso that no changes or edits are made and the CD62LhighCD25+ CD4+ regulatory T cells in small
original work is properly cited (including links to both the cell lung cancer reflects disease stage. Clin Cancer Res
formal publication through the relevant DOI and the license). 2008;14:6770-9.
See: https://creativecommons.org/licenses/by-nc-nd/4.0/. 14. Wang W, Hodkinson P, McLaren F, et al. Small cell lung
cancer tumour cells induce regulatory T lymphocytes, and
patient survival correlates negatively with FOXP3+ cells in
References
tumour infiltrate. Int J Cancer 2012;131:E928-37.
1. Fitzmaurice C, Abate D, Abbasi N, et al. Global, Regional, 15. Petersen RP, Campa MJ, Sperlazza J, et al. Tumor
and National Cancer Incidence, Mortality, Years of infiltrating Foxp3+ regulatory T-cells are associated with
Life Lost, Years Lived With Disability, and Disability- recurrence in pathologic stage I NSCLC patients. Cancer
Adjusted Life-Years for 29 Cancer Groups, 1990 to 2017: 2006;107:2866-72.
A Systematic Analysis for the Global Burden of Disease 16. Shimizu K, Nakata M, Hirami Y, et al. Tumor-
Study. JAMA Oncol 2019;5:1749-68. infiltrating Foxp3+ regulatory T cells are correlated with
2. Senosain MF, Massion PP. Intratumor Heterogeneity in cyclooxygenase-2 expression and are associated with
Early Lung Adenocarcinoma. Front Oncol 2020;10:349. recurrence in resected non-small cell lung cancer. J Thorac
3. He R, Zuo S. A Robust 8-Gene Prognostic Signature for Oncol 2010;5:585-90.
Early-Stage Non-small Cell Lung Cancer. Front Oncol 17. Erfani N, Mehrabadi SM, Ghayumi MA, et al. Increase of
2019;9:693. regulatory T cells in metastatic stage and CTLA-4 over
4. Wang X, Yao S, Xiao Z, et al. Development and validation expression in lymphocytes of patients with non-small cell
of a survival model for lung adenocarcinoma based on lung cancer (NSCLC). Lung Cancer 2012;77:306-11.
autophagy-associated genes. J Transl Med 2020;18:149. 18. Ferreira C, Barros L, Baptista M, et al. Type 1 Treg cells
5. Peltanova B, Raudenska M, Masarik M. Effect of tumor promote the generation of CD8(+) tissue-resident memory
microenvironment on pathogenesis of the head and neck T cells. Nat Immunol 2020;21:766-76.
squamous cell carcinoma: a systematic review. Mol Cancer 19. Rusk N. Expanded CIBERSORTx. Nat Methods
2019;18:63. 2019;16:577.
6. Bremnes RM, Busund LT, Kilvaer TL, et al. The Role 20. Langfelder P, Horvath S. WGCNA: an R package
of Tumor-Infiltrating Lymphocytes in Development, for weighted correlation network analysis. BMC
Progression, and Prognosis of Non-Small Cell Lung Bioinformatics 2008;9:559.
Cancer. J Thorac Oncol 2016;11:789-800. 21. Jayaraman A, Jamil K, Khan HA. Identifying new targets
7. Whiteside TL. The tumor microenvironment and its role in leukemogenesis using computational approaches. Saudi
in promoting tumor growth. Oncogene 2008;27:5904-12. J Biol Sci 2015;22:610-22.
8. Schreiber RD, Old LJ, Smyth MJ. Cancer immunoediting: 22. Mattes MD, Weber WA, Foster A, et al. A Predictive
integrating immunity's roles in cancer suppression and Model for Lymph Node Involvement with Malignancy
promotion. Science 2011;331:1565-70. on PET/CT in Non-Small-Cell Lung Cancer. J Thorac
9. Beyer M, Schultze JL. Regulatory T cells in cancer. Blood Oncol 2015;10:1207-12.
2006;108:804-11. 23. Huang YQ, Liang CH, He L, et al. Development and
10. Ganesan AP, Johansson M, Ruffell B, et al. Tumor- Validation of a Radiomics Nomogram for Preoperative
infiltrating regulatory T cells inhibit endogenous cytotoxic Prediction of Lymph Node Metastasis in Colorectal
T cell responses to lung adenocarcinoma. J Immunol Cancer. J Clin Oncol 2016;34:2157-64.
2013;191:2009-17. 24. Li Y, Tao L, Cai W. Profiles of Immune Infiltration and
11. Domagala-Kulawik J, Osinska I, Hoser G. Mechanisms of Prognostic Immunoscore in Lung Adenocarcinoma.
immune response regulation in lung cancer. Transl Lung Biomed Res Int 2020;2020:5858092.
Cancer Res 2014;3:15-22. 25. Zhang P, Li S, Lv C, et al. BPI-9016M, a c-Met inhibitor,
12. Vinay DS, Ryan EP, Pawelec G, et al. Immune evasion in suppresses tumor cell growth, migration and invasion of
cancer: Mechanistic basis and therapeutic strategies. Semin lung adenocarcinoma via miR203-DKK1. Theranostics
Cancer Biol 2015;35 Suppl:S185-98. 2018;8:5890-902.
© Translational Lung Cancer Research. All rights reserved. Transl Lung Cancer Res 2021;10(1):167-182 | http://dx.doi.org/10.21037/tlcr-20-822182 Wang et al. A Treg-infiltrating nomogram for lung adenocarcinoma
26. Shih AR, Mino-Kenudson M. Updates on spread 36. Keenan TE, Burke KP, Van Allen EM. Genomic correlates
through air spaces (STAS) in lung cancer. Histopathology of response to immune checkpoint blockade. Nat Med
2020;77:173-80. 2019;25:389-402.
27. Travis WD, Brambilla E, Nicholson AG, et al. The 37. Akimova T, Zhang T, Negorev D, et al. Human lung
2015 World Health Organization Classification of Lung tumor FOXP3+ Tregs upregulate four "Treg-locking"
Tumors: Impact of Genetic, Clinical and Radiologic transcription factors. JCI Insight 2017;2:e94075.
Advances Since the 2004 Classification. J Thorac Oncol 38. Ward-Hartstonge KA, Kemp RA. Regulatory T-cell
2015;10:1243-60. heterogeneity and the cancer immune response. Clin
28. Pilipow K, Darwich A, Losurdo A. T-cell-based breast Transl Immunology 2017;6:e154.
cancer immunotherapy. Semin Cancer Biol 2020. [Epub 39. Baratelli F, Lee JM, Hazra S, et al. PGE(2) contributes
ahead of print]. doi: 10.1016/j.semcancer.2020.05.019. to TGF-beta induced T regulatory cell function in
29. Reck M, Rodriguez-Abreu D, Robinson AG, et al. human non-small cell lung cancer. Am J Transl Res
Pembrolizumab versus Chemotherapy for PD-L1- 2010;2:356-67.
Positive Non-Small-Cell Lung Cancer. N Engl J Med 40. Tollini LA, Jin A, Park J, et al. Regulation of p53 by Mdm2
2016;375:1823-33. E3 ligase function is dispensable in embryogenesis and
30. Topalian SL, Taube JM, Pardoll DM. Neoadjuvant development, but essential in response to DNA damage.
checkpoint blockade for cancer immunotherapy. Science Cancer Cell 2014;26:235-47.
2020;367:eaax0182. 41. Fan G, Tu Y, Chen C, et al. DNA methylation biomarkers
31. Santarpia M, Aguilar A, Chaib I, et al. Non-Small-Cell for hepatocellular carcinoma. Cancer Cell Int 2018;18:140.
Lung Cancer Signaling Pathways, Metabolism, and PD-1/ 42. Peixoto MS, da Silva Junior FC, de Oliveira Galvao MF,
PD-L1 Antibodies. Cancers (Basel) 2020;12:1475. et al. Oxidative stress, mutagenic effects, and cell death
32. Hanna NH, Schneider BJ, Temin S, et al. Therapy for induced by retene. Chemosphere 2019;231:518-27.
Stage IV Non-Small-Cell Lung Cancer Without Driver 43. Wu Y, Peng H, Cui M, et al. CXCL12 increases
Alterations: ASCO and OH (CCO) Joint Guideline human neural progenitor cell proliferation through
Update. J Clin Oncol 2020;38:1608-32. Akt-1/FOXO3a signaling pathway. J Neurochem
33. Greillier L, Tomasini P, Barlesi F. The clinical utility of 2009;109:1157-67.
tumor mutational burden in non-small cell lung cancer. 44. Miyara M, Ito Y, Sakaguchi S. TREG-cell therapies for
Transl Lung Cancer Res 2018;7:639-46. autoimmune rheumatic diseases. Nat Rev Rheumatol
34. Dempke WCM, Fenchel K, Dale SP. Programmed cell 2014;10:543-51.
death ligand-1 (PD-L1) as a biomarker for non-small cell 45. Xie M, Wei J, Xu J. Inducers, Attractors and Modulators
lung cancer (NSCLC) treatment-are we barking up the of CD4(+) Treg Cells in Non-Small-Cell Lung Cancer.
wrong tree? Transl Lung Cancer Res 2018;7:S275-9. Front Immunol 2020;11:676.
35. Bai X, Wu DH, Ma SC, et al. Development and validation 46. Marshall EA, Ng KW, Kung SH, et al. Emerging roles
of a genomic mutation signature to predict response to of T helper 17 and regulatory T cells in lung cancer
PD-1 inhibitors in non-squamous NSCLC: a multicohort progression and metastasis. Mol Cancer 2016;15:67.
study. J Immunother Cancer 2020;8:e000381.
Cite this article as: Wang X, Xiao Z, Gong J, Liu Z, Zhang M,
Zhang Z. A prognostic nomogram for lung adenocarcinoma
based on immune-infiltrating Treg-related genes: from bench
to bedside. Transl Lung Cancer Res 2021;10(1):167-182. doi:
10.21037/tlcr-20-822
© Translational Lung Cancer Research. All rights reserved. Transl Lung Cancer Res 2021;10(1):167-182 | http://dx.doi.org/10.21037/tlcr-20-822Supplementary Table S1 Treg-related genes in the black module within the WGCNA Genes geneSymbol moduleColor correlation pvalue KCNN4 KCNN4 black 0.575150544 5.48E-13 SFTPC SFTPC black -0.565568309 1.60E-12 NMU NMU black 0.536306398 3.41E-11 PTTG1 PTTG1 black 0.535131806 3.83E-11 UBE2C UBE2C black 0.53294386 4.76E-11 CDH3 CDH3 black 0.522132089 1.36E-10 PRC1 PRC1 black 0.521329867 1.46E-10 ADH1B ADH1B black -0.511965354 3.51E-10 MCM2 MCM2 black 0.507713866 5.18E-10 CENPF CENPF black 0.502760059 8.09E-10 HBB HBB black -0.49096442 2.28E-09 MOCOS MOCOS black 0.486294241 3.39E-09 MCM4 MCM4 black 0.477216289 7.24E-09 PFKP PFKP black 0.472008662 1.11E-08 PLAU PLAU black 0.468830381 1.43E-08 TOP2A TOP2A black 0.464486642 2.02E-08 CDC20 CDC20 black 0.462223397 2.42E-08 ALDH1A1 ALDH1A1 black -0.453478065 4.75E-08 ALDH18A1 ALDH18A1 black 0.452147529 5.26E-08 CCNB2 CCNB2 black 0.449112061 6.61E-08 SEMA3D SEMA3D black -0.438979613 1.40E-07 NUSAP1 NUSAP1 black 0.438663793 1.43E-07 MMP13 MMP13 black 0.435259827 1.83E-07 CEP55 CEP55 black 0.433914001 2.02E-07 SOX4 SOX4 black 0.432285428 2.27E-07 SOX9 SOX9 black 0.431245589 2.44E-07 KDELR2 KDELR2 black 0.429892775 2.69E-07 TNFRSF21 TNFRSF21 black 0.426985404 3.30E-07 DNAJC12 DNAJC12 black 0.426584086 3.39E-07 KIF11 KIF11 black 0.424923066 3.81E-07 LDHA LDHA black 0.416864203 6.62E-07 STIL STIL black 0.416343124 6.86E-07 TPX2 TPX2 black 0.413116763 8.53E-07 ADRB2 ADRB2 black -0.407874503 1.21E-06 PUS7 PUS7 black 0.404488471 1.51E-06 ASPM ASPM black 0.404203158 1.54E-06 PGC PGC black -0.401771557 1.80E-06 MX2 MX2 black 0.399563346 2.07E-06 E2F3 E2F3 black 0.399303513 2.11E-06 CAT CAT black -0.397370401 2.38E-06 PCP4 PCP4 black 0.396071437 2.59E-06 C1orf21 C1orf21 black -0.39527342 2.72E-06 SCG5 SCG5 black 0.39410399 2.93E-06 TTK TTK black 0.392581529 3.23E-06 SPP1 SPP1 black 0.388746907 4.10E-06 KIF20A KIF20A black 0.387189755 4.51E-06 TYMS TYMS black 0.386767241 4.63E-06 HMMR HMMR black 0.386014719 4.85E-06 SEC61G SEC61G black 0.385953885 4.87E-06 KIAA0101 KIAA0101 black 0.384399009 5.35E-06 HSD17B6 HSD17B6 black -0.383093462 5.79E-06 CRTAC1 CRTAC1 black -0.381929739 6.22E-06 PLOD1 PLOD1 black 0.378259599 7.75E-06 COL10A1 COL10A1 black 0.378078519 7.84E-06 PRAME PRAME black 0.377581222 8.08E-06 PAICS PAICS black 0.377282427 8.22E-06 DPY19L1 DPY19L1 black 0.376765685 8.48E-06 MELK MELK black 0.37397527 1.00E-05 MCM6 MCM6 black 0.372532885 1.09E-05 METTL7A METTL7A black -0.370966369 1.19E-05 AURKA AURKA black 0.370809065 1.20E-05 CCNB1 CCNB1 black 0.37033082 1.24E-05 ECT2 ECT2 black 0.365318292 1.65E-05 CALU CALU black 0.36529166 1.66E-05 PLAC8 PLAC8 black -0.364961965 1.69E-05 PBK PBK black 0.364347328 1.75E-05 LAMP3 LAMP3 black -0.359981249 2.24E-05 SFTPD SFTPD black -0.358210384 2.47E-05 RAD51AP1 RAD51AP1 black 0.351631848 3.56E-05 H1F0 H1F0 black 0.350653657 3.76E-05 HMGB3 HMGB3 black 0.350353978 3.82E-05 SLC35F2 SLC35F2 black 0.34443235 5.25E-05 CACNA2D2 CACNA2D2 black -0.336814033 7.85E-05 PPM1H PPM1H black 0.336249174 8.08E-05 TARS TARS black 0.33430046 8.94E-05 TRIP13 TRIP13 black 0.320428429 0.000179901 ELOVL6 ELOVL6 black 0.320361728 0.000180492 NT5E NT5E black 0.320080384 0.000183006 GRIA1 GRIA1 black -0.315030487 0.000234026 PLA2G4A PLA2G4A black 0.313134688 0.000256374 ABCA3 ABCA3 black -0.310102738 0.000296262 EGLN3 EGLN3 black 0.309713627 0.000301777 KNTC1 KNTC1 black 0.30969087 0.000302103 GFPT1 GFPT1 black 0.308648936 0.000317359 UCHL1 UCHL1 black 0.305999816 0.000359417 CCT6A CCT6A black 0.305271948 0.000371843 CDKN3 CDKN3 black 0.303427326 0.000405135 BUB1 BUB1 black 0.29979723 0.000478822 STK39 STK39 black 0.296519816 0.000555768 ISG15 ISG15 black 0.2933711 0.000640264 PDIA6 PDIA6 black 0.28268491 0.001022857 CENPE CENPE black 0.280282054 0.001133656 VTCN1 VTCN1 black 0.278210118 0.001237884 ECM1 ECM1 black 0.269847575 0.001753518 TBC1D2 TBC1D2 black -0.269837096 0.001754272 IGF2BP3 IGF2BP3 black 0.268602772 0.001845105 TSPAN6 TSPAN6 black 0.2644483 0.00218309 ABCA12 ABCA12 black 0.260953227 0.002509841 PMM1 PMM1 black -0.260077036 0.002598402 DUOX1 DUOX1 black -0.259976146 0.002608778 AK1 AK1 black -0.257109727 0.002919691 IARS2 IARS2 black 0.24379239 0.00484815 CPD CPD black 0.24302499 0.004987955 TUBB2A TUBB2A black 0.22982296 0.008026973 NUP107 NUP107 black 0.22702412 0.008850547 CDK4 CDK4 black 0.214869382 0.013355314 DEPDC1 DEPDC1 black 0.213590616 0.013929506 ASNS ASNS black 0.208765193 0.01629464 SELENBP1 SELENBP1 black -0.208672311 0.016343394 ALDH2 ALDH2 black -0.206779293 0.017364988 CCT2 CCT2 black 0.177629065 0.041587382 © Translational Lung Cancer Research. All rights reserved. http://dx.doi.org/10.21037/tlcr-20-822
You can also read