A nomogram for predicting metabolic steatohepatitis: The combination of NAMPT, RALGDS, GADD45B, FOSL2, RTP3, and RASD1

Page created by Dawn Zimmerman
 
CONTINUE READING
A nomogram for predicting metabolic steatohepatitis: The combination of NAMPT, RALGDS, GADD45B, FOSL2, RTP3, and RASD1
Open Medicine 2021; 16: 773–785

Research Article

Shenling Liao#, He He#, Yuping Zeng, Lidan Yang, Zhi Liu, Zhenmei An*, Mei Zhang*

A nomogram for predicting metabolic
steatohepatitis: The combination of NAMPT,
RALGDS, GADD45B, FOSL2, RTP3, and RASD1
https://doi.org/10.1515/med-2021-0286                                   under the ROC of the nomogram was 0.897. The DCA showed
received August 26, 2020; accepted April 17, 2021                       that when the threshold probability of MASH was 0–0.8, the
Abstract                                                                prediction model was valuable to GSE48452. In QSG-7011
Objective ‒ To identify differentially expressed and clini-              fatty liver model cells, the relative expression levels of
cally significant mRNAs and construct a potential predic-                NAMPT, GADD45B, FOSL2, RTP3, RASD1 and RALGDS were
tion model for metabolic steatohepatitis (MASH).                        lower than the control group.
Method ‒ We downloaded four microarray datasets,                        Conclusion ‒ We identified seven hub genes NAMPT,
GSE89632, GSE24807, GSE63067, and GSE48452, from                        PHLDA1, RALGDS, GADD45B, FOSL2, RTP3, and RASD1.
the Gene Expression Omnibus database. The differen-                      The nomogram showed good performance in the predic-
tially expressed genes (DEGs) analysis and weighted                     tion of MASH and it had clinical utility in distinguishing
gene co-expression network analysis were performed                      MASH from simple steatosis.
to screen significant genes. Finally, we constructed a                   Keywords: nomogram, metabolic steatohepatitis, non-
nomogram of six hub genes in predicting MASH and                        alcoholic steatohepatitis, weighted gene co-expression
assessed it through receiver operating characteristic                   network analysis.
(ROC) curve, calibration plot, and decision curve ana-
lysis (DCA). In addition, qRT-PCR was used for relative
quantitative detection of RNA in QSG-7011 cells to further
verify the expression of the selected mRNA in fatty liver               1 Introduction
cells.
Results ‒ Based on common DEGs and brown and yellow                     Metabolic steatohepatitis (MASH), which was once named
modules, seven hub genes were identified, which were                     nonalcoholic steatohepatitis (NASH), is one of the stages of
NAMPT, PHLDA1, RALGDS, GADD45B, FOSL2, RTP3, and                        metabolic-associated fatty liver disease (MAFLD), which
RASD1. After logistic regression analysis, six hub genes                was named nonalcoholic fatty liver disease (NAFLD). MASH
were used to establish the nomogram, which were NAMPT,                  is developed from simple steatosis and can progress to
RALGDS, GADD45B, FOSL2, RTP3, and RASD1. The area                       cirrhosis and even liver cancer. A previous study reported
                                                                        that the overall global prevalence of NAFLD diagnosed by
                                                                        imaging was approximately 25.24 and 7–30% of patients
                                                                      with NAFLD had NASH, indicating the overall prevalence
# These authors have contributed equally to this work as co-first        of NASH was approximately between 1.5 and 6.45% [1].
authors.
                                                                        NAFLD and NASH are becoming a global economic burden
                                                                        [2] and result in a poor quality of life because of compli-

                                                                        cations, including type 2 diabetes [3,4], cardiovascular
* Corresponding author: Zhenmei An, Department of Endocrinology
and Metabolism, West China Hospital, Sichuan University,                disease [5], and chronic kidney disease [4]. The current
Chengdu, China, e-mail: azmhxnfm@163.com                                methods of diagnosing NASH and NAFLD are serum tests
* Corresponding author: Mei Zhang, Department of Laboratory             and imaging. However, these methods are not specific.
Medicine, West China Hospital, Sichuan University, Chengdu              Present serum biomarkers are not ideal, and all bio-
610041, Sichuan, China, e-mail: meizi5337@163.com
                                                                        markers have their limitations [6,7]. Despite NAFLD can
Shenling Liao, He He, Yuping Zeng, Lidan Yang, Zhi Liu: Department
of Laboratory Medicine, West China Hospital, Sichuan University,
                                                                        be assessed by imaging techniques such as ultrasonography,
Chengdu 610041, Sichuan, China, e-mail: wendy253@126.com,               controlled attenuation parameter, MRI-based proton density
carrotie.he@outlook.com, meizi5337@163.com                              fat fraction, magnetic resonance elastography, and transient

   Open Access. © 2021 Shenling Liao et al., published by De Gruyter.       This work is licensed under the Creative Commons Attribution 4.0
International License.
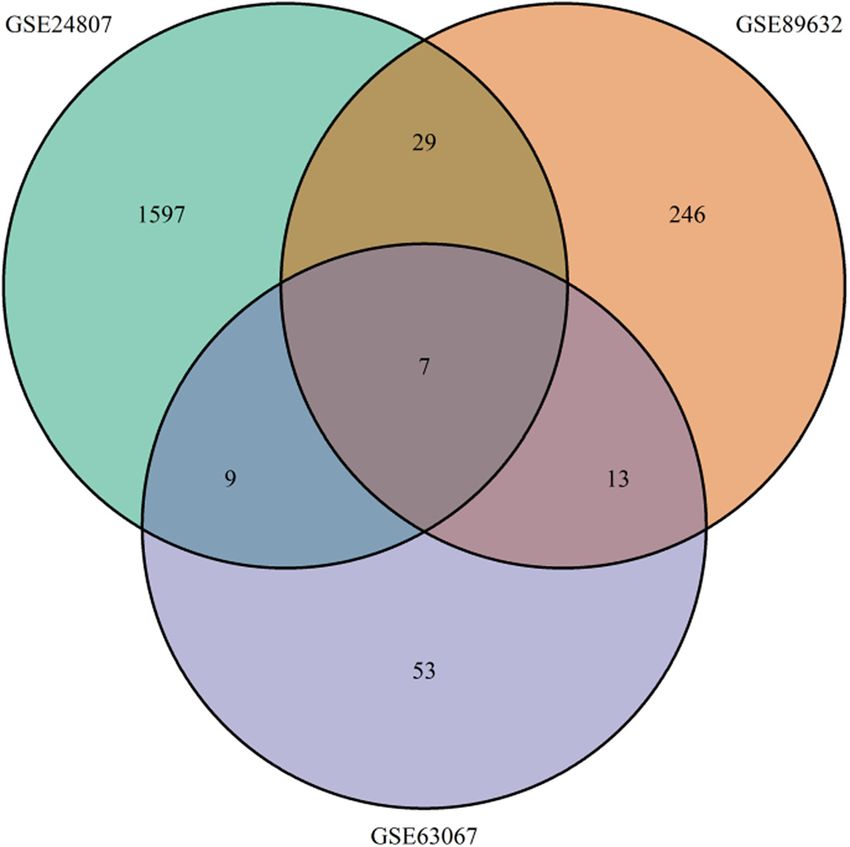
A nomogram for predicting metabolic steatohepatitis: The combination of NAMPT, RALGDS, GADD45B, FOSL2, RTP3, and RASD1
774        Shenling Liao et al.

elastography, these techniques primarily evaluate steatosis     seven healthy samples [13]. GSE89632 included 20 samples
and fibrosis, while inflammation is hard to differentiate [8,9].   with steatosis, 19 with NASH, and 24 healthy controls [14],
The gold standard for diagnosing NASH is the biopsy, but the    and the clinical traits are listed in Table 2. GSE24807 included
biopsy is an invasive and costly method that is not easy to     12 NASH samples and 5 healthy controls [15]. GSE48452
be accepted by patients. Therefore, developing new, non-        included 14 samples with steatosis, 18 with NASH, 14 con-
invasive, and reliable biomarkers is undergoing. In addition    trols, 27 with healthy obese [16], and samples’ clinical char-
to traditional serum biomarkers, genetic biomarkers are         acteristics are shown in Table S1. The clinical information of
attracting much attention. Some studies identified mRNAs         GSE63067 and GSE24807 were not available. The data that
or microRNAs or lncRNAs in NAFLD progression or diag-           we download and analyzed were normalized by submitters.
nosis, for instance, UBE2V1, BNIP3L mRNAs [10], miR-192,        The data in each dataset was in the same batch, except
miR-21, miR-505 [11], and lncARSR [12].                         GSE24807. Median-centered values in GSE24807 are indica-
     In this study, we aimed to screen potential mRNAs for      tive that the data are normalized and cross-comparable.
the diagnosis of MASH. Differentially expressed genes                 GSE63067, GSE24807, and GSE89632 were used to
(DEGs) between NASH patients and healthy controls               identify DEGs. GSE89632 was analyzed with the weighted
were identified in GSE89632, GSE24807, and GSE63067.             gene co-expression network. Finally, GSE48452 was used
Then we constructed weighted gene co-expression mod-            to construct and validate the prediction nomogram.
ules and screened significant genes in modules mostly
related to the status of NAFLD. The common genes in
DEGs and significant genes in modules were considered            2.2 Identify DEGs
as hub genes related to the disease. Based on the decision
curve analysis (DCA) and receiver operating character-          The online analysis platform GEO2R (https://www.ncbi.
istic (ROC) curve, we validated the clinical utility of the     nlm.nih.gov/geo/geo2r/) was used to compare two groups
nomogram of hub genes in predicting MASH.                       of samples to identify DEGs. DEGs between NASH samples
                                                                and healthy controls were analyzed in the datasets GSE63067
                                                                and GSE89632 respectively. p-value 1.2 were used as a filter for the datasets GSE63067
2 Materials and methods                                         and GSE89632. Bioinformatics analysis was based on the R
                                                                software 3.6. With the Combat function in the SVA ver-
                                                                sion 3.5 R package, the batch effects in GSE24807 were
2.1 Download microarray datasets                                corrected [17], and DEGs were analyzed using the limma
                                                                R package. As log FC was generally large in the dataset
We conducted dataset searches from the Gene Expres-             GSE24807, p-value 2
sion Omnibus (GEO) database of the National Center for          were used as a filter. The common DEGs were listed and
Biotechnology Information (https://www.ncbi.nlm.nih.            the Venn diagram was made.
gov/geo/), up to March 1, 2020. The searches included
the keywords (“NASH” OR “NAFLD” OR “nonalcoholic
fatty liver disease” OR “nonalcoholic steatohepatitis”
OR “non-alcoholic steatohepatitis” OR “non-alcoholic            2.3 Weighted gene co-expression network
fatty liver disease”) and (organism: Homo sapiens).                 analysis
     To be included in the bioinformatics analysis, data-
sets had to fulfill the following criteria: (i) study type was   With WGCNA R package, clusters (modules) of highly
expression profiling by array; (ii) samples were from liver      correlated genes were found and the correlation between
tissue; (iii) studies included control and case samples.        modules external sample traits was constructed for GSE89632
The search and selection process are shown in Figure S1.        [18]. First, the top 25% of the variance of probe expression
We chose datasets with the top three sample sizes for           was screened to WGCNA. Samples were clustered to
DEGs and chose datasets that included controls, steatosis       check samples and two samples were excluded. The
and NASH samples for weighted gene co-expression net-           soft threshold power of β = 14 (scale-free R2 = 0.85) was
work analysis (WGCNA) and validation.                           set to construct modules (Figure 2a and b). External traits
     The datasets GSE89632, GSE24807, GSE63067, and GSE         were related to modules and the correlation index was
48452 were downloaded from the GEO database. GSE63067           calculated. Disease, one of the clinical traits, meant the
included two steatosis samples, nine NASH samples, and          status of NAFLD, including simple steatosis, NASH, and
A nomogram for predicting metabolic steatohepatitis      775

healthy. The two modules most relevant to the disease,         Chinese Academy of Sciences, Shanghai Institutes for
brown and yellow modules, were chosen to identify hub          Biological Sciences (Shanghai, China). It was cultured
genes. To explore the function of genes in brown and           in RPMI-1640 medium (Gibco, USA) with 10% fetal bovine
yellow modules, Gene ontology (GO) and Kyoto encyclo-          serum, and incubated at 37°C in a humidified 5% CO2
pedia of genes and genomes (KEGG) analyses were per-           atmosphere. At about 70% confluence, the cells were
formed on the Metascape database [19] (http://metascape.       treated with or without 0.2 mM free fatty acid (palmitic
org/gp/index.html#/main/step1).                                acid:oleic acid = 1:2; Sigma, USA). After 16 h treatment,
                                                               the cells were collected for further experiments.
                                                                   Total RNA was extracted from collected cells using
                                                               miRNeasy Mini Kit (Qiagen, Germany) according to the
2.4 Identification of hub genes                                 manufacturer’s instructions. The reverse transcription
                                                               was performed with Reverse Transcription Kit (Qiagen,
Based on the WGCNA R package, gene significance (GS)            Germany) and the cDNAs were quantified by real-time
and connectivity between genes and genes were calcu-           PCR by Roche LightCycler96 using QuantiNova SYBR Green
lated. Kwithin was the connectivity of a gene and other        PCR Kit (Qiagen, Germany). Primers used for qRT-PCR
genes that were in the same module. GS was the correlation     are listed in Table S2. qRT-PCR was carried out with the
between gene expression and clinical data. Then, genes in      condition of 2 min for initial denaturation, 45 cycles for
the brown and yellow module whose Kwithin was top 5%           denaturation at 95°C for 10 s, annealing and extension at
and GS p-value for the disease was
776         Shenling Liao et al.

                                                                     The enriched BPs were primarily associated with response
                                                                     to lipopolysaccharide, leukocyte activation, cytokine, and
                                                                     cell death, while MF mainly enriched in DNA-binding tran-
                                                                     scription activator activity. CC chiefly enriched in secretory
                                                                     granule membrane and extracellular matrix. The KEGG ana-
                                                                     lysis indicated that the principal enriched pathways were
                                                                     TNF signaling pathway, cytokine–cytokine receptor inter-
                                                                     action, osteoclast differentiation, and AGE–RAGE signaling
                                                                     pathway in diabetic complications. Together, these genes
                                                                     highlight inflammation and inflammatory cytokines.

                                                                     3.3 Identification of hub genes

                                                                     Genes in the brown and yellow modules were calculated
                                                                     Kwithin and GS p-value. The Kwithin of repeated genes
                                                                     were averaged. Screened by Kwithin and GS p-value,
                                                                     brown module and yellow module owned 27 and 20
Figure 1: Venn diagram of differentially expressed genes (DEGs).
                                                                     significant genes, respectively. Intersected by significant
Different colors represented different datasets, and the cross parts
stood for common DEGs. Seven DEGs were shared with GSE24807,
                                                                     genes and DEGs, hub genes, seven in total, were NAMPT,
GSE63067, and GSE89632; nine DEGs were shared with GSE24807          PHLDA1, RALGDS, GADD45B, FOSL2, RTP3, and RASD1
and GSE63067; 29 DEGs were shared with GSE24807 and                  (Table 1).
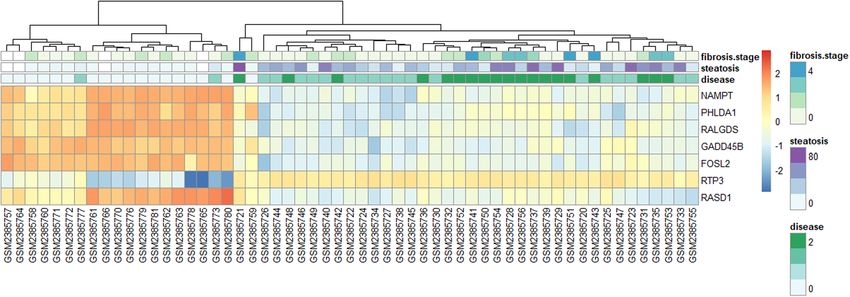
GSE89632; 13 DEGs were shared with GSE89632 and GSE63067.                The heatmap of hub genes and samples is shown,
                                                                     which aimed to further study the relationship between
                                                                     hub genes and clinical data (Figure 3). NAMPT, PHLDA1,
3.2 Construction of weighted gene                                    RALGDS, GADD45B, and FOSL2 were all in the brown
    co-expression module                                             module, with a lower expression for steatosis and NASH
                                                                     samples and with a higher expression for normal samples.
After the WGCNA, the cluster dendrogram is as shown in               RTP3 in the yellow module was in high expression for
Figure 2c. There were 14 modules shown in different                   steatosis and NASH samples, while RASD1 in the yellow
colors. Gray module represented genes that cannot be                 module was in low expression for steatosis and NASH
clustered. Brown module was mostly related to disease                samples.
(correlation index = −0.77, p-value = 2 × 10⁻¹²) and stea-
tosis (correlation index = −0.59, p-value = 2 × 10⁻⁶).
Yellow module was second related to disease (correlation
index = 0.67, p-value = 1 × 10⁻⁶) and steatosis (correlation         3.4 Clinical traits and the expression of
index = 0.46, p-value = 3 × 10⁻⁴) (Figure 2d). Brown                     hub genes
module and yellow module had a negative and positive
relation to disease, respectively. Brown module inhibited            Through the above analysis, we finally kept 19 samples
the progress of NAFLD, while the yellow module pro-                  with NASH, 20 samples with simple steatosis, and 18
moted the progress of NAFLD. As a result, brown and                  controls in the dataset GSE89632. The clinical characteri-
yellow modules were selected to further analyze.                     stics and the expression of hub genes are shown in Table 2.
     There were 551 genes in the brown module and 412                There was no difference in age and gender, and patients
genes in the yellow module. GO and KEGG pathway ana-                 with NASH or simple steatosis had higher BMI than healthy
lyses for genes in the two modules were performed. The top           controls. The steatosis of hepatocytes, fibrosis stage, lob-
five significant GO molecular functions (MFs), biological              ular inflammation severity, ballooning intensity, and NAS
processes (BPs), and cellular components (CCs), and top              indicated increasing histological severity from simple stea-
15 KEGG pathways were demonstrated (Figure 2e and f).                tosis to NASH. The expression of hub genes was higher in
A nomogram for predicting metabolic steatohepatitis                                                                   777

 (a)                                                                                                                                                                                                                               (b)                                                                                                                                         (c)                              Cluster Dendrogram
                                                                                                                                                                                                                                                                                                                Mean connectivity

                                                                                                                                                                                                                                                                                                                                                                                         1.0
                                                                                                                       Scale independence

                                                                                                                                                                                                                                                                    1

                                                                                                                                                                                                                                                             2500
                                                                                                                                                                                                18    19       20
                                                                                                                                                                             15       16   17
                                                                                                                                                               13       14
                                                                                                                                          10             12
                                                                                                                                  9

                                                                                                                                                                                                                                                                                                                                                                                         0.8
                                                                                                                   7        8
                                                                                                            6
                                                                                              4     5

                                                                                                                                                                                                                                                             2000
                                                                                         3
                                               0.5

                                                                                                                                                                                                                                                                                                                                                                                         0.6
                                                                                                                                                                                                                                                                                                                                                                                Height
                                                                                                                                                                                                                                     Mean Connectivity

                                                                                                                                                                                                                                                             1500
  Scale Free Topology Model Fit,signed R^2

                                                                                                                                                                                                                                                                        2

                                                                                                                                                                                                                                                                                                                                                                                         0.4
                                                                          2
                                               0.0

                                                                                                                                                                                                                                                             1000
                                                                                                                                                                                                                                                                            3

                                                                                                                                                                                                                                                                                                                                                                                         0.2
                                                                                                                                                                                                                                                             500
                                                                                                                                                                                                                                                                                           4
                                               −0.5

                                                                                                                                                                                                                                                                                                   5
                                                                                                                                                                                                                                                                                                       6
                                                                                                                                                                                                                                                                                                            7
                                                                                                                                                                                                                                                                                                                 8   9 10
                                                                                                                                                                                                                                                                                                                               12 13 14 15 16 17 18
                                                        1                                                                                                                                                                                                                                                                                           19 20

                                                                                                                                                                                                                                                             0
                                                                                                                                                                                                                                                                                                                                                                                Module colors
                                                                                                    5                                     10                                 15                                20                                                                                  5                   10                   15              20

                                                                                                                          Soft Threshold (power)                                                                                                                                                                Soft Threshold (power)

                                                                                                                                                                                                                                                                                                                                                                                         GO enrichment
 (d)                                                                                                                              Module−trait relationships                                                                                                 (e)                                 DNA−binding transcription activator activity, RNA polymerase II−specific
                                                                                                  −0.13           0.14          −0.065          −0.059         −0.098         0.029        0.014      −0.027          0.29
                                                      MEpink                                      (0.3)           (0.3)          (0.6)           (0.7)          (0.5)         (0.8)        (0.9)       (0.8)         (0.03)
                                                                                                                                                                                                                              1                                                                                                                       glycosaminoglycan binding
                                                                                                   0.21            0.24          0.19           −0.016          0.23          0.17         0.032      0.0023          0.31
                                              MEsalmon                                             (0.1)          (0.07)         (0.2)           (0.9)         (0.09)         (0.2)        (0.8)        (1)          (0.02)
                                                                                                                                                                                                                                                                                                                                                           receptor ligand activity
                                                                                                  0.029             0.3         −0.097          −0.13          −0.089         0.013        0.036         −0.13        0.32
                                                      MEtan                                       (0.8)           (0.02)         (0.5)          (0.3)           (0.5)         (0.9)        (0.8)         (0.3)       (0.02)

                                                                                                  −0.21           −0.11         0.0012          0.067          −0.058         0.028        −0.023        0.11        0.066
                                                                                                                                                                                                                                                                                                                                                          phosphoprotein binding
                                             MEturquoise                                          (0.1)           (0.4)           (1)           (0.6)           (0.7)         (0.8)         (0.9)        (0.4)       (0.6)
                                                                                                                                                                                                                              0.5
                                               MEbrown                                             −0.77         −0.59           −0.17          −0.22           −0.36         −0.42        −0.19         0.081       −0.34                                                                                                               2−acylglycerol O−acyltransferase activity
                                                                                                  (2e−12)       (2e−06)          (0.2)          (0.09)         (0.005)       (0.001)       (0.1)         (0.5)       (0.01)

                                                                                                   −0.41          −0.39         −0.084            0.2          −0.082         0.076         −0.1      −0.086         −0.15
                                             MEmagenta                                            (0.001)        (0.003)         (0.5)           (0.1)          (0.5)         (0.6)         (0.4)      (0.5)         (0.3)                                                                                                                        response to lipopolysaccharide
                                                                                                                                                                                                                                                                                GO description

                                                                                                   −0.3           −0.1           −0.23           −0.41          −0.37         −0.43        −0.16         0.087       −0.31
                                                MEgreen                                           (0.02)          (0.4)          (0.08)         (0.001)        (0.005)       (8e−04)       (0.2)         (0.5)       (0.02)                                                                                                                          myeloid leukocyte activation
                                                                                                                                                                                                                              0                                                                                                                                                                                               GO Biological Processes
                                                                                                   0.14           0.044          0.15           −0.19          0.076         −0.086        0.095         0.083       −0.09
                                                      MEblue                                       (0.3)          (0.7)          (0.3)          (0.2)          (0.6)          (0.5)        (0.5)         (0.5)       (0.5)
                                                                                                                                                                                                                                                                                                                                            cytokine−mediated signaling pathway                                               GO Cellular Components
                                                                                                   −0.42          −0.34         −0.028           −0.3          −0.19           −0.3        −0.073        0.13        −0.33
                                                      MEred                                       (0.001)         (0.01)         (0.8)          (0.02)         (0.2)          (0.02)        (0.6)        (0.4)       (0.01)                                                                                                                                                                                                   GO Molecular Functions
                                                                                                                                                                                                                                                                                                                                                  positive regulation of cell death
                                                                                                  0.0025          0.03           −0.42          −0.079         −0.27         −0.083        −0.16       −0.97         −0.12
 MEgreenyellow                                                                                      (1)           (0.8)         (0.001)          (0.6)         (0.05)         (0.5)        (0.2)      (1e−34)        (0.4)

                                                                                                    0.59           0.24          0.19             0.46          0.42           0.49         0.18       −0.25          0.24
                                                                                                                                                                                                                              −0.5                                                                                                                                  cell chemotaxis
                                               MEpurple                                           (1e−06)         (0.07)         (0.2)          (3e−04)        (0.001)       (1e−04)        (0.2)      (0.06)        (0.07)

                                                                                                   0.33            0.27         −0.073          −0.17           0.02         −0.079        0.021         −0.11       0.028                                                                                                                          secretory granule membrane
                                                  MEblack                                         (0.01)          (0.04)         (0.6)          (0.2)           (0.9)         (0.6)        (0.9)         (0.4)       (0.8)

                                               MEyellow                                             0.67
                                                                                                  (1e−08)
                                                                                                                  0.46
                                                                                                                (3e−04)
                                                                                                                                 0.18
                                                                                                                                 (0.2)
                                                                                                                                                 0.16
                                                                                                                                                 (0.2)
                                                                                                                                                                0.32
                                                                                                                                                               (0.01)
                                                                                                                                                                               0.3
                                                                                                                                                                              (0.02)
                                                                                                                                                                                            0.21
                                                                                                                                                                                            (0.1)
                                                                                                                                                                                                         −0.12
                                                                                                                                                                                                         (0.4)
                                                                                                                                                                                                                      0.25
                                                                                                                                                                                                                     (0.06)
                                                                                                                                                                                                                                                                                                                                                                 extracellular matrix
                                                                                                   −0.63          −0.34          0.016          −0.27          −0.29          −0.32        −0.12        0.25         −0.25    −1
                                                      MEgrey                                      (1e−07)        (0.009)         (0.9)          (0.04)         (0.03)         (0.02)       (0.4)       (0.06)        (0.06)                                                                                                                                       apical part of cell
                                                                                                                                                                                           e

                                                                                                                                                                                                                                                                                                                                                        cell projection membrane
                                                                                                                                ge

                                                                                                                                                              ity

                                                                                                                                                                                                     er
                                                                                                  e

                                                                                                                s

                                                                                                                                                .

                                                                                                                                                                             AS

                                                                                                                                                                                                                     I
                                                                                                                                               m

                                                                                                                                                                                                                    BM
                                                                                                                                                                                       ag
                                                                                                             si
                                                                                              as

                                                                                                                                                                                                    nd
                                                                                                                                                         ns
                                                                                                                           ta

                                                                                                                                          fla
                                                                                                            to

                                                                                                                                                                         N
                                                                                             se

                                                                                                                       s

                                                                                                                                                                                                ge
                                                                                                                                                    te
                                                                                                     ea

                                                                                                                                   .in
                                                                                                                    s.
                                                                                        di

                                                                                                                                                 .in
                                                                                                                  si
                                                                                                   st

                                                                                                                                 ar

                                                                                                                                                                                                                                                                                                                                perinuclear endoplasmic reticulum membrane
                                                                                                                ro

                                                                                                                                               on
                                                                                                                               l
                                                                                                                            bu
                                                                                                            fib

                                                                                                                                          llo
                                                                                                                           lo
                                                                                                                                   ba

                                                                                                                                                                                                                                                                                                                                                                                          0       5        10        15
                                                                                                                                                                                                                                                                                                                                                                                                 −Log10(P.value )
                                                                                                                                                                                                     KEGG pathway enrichment

                                                                                                                                                         TNF signaling pathway

 (f)                                                                                                                   Cytokine−cytokine receptor interaction

                                                                                                                                                   Osteoclast differentiation

                                                                                       AGE−RAGE signaling pathway in diabetic complications

                                                                                                                                                                                       Malaria
                                                            KEGG pathway description

                                                                                                                       Transcriptional misregulation in cancer

                                                                                                                                                                    HTLV−I infection

                                                                                                                                                              Pathways in cancer

                                                                                                                                                    Proteoglycans in cancer

                                                                                                                                                                              Influenza A

                                                                                                                                               PI3K−Akt signaling pathway

                                                                                                                                                                 Insulin resistance

                                                                                                                                      NF−kappa B signaling pathway

                                                                                                                                                                                  Apoptosis

                                                                                                                                               Estrogen signaling pathway

                                                                                                                                                                                                           0                                             5                                                 10
                                                                                                                                                                                                                                                              −Log10(P.value )

Figure 2: Construction of weighted gene co-expression modules and the relationship between module and trait. (a) Analysis of the soft
threshold, red line = 0.85. (b) Analysis of mean connectivity. (c) Cluster dendrogram based on the dataset GSE89632. Different colors
represented different co-expression gene modules. (d) Heatmap of the relationship between module and clinical trait. Each column
represented clinical data, and each row represented each co-expression module. Each small grid stood for each pair of the module and trait,
and indicated correlation index and p-value. Blue and red represented negative correlation and positive correlation, respectively. The
deeper the color of the grid, the stronger the correlation. (e) Top five significant GO MFs, BPs, and CCs enriched by genes in brown and
yellow modules. (f) KEGG pathway enriched by genes in brown and yellow modules (top 15).

samples with NASH than in healthy controls (p-value                                                                                                                                                                                                                                                                       NASH and simple steatosis, while the expression of
778              Shenling Liao et al.

Table 1: List of hub genes. From top to bottom, hub genes in each module were arranged by the Kwithin from large to small

Module       Hub genes          Alias                        Ensembl ID               Definition

Brown        NAMPT              PBEF, PBEF1, VF, VISFATIN    ENSG00000105835          Nicotinamide phosphoribosyltransferase
             PHLDA1             DT1P1B11, PHRIP, TDAG51      ENSG00000139289          Pleckstrin homology like domain family A member 1
             RALGDS             RGDS, RGF, RalGEF            ENSG00000160271          Ral guanine nucleotide dissociation stimulator
             GADD45B            GADD45BETA, MYD118           ENSG00000099860          Growth arrest and DNA damage inducible beta
             FOSL2              FRA2                         ENSG00000075426          FOS like 2, AP-1 transcription factor subunit
Yellow       RTP3               LTM1, TMEM7, Z3CXXC3         ENSG00000163825          Receptor transporter protein 3
             RASD1              AGS1, DEXRAS1                ENSG00000108551          Ras-related dexamethasone induced 1

Table 2: Clinical data and the expression of hub genes in dataset GSE89632. Values given are mean (SD) or numbers of valid cases

Clinical traits                                     n       NASH                 n       Simple steatosis      n       Healthy controls

Age (years)                                         19      43.47 (12.76)        20      44.70 (9.14)          18      38.67 (11.14)
Male, % (n)                                         19      47.4% (9)            20      70% (14)              18      44.4% (8)
BMI (kg/m2)                                         18      31.77 (5.45)         19      28.78 (4.23)          18      26.21 (4.00)
Steatosis (% of hepatocytes)                        19      45.00 (26.45)        20      34.00 (24.37)         14      0.39 (0.74)
Fibrosis stage, 0/1/2/3/4 (n)                       19      4/5/2/4/4            20      17/3/0/0              14      9/5/0/0
Lobular inflammation severity, 0/1/2/3 (n)           19      0/11/6/2             19      19/0/0/0              6       6/0/0/0
Ballooning intensity, 0/1/2 (n)                     19      0/13/6               20      20/0/0                14      14/0/0
AST(U/L)                                            19      58.79 (28.11)        20      27.25 (8.51)          18      21.28 (5.94)
ALT (U/L)                                           19      83.47 (39.59)        19      50.84 (17.62)         18      20.94 (11.50)
Triglycerides (mmol/L)                              17      2.38 (2.46)          18      1.52 (0.99)           15      0.96 (0.40)
Total cholesterol (mmol/L)                          17      4.98 (1.23)          18      4.99 (1.17)           15      4.67 (1.09)
Fasting glucose (mmol/L)                            17      6.18 (2.77)          17      5.71 (1.09)           18      5.03 (0.48)
HbA1c                                               16      6.04% (1.07%)        16      5.49% (0.44%)         18      5.41% (0.50%)
NAS, 0–8                                            19      4.84 (1.17)          19      1.68 (0.75)           6       0.00
NAMPT                                               19      13.31 (0.21)         20      13.31 (0.55)          18      14.63 (0.38)
PHLDA1                                              19      12.37 (0.43)         20      11.86 (0.80)          18      14.28 (0.38)
RALGDS                                              19      12.80 (0.32)         20      12.74 (0.68)          18      14.53 (0.55)
GADD45B                                             19      12.90 (0.23)         20      13.10 (0.60)          18      14.39 (0.15)
FOSL2                                               19      10.65 (0.27)         20      10.70 (0.84)          18      12.68 (0.46)
RTP3                                                19      14.30 (0.17)         20      14.17 (0.72)          18      12.36 (1.00)
RASD1                                               19      9.47 (0.72)          20      9.44 (1.10)           18      11.88 (1.07)

3.5 Model and the evaluation of nomogram                                  was valuable, which meant the net benefit of the predic-
                                                                          tion model was better than treat all and treat none. Where
GSE48452 was used to construct a logistic regression                      threshold probability was more than 0.8, the prediction
model. The model of NAMPT, RALGDS, GADD45B, FOSL2,                        model was of no value, which meant the prediction model
RTP3, and RASD1 is shown as the nomogram (Figure 4a).                     was as the same result as treat none. Therefore, the pre-
The calibration curve of the nomogram presented when the                  diction model could be used for the dataset GSE48452 if
possibility of actual NASH was 0.4–0.8, and the nomogram                  the threshold probability was 0–0.8.
might underestimate the probability (Figure 4b). The nomo-
gram showed good prediction performance in differen-
tiating steatosis and MASH (Figure 4c), and the area under
the curve (AUC) was 0.897.                                                3.6 The relative expression of hub genes
     DCA calculated the net benefit without additional                         in vitro
clinical information, such as life-years saved or quality
of life improved [20]. In Figure 4d, where the threshold                  The expression of hub genes in QSG-7011 cells with or
probability for MASH was 0–0.8, the prediction model                      without FFA was quantified by qRT-PCR, and the results
A nomogram for predicting metabolic steatohepatitis            779

Figure 3: Heatmap of hub genes and samples. Each column represented one sample in the dataset GSE89632, which was annotated by
clinical data in different pairs of colors. Samples were clustered. For disease, 0 (white), 1, 2 (green) represented normal sample, steatosis
sample, NASH sample respectively. For steatosis, 0 (white) to 80 (purple) represented steatosis percentage. 0 (white) to 4 (blue) repre-
sented the fibrosis stage. Each row represented each hub gene. The expression of each hub gene in each sample was presented by red to
blue. Red and blue represented high expression and low expression, respectively.

are shown in Figure 5. The relative expressions of                          Samples with NASH were different from simple stea-
NAMPT, GADD45B, FOSL2, RTP3, RASD1, and RALGDS                         tosis in histology, including steatosis of hepatocytes,
in QSG-7011 cells with 0.2 mM FFA were lower than con-                 lobular inflammation severity, and ballooning intensity.
trols, but only the expression of FOSL2 was statistically              Although there was no significant statistical difference in
significant.                                                            the expression of hub genes, the decision curve revealed
                                                                       the prediction model had clinical utility, and it had net
                                                                       benefit within certain risk probability. The area under the
                                                                       ROC curve was 0.897, and the curve illustrated that
4 Discussion                                                           the sensitivity of the model was superior to specificity.
                                                                       However, we did not compare other diagnostic methods
In the study, we used the analysis of DEGs and WGCNA                   for MASH with our model, and whether the model was
to identify hub genes. Not a single gene, but clusters of              better than other diagnostic methods still need to be ree-
highly correlated genes were detected and related to clinical          valuated [21].
traits with the use of WGCNA [18]. Through GO and KEGG                      In our study, we identified seven hub genes: NAMPT,
analyses, we found genes in brown and yellow modules                   PHLDA1, RALGDS, GADD45B, FOSL2, RTP3, and RASD1.
enriched in inflammation such as leukocyte activation,                  These hub genes were considered to have a contribution
cytokine interaction, and TNF signaling pathway. This                  to the pathogenesis of MASH. Because of the small sample
further confirmed that the two modules are indeed related               size, PHLDA1 showed little contribution to MASH in regres-
to the progression of MASH.                                            sion analysis; therefore, PHLDA1 was excluded and the
     GEO2R analysis obtained the DEGs between NASH                     other six hub genes were made a logistic regression ana-
samples and controls in the three datasets. These datasets             lysis. At the same time, we verified the expression of hub
were from different platforms, and so we used common                    genes in QSG-7701 cells with FFA, and the expression of
DEGs to reduce the effect of different platforms. We com-                NAMPT, RALGDS, GADD45B, FOSL2, and RASD1 was con-
bined common DEGs and significant genes for disease                     sistent with the results of the bioinformatics analysis.
status in WGCNA to get hub genes that were able to predict             However, the relative expression of RTP3 was lower in
NASH and distinguish NASH from steatosis. Finally, seven               QSG-7701 cells with FFA than in controls, which was con-
genes overlapped, which were NAMPT, PHLDA1, RALGDS,                    trary to the WGCNA. The expression of all hub genes
GADD45B, FOSL2, RTP3, and RASD1. A prediction model                    between groups was not statistically significant, except
was constructed through logistic regression analysis. Then,            FOSL2, possibly because of the small sample size.
we visualized the model and performed the ROC curve and                     NAMPT, nicotinamide phosphoribosyltransferase, or
decision curve analyses for the model.                                 visfatin, promotes nicotinamide to convert to nicotinamide
780                                                   Shenling Liao et al.

                                                                                                                                                                                                                                            Calibration Curve

                                                                                                                                                                                                      1.0
                                                                0      10           20         30             40        50          60         70          80    90    100
                   Points
             ZNAMPT

                                                                                                                                                                                                      0.8
                                                               −1.5 −0.5 0.5         1.5       2.5

                                                                                                                                                                                   Actual Diagnosis
           ZRALGDS
                                                               −2.5 −2 −1.5 −1 −0.5 0 0.5 1 1.5 2
              ZRASD1

                                                                                                                                                                                                      0.6
                                                               −2 −1       0    1        2
                 ZRTP3
                                                               2.5 1.5 0.5      −1 −2
         ZGADD45B

                                                                                                                                                                                                      0.4
                                                               2.5          2            1.5              1             0.5              0          −0.5        −1     −1.5
               ZFOSL2                                                                                                                                                                                                                                                   Apparent
                                                               −2     −1        0 0.5 1 1.5 2 2.5

                                                                                                                                                                                                      0.2
          Total Points                                                                                                                                                                                                                                                 Bias−corrected
                                                                0      20            40             60             80         100            120       140      160    180
           MASH risk                                                                                                                                                                                                                                                          Ideal
                                                                                                                                  0.01              0.33 0.65   0.97
                                                                                                                                                                                                                              0.2          0.4            0.6           0.8              1.0
        (a)                                                                                                                                                                                                                             Nomogram Predicted Diagnosis
                                                                                                                                                                                (b)                   B= 1000 repetitions, boot                                    Mean absolute error=0.014 n=32

                                                                                               ROC Curve
                                             100

                                                                                                                                                                                                                                                                               predict
                                                                                                                                                                                                                                                                                All

                                                                                                                                                                                                                          0.15
                                                                                                                                                                                                                                                                               None
                                             80

                                                                      0.7 (92.9%, 77.8%)

                                                                                                                                                                                                                          0.10
                                     Sensitivity (%)
                                                60

                                                                                                                                                                                                            Net Benefit
                                                                                                          AUC: 89.7%

                                                                                                                                                                                                                          0.05
                                      40

                                                                                                                                                                                                                          0.00
                                             20

                                                                                                                                                                                                                          −0.05
                                             0

                                                        120          100            80               60             40              20                0         −20                                                               0.0    0.2        0.4      0.6       0.8        1.0
        (c)                                                                                    Specificity (%)                                                                  (d)                                                              High Risk Threshold

Figure 4: Statistical analysis for the prediction nomogram model. (a) Nomogram for distinguishing MASH and simple steatosis. All hub
genes were Z-score normalized, and ZNAMPT meant the normalization data of NAMPT, and so on. (b) The calibration plot of the nomogram.
The horizontal axis presented the predicted MASH, and the vertical axis was the actual diagnosis. The bias corrected line indicated the
performance of the nomogram. (c) ROC curve of the model for the dataset GSE48452 to discriminate patients with simple steatosis from
patients with NASH. (d) Decision analysis curve of the model for the dataset GSE48452. The horizontal axis was the threshold probability for
NASH, and the probability of samples being NASH was calculated based on the prediction model. When the probability of the sample being
NASH was more than the threshold probability, the sample was considered as NASH according to the model. The vertical axis was the net
benefit. Gray line represented the net benefit of that all samples were NASH and were received the treatment for NASH. Black line
represented the net benefit of that all samples were simple steatosis and forwent the treatment for NASH. Blue line represented the net
benefit of that NASH samples predicted by the model received the treatment for NASH.

                                                                                                                                                                              mononucleotide (NMN). NMN finally converts to nicotina-
                           1.5
                                                                                                                                                          Control             mide adenine dinucleotide (NAD), which is a vital coenzyme
Relative mRNA expression

                                                                                                                                                          0.2mM FFA           in cellular redox reactions in all organisms and partici-
                           1.0                                                                                                                                                pates in many signaling pathways [22]. NAMPT plays an
                                                                                                                                                                              important role in inflammation, and it promotes inflam-
                                                                                                                                                                              mation progress through NAD biosynthesis. Gerner et al.
                           0.5                                                                                                                                                found that the inhibition of NAMPT could decrease the
                                                                                                                                                                              infiltration by inflammatory monocytes, macrophages,
                                                                                                                                                                              and T cells [23]. In our nomogram, the Z-score normali-
                           0.0
                                                                                                                                                                              zation of NAMPT is higher, and the points are higher,
                                                                       2

                                                                                                              1
                                 PT

                                                           B

                                                                                                                              S
                                                                                         3
                                                                     SL

                                                                                 TP

                                                                                                      SD

                                                                                                                          D
                                                        45

                                                                                                                                                                              which indicates that NAMPT plays an important role in
                                 M

                                                                                                                        LG
                                                       D

                                                                 FO

                                                                                R

                                                                                                 A
                             A

                                                  D

                                                                                                R

                                                                                                                    A
                            N

                                           A

                                                                                                                   R
                                          G

                                                                                                                                                                              MASH. However, studies indicated that the deficiency of NAD
Figure 5: Relative expression of NAMPT, GADD45B, FOSL2, RTP3,                                                                                                                 played a role in aged NAFLD [24,25], and the high expression
RASD1, and RALGDS in QSG-7011 cells with or without FFA                                                                                                                       of NAMPT promoted the biosynthesis of NAD and indirectly
(*p < 0.05; mean ± SEM; n = 3).                                                                                                                                               reduced the risk of NASH by stimulating Sirt1/SREBP1
A nomogram for predicting metabolic steatohepatitis      781

signaling pathway probably [26]. Therefore the effect of          there is still a long way before clinical application, it
NAMPT in MASH still needs to be explored. However, a             provides some new targets for future work.
study revealed that the expression of NAMPT was of no                 However, the relation between hub genes and MASH
difference between simple steatosis and NASH [25]. NAMPT          or MAFLD has been studied little. It needs further study to
also contributed to the regulation of insulin secretion in the   provide more precise clinical information about diagnosis
pancreatic β-cells [22] and diabetes mellitus [27,28].           and progression. The limitations of our study should be
     PHLDA1, pleckstrin homology like domain family A            aware of. The samples we used were not large enough.
member 1, was a phosphatidylinositol-binding protein             These datasets were not suitable for joint analysis as they
and it could suppress AKT [29]. Zhang et al. found that          were from different platforms. The clinical information of
a high-fat diet decreased the expression of PHLDA1 in            GSE24807 and GSE63067 were not available, which might
mice study, subsequently, other genes decreasing, and            affect the results. The baseline data of hub genes were not
indicated PHLDA1 was an early biomarker of steatosis             available, and so no comparison with baseline gene
[30]. JAK2-STAT3 pathway may induce PHLDA1 expres-               expression was made. Our model was from liver tissue,
sion and these proteins probably play a significant role in       and the specificity for MASH was good. However, the
TLR2-mediated immune and inflammation [31].                       expression of the model in serum needs to be observed
     RALGDS, Ral guanine nucleotide dissociation stimu-          for further evaluation.
lator, is an activator of RalA. RalA and RALGDS are                   In conclusion, NAMPT, PHLDA1, RALGDS, GADD45B,
important to Ras-induced oncogenic transformation of             FOSL2, RTP3, and RASD1 were identified as the hub genes
cells [32]. GADD45B, growth arrest and DNA damage                in the progress of MAFLD. The combination of six genes
inducible beta, participated in p38 and JNK MAPK path-           could act as a potential diagnostic model for MASH and
ways to positively regulate apoptosis [33]. GADD45B              have clinical utility in distinguishing MASH from simple
was abundant in the kidney, liver, and lung. GADD45B             steatosis. However, clinical studies with large samples
was controversial in cell stress response, and it may be         are needed to further research the applicability of the
protective or harmful [34,35]. FOSL2, FOS like 2, AP-1           model in the diagnosis for MASH.
transcription factor subunit, one of FOS proteins, was
implicated as regulators of cell proliferation, differentia-
tion, and transformation. FOSL2 played an important role
in diverse disease processes, mostly through the TGF-β           Abbreviations
signaling pathway [36,37]. RTP3, receptor transporter
protein 3, is specific to the liver, and its expression in        AGE–RAGE       advanced glycation end product–receptor
other tissues is little [38]. RTP3 was probably a novel                         of advanced glycation end product
candidate gene for femoral neck bone because of the              BMI            body mass index
significant association with hip fracture [39]. RASD1,            DCA            decision curve analysis curve
Ras-related dexamethasone induced 1, was an activator            DEGs           differentially expressed genes
of G-protein signaling [40]. RASD1 was probably involved         FC             fold change
in hepatic insulin resistance [41].                              FOSL2          FOS like 2, AP-1 transcription factor
     The study contributed to understanding the mole-                           subunit
cular mechanism of MASH from the perspective of mRNA             GADD45B        growth arrest and DNA damage indu-
and provided potential biomarkers for the prediction of                         cible beta
MASH. These potential biomarkers showed good perfor-             GO             gene ontology
mance in predicting MASH and had clinical utility in             GS             gene significance
distinguishing MASH from simple steatosis. Because the           KEGG           kyoto encyclopedia of genes and genomes
biopsy is affected by the quality of the material taken and       MAFLD          metabolic-associated fatty liver disease
the experience of doctors, the results of the biopsy may         MASH           metabolic steatohepatitis
not fully reflect the condition of the patient. By detecting      MRI            magnetic resonance imaging
the expression of hub genes in liver cells, a predicted          NAD            nicotinamide adenine dinucleotide
value is calculated by the model and it can help doctors         NAFLD          nonalcoholic fatty liver disease
objectively evaluate the patient’s disease status to a cer-      NAMPT          nicotinamide phosphoribosyltransferase
tain extent according to the cut-off value, and provide a         NAS            metabolic-associated fatty liver disease
reference index for less experienced doctors. Although                          activity score
782          Shenling Liao et al.

NASH             nonalcoholic steatohepatitis                                  liver is not an innocent bystander. Sem Liver Dis. 2015
NMN              nicotinamide mononucleotide                                   Aug;35(3):236–49.
PHLDA1           pleckstrin homology like domain family A               [5]    Adams LA, Anstee QM, Tilg H, Targher G. Non-alcoholic fatty
                                                                               liver disease and its relationship with cardiovascular disease
                 member 1
                                                                               and other extrahepatic diseases. Gut. 2017 Jun;66(6):1138–53.
RALGDS           ral guanine nucleotide dissociation                    [6]    Drescher HK, Weiskirchen S, Weiskirchen R. Current status in
                 stimulator                                                    testing for nonalcoholic fatty liver disease (NAFLD) and
RASD1            ras-related dexamethasone induced 1                           nonalcoholic steatohepatitis (NASH). Cells. 2019 Aug 7;8:8.
ROC              receiver operating characteristic                      [7]    Chalasani N, Younossi Z, Lavine JE, Charlton M, Cusi K,
                                                                               Rinella M, et al. The diagnosis and management of nonalco-
RTP3             receptor transporter protein 3
                                                                               holic fatty liver disease: practice guidance from the American
SREBP1           sterol regulatory element-binding protein 1                   association for the study of liver diseases. Hepatology
TNF              tumor necrosis factor                                         (Baltimore, Md). 2018 Jan;67(1):328–57.
WGCNA            weighted gene co-expression network                    [8]    Altamirano J, Qi Q, Choudhry S, Abdallah M, Singal AK, Humar A,
                 analysis                                                      et al. Non-invasive diagnosis: non-alcoholic fatty liver disease and
                                                                               alcoholic liver disease. Transl Gastroenterol Hepatol. 2020;5:31.
                                                                        [9]    Dulai PS, Sirlin CB, Loomba R. MRI and MRE for non-invasive
                                                                               quantitative assessment of hepatic steatosis and fibrosis in
                                                                               NAFLD and NASH: clinical trials to clinical practice. J Hepatol.
Funding information: This work was supported by the
                                                                               2016 Nov;65(5):1006–16.
National Natural Science Foundation of China (No. 81902142)             [10]   Di Mauro S, Scamporrino A, Petta S, Urbano F, Filippello A,
and the Key Research and Development Project of Sichuan                        Ragusa M, et al. Serum coding and non-coding RNAs as bio-
Science and Technology Department (No. 2020YFH0114 and                         markers of NAFLD and fibrosis severity. Liver Int. 2019
No. 2020YFS0096).                                                              Sep;39(9):1742–54.
                                                                        [11]   Liu J, Xiao Y, Wu X, Jiang L, Yang S, Ding Z, et al. A circulating
                                                                               microRNA signature as noninvasive diagnostic and prognostic
Author contribution: L. Y. and Z. L. accessed literature                       biomarkers for nonalcoholic steatohepatitis. BMC Genomics.
and screened datasets. Y. Z., H. H., and S. L. analyzed                        2018 Mar 9;19(1):188.
data. S. L. and H. H. wrote the manuscript. Z. A. and M. Z.             [12]   Zhang M, Chi X, Qu N, Wang C. Long noncoding RNA
revised the manuscript and supervised the study.                               lncARSR promotes hepatic lipogenesis via Akt/SREBP-1c
                                                                               pathway and contributes to the pathogenesis of nonalcoholic
                                                                               steatohepatitis. Biochemical Biophys Res Commun. 2018
Conflict of interest: The authors declare that the research
                                                                               Apr 30;499(1):66–70.
was conducted in the absence of any commercial or                       [13]   Frades I, Andreasson E, Mato JM, Alexandersson E,
financial relationships that could be construed as a                            Matthiesen R, Martínez-Chantar ML. Integrative genomic sig-
potential conflict of interest.                                                 natures of hepatocellular carcinoma derived from nonalcoholic
                                                                               Fatty liver disease. PLoS one. 2015;10(5):e0124544.
                                                                        [14]   Arendt BM, Comelli EM, Ma DW, Lou W, Teterina A, Kim T, et al.
Data availability statement: The datasets analyzed during
                                                                               Altered hepatic gene expression in nonalcoholic fatty liver
the current study are available in the in the GEO (https://                    disease is associated with lower hepatic n-3 and n-6 poly-
www.ncbi.nlm.nih.gov/geo/).                                                    unsaturated fatty acids. Hepatology (Baltimore, Md). 2015
                                                                               May;61(5):1565–78.
                                                                        [15]   Liu W, Baker SS, Baker RD, Nowak NJ, Zhu L. Upregulation of
References                                                                     hemoglobin expression by oxidative stress in hepatocytes and
                                                                               its implication in nonalcoholic steatohepatitis. PLoS One.
[1]   Younossi ZM, Koenig AB, Abdelatif D, Fazel Y, Henry L, Wymer M.          2011;6(9):e24363.
      Global epidemiology of nonalcoholic fatty liver disease-meta-     [16]   Ahrens M, Ammerpohl O, von Schönfels W, Kolarova J, Bens S,
      analytic assessment of prevalence, incidence, and outcomes.              Itzel T, et al. DNA methylation analysis in nonalcoholic fatty
      Hepatology (Baltimore, Md). 2016 Jul;64(1):73–84.                        liver disease suggests distinct disease-specific and remo-
[2]   Younossi Z, Anstee QM, Marietti M, Hardy T, Henry L, Eslam M,            deling signatures after bariatric surgery. Cell Metab. 2013 Aug
      et al. Global burden of NAFLD and NASH: trends, predictions,             6;18(2):296–302.
      risk factors and prevention. Nat Rev Gastroenterol Hepatol.       [17]   Walsh CJ, Hu P, Batt J, Santos CC. Microarray meta-analysis
      2018 Jan;15(1):11–20.                                                    and cross-platform normalization: integrative genomics for
[3]   Akshintala D, Chugh R, Amer F, Cusi K. Nonalcoholic fatty liver          robust biomarker discovery. Microarrays (Basel, Switz). 2015
      disease: the overlooked complication of type 2 diabetes. In:             Aug 21;4(3):389–406.
      Feingold KR, Anawalt B, Boyce A, Chrousos G, Dungan K,            [18]   Langfelder P, Horvath S. WGCNA: an R package for weighted
      Grossman A, et al., editors. Endotext. South Dartmouth (MA):             correlation network analysis. BMC Bioinforma. 2008 Dec
      MDText.com, Inc.; 2000.                                                  29;9:559.
[4]   Vanni E, Marengo A, Mezzabotta L, Bugianesi E. Systemic           [19]   Zhou Y, Zhou B, Pache L, Chang M, Khodabakhshi AH,
      complications of nonalcoholic fatty liver disease: when the              Tanaseichuk O, et al. Metascape provides a biologist-oriented
A nomogram for predicting metabolic steatohepatitis             783

       resource for the analysis of systems-level datasets.                 [30] Zhang P, Chu T, Dedousis N, Mantell BS, Sipula I, Li L, et al.
       Nat Commun. 2019 Apr 3;10(1):1523.                                        DNA methylation alters transcriptional rates of differentially
[20]   Vickers AJ, Elkin EB. Decision curve analysis: a novel method             expressed genes and contributes to pathophysiology in mice
       for evaluating prediction models. Med Decis Mak. 2006                     fed a high fat diet. Mol Metab. 2017 Apr;6(4):327–39.
       Nov-Dec;26(6):565–74.                                                [31] Lyu JH, Huang B, Park DW, Baek SH. Regulation of PHLDA1
[21]   Vickers AJ, Cronin AM, Elkin EB, Gonen M. Extensions to                   expression by JAK2-ERK1/2-STAT3 signaling pathway. J Cell
       decision curve analysis, a novel method for evaluating                    Biochem. 2016 Feb;117(2):483–90.
       diagnostic tests, prediction models and molecular markers.           [32] Lim KH, Baines AT, Fiordalisi JJ, Shipitsin M, Feig LA, Cox AD,
       BMC Med Inform Decis Mak. 2008 Nov 26;8:53.                               et al. Activation of RalA is critical for Ras-induced tumori-
[22]   Revollo JR, Körner A, Mills KF, Satoh A, Wang T, Garten A, et al.         genesis of human cells. Cancer Cell. 2005 Jun;7(6):533–45.
       Nampt/PBEF/Visfatin regulates insulin secretion in beta cells        [33] Takekawa M, Saito H. A family of stress-inducible GADD45-like
       as a systemic NAD biosynthetic enzyme. Cell Metab. 2007                   proteins mediate activation of the stress-responsive MTK1/
       Nov;6(5):363–75.                                                          MEKK4 MAPKKK. Cell. 1998 Nov 13;95(4):521–30.
[23]   Gerner RR, Klepsch V, Macheiner S, Arnhard K, Adolph TE,             [34] Zhao Z, Gao Y, Guan X, Liu Z, Jiang Z, Liu X, et al. GADD45B as a
       Grander C, et al. NAD metabolism fuels human and mouse                    prognostic and predictive biomarker in stage II colorectal
       intestinal inflammation. Gut. 2018 Oct;67(10):1813–23.                     cancer. Genes. 2018 Jul 19;9:7.
[24]   Zhou CC, Yang X, Hua X, Liu J, Fan MB, Li GQ, et al. Hepatic NAD     [35] Sha X, Hoffman B, Liebermann DA. Loss of Gadd45b accelerates
       (+) deficiency as a therapeutic target for non-alcoholic fatty             BCR-ABL-driven CML. Oncotarget. 2018 Sep 7;9(70):33360–7.
       liver disease in ageing. Br J Pharmacol. 2016                        [36] Wang J, Sun D, Wang Y, Ren F, Pang S, Wang D, et al. FOSL2
       Aug;173(15):2352–68.                                                      positively regulates TGF-beta1 signalling in non-small cell lung
[25]   Dahl TB, Haukeland JW, Yndestad A, Ranheim T, Gladhaug IP,                cancer. PLoS One. 2014;9(11):e112150.
       Damas JK, et al. Intracellular nicotinamide phosphoribosyl-          [37] He J, Mai J, Li Y, Chen L, Xu H, Zhu X, et al. miR-597 inhibits
       transferase protects against hepatocyte apoptosis and is                  breast cancer cell proliferation, migration and invasion
       down-regulated in nonalcoholic fatty liver disease. J Clin                through FOSL2. Oncol Rep. 2017 May;37(5):2672–8.
       Endocrinol Metab. 2010 Jun;95(6):3039–47.                            [38] Fagerberg L, Hallstrom BM, Oksvold P, Kampf C, Djureinovic D,
[26]   Wang LF, Wang XN, Huang CC, Hu L, Xiao YF, Guan XH, et al.                Odeberg J, et al. Analysis of the human tissue-specific expression
       Inhibition of NAMPT aggravates high fat diet-induced hepatic              by genome-wide integration of transcriptomics and antibody-
       steatosis in mice through regulating Sirt1/AMPKalpha/SREBP1               based proteomics. Mol Cell Proteomics. 2014 Feb;13(2):397–406.
       signaling pathway. Lipids Health Dis. 2017 Apr 27;16(1):82.          [39] Zhao LJ, Liu XG, Liu YZ, Liu YJ, Papasian CJ, Sha BY, et al.
[27]   Keren J, Yingcheng W, Jingyi J, Liyang W, Lili S, Huiqun W, et al.        Genome-wide association study for femoral neck bone
       The identification of gene signature and critical pathway asso-            geometry. J Bone Miner Res. 2010 Feb;25(2):320–9.
       ciated with childhood-onset type 2 diabetes. PeerJ. 2019;7:e6343.    [40] Cismowski MJ, Ma C, Ribas C, Xie X, Spruyt M, Lizano JS, et al.
[28]   Zhou Q, Chen B, Ji T, Luo M, Luo J. Association of genetic                Activation of heterotrimeric G-protein signaling by a ras-
       variants in RETN, NAMPT and ADIPOQ gene with glycemic,                    related protein. Implications for signal integration. J Biol
       metabolic traits and diabetes risk in a Chinese population.               Chem. 2000 Aug 4;275(31):23421–4.
       Gene. 2018 Feb 5;642:439–46.                                         [41] Jiang B, Lv Q, Wan W, Le L, Xu L, Hu K, et al. Transcriptome
[29]   Chen Y, Takikawa M, Tsutsumi S, Yamaguchi Y, Okabe A,                     analysis reveals the mechanism of the effect of flower tea
       Shimada M, et al. PHLDA1, another PHLDA family protein that               Coreopsis tinctoria on hepatic insulin resistance. Food Funct.
       inhibits Akt. Cancer Sci. 2018 Nov;109(11):3532–42.                       2018 Nov 14;9(11):5607–20.
784              Shenling Liao et al.

Appendix

                                  Records identified through database searching                 Excluded records beyond
                                                    (n=1541)                                    study time (n=2)
                                                                                                Excluded records not
                                                                                                NASH or NAFLD (n=21)
                                                                                                Excluded samples not from
                                         Filters: Expression profiling by array                 liver tissue (n=6)
                                                         (n=50)                                 Excluded records with
                                                                                                cases only (n=9)
                                                                                                Excluded records with data
                                                                                                missing (n=2)
                                            Datasets met the requirements
                                                       (n=10)                                   Excluded studies on
                                                                                                lncRNA (n=2)

                                  Chose datasets with top three sample sizes for
                                differentially expressed genes and chose datasets
                               included steatosis and NASH samples for WGCNA
                                                  and validation

Figure A1: flow chart of screening datasets.

Table A1: Clinical data of dataset GSE48452. Values given are mean (SD) or numbers of valid cases

Clinical traits                                                    n        NASH            n        Simple steatosis        n    Healthy controls

Age (years)                                                        18       45.48 (8.93)    14       41.60 (11.22)           13   51.80 (19.21)
Male, % (n)                                                        18       22.22% (4)      14       28.6% (4)               13   30.8% (4)
BMI (kg/m2)                                                        18       45.97 (12.96)   14       48.28 (6.42)            13   25.10 (3.97)
Steatosis (% of hepatocytes)                                       18       71.94 (16.28)   14       35.74 (22.00)           13   0.69 (1.18)
Fibrosis stage, 0/1/2/3/4 (n)                                      18       3/11/0/2/2      14       10/4/0/0                12   8/3/1/0/0
Inflammation severity, 0/1/2/3 (n)                                  18       0/9/6/3         14       12/2/0/0                13   12/1/0/0
NAS                                                                18       5.06 (0.87)     14       1.71 (0.83)             13   0.77 (0.28)
Bariatric surgery, NA/after surgery/before surgery (n)             18       14/1/3          14       2/5/7                   13   11/2/0
A nomogram for predicting metabolic steatohepatitis      785

Table. A2: RT-PCR primers for mRNA expression measurements

Gene name                                  Forward                                                  Reverse

NAMPT                                      TTGCTGCCACCTTATC                                         AACCTCCACCAGAACC
GADD45B                                    TGACAACGACATCAACATC                                      GTGACCAGAGACAATGCAG
FOSL2                                      CCAGATGAAATGTCATGGC                                      CTCGGTTTGGTAGACTTGGA
RTP3                                       CCTTCGCCAGGTTCCAGT                                       GACTTCTCCTCACTCCAGTTCAT
RASD1                                      CGACTCGGAGCTGAGTATCC                                     GGTGGAAGTCCTCGATGGTA
RALGDS                                     TCCCAGCTGAGTCCCATCGA                                     TCACTAACCCCCGTCTTGCATG
β-actin                                    CTGGAACGGTGAAGGTGACA                                     CGGCCACATTGTGAACTTTG

Table A3: Common differentially expressed genes in the datasets

Datasets                       Total   Common differentially expressed genes

GSE24807 GSE63067              7       MBNL2, RTP3, PHLDA1, FOSL2, NAMPT, SPSB1, CASP4
GSE89632
GSE24807 GSE63067              9       BBOX1, COL1A1, CHI3L1, MCL1, PLIN1, ENO3, TSLP, CCDC71L, LGALS8
GSE24807 GSE89632              29      TGM2, ATF3, ANXA13, RAB26, CALCA, CYP7A1, KLF6, ANXA9, C2orf82, IER3, ZFP36, CSF3,
                                       GRAMD4, DUSP10, GADD45B, IVNS1ABP, SLC22A7, IGFBP1, SLITRK3, RASD1, RRP12, RAB27A,
                                       BCL3, MT1A, TRIM15, CYR61, SIK1, C2CD4A, IFIT3
GSE63067 GSE89632              13      NR4A2, SERPINB9, CEBPD, IGFBP2, RALGDS, S100A8, BCL2A1, AVPR1A, IL1RN, S100A12, PEG10,
                                       CD274, BIRC3
You can also read