Implementation of a Three-Phase Electronic Watt-Hour Meter Using the MSP430F471xx
←
→
Page content transcription
If your browser does not render page correctly, please read the page content below
Application Report
                                                                                   SLAA409A – June 2009

      Implementation of a Three-Phase Electronic Watt-Hour
                            Meter Using the MSP430F471xx
Stephen Underwood, Vincent Chan and Kripasagar Venkat                            MSP430 Applications

                                            ABSTRACT

     This application report describes the implementation of a three phase electronic electricity
     meter using the Texas Instruments MSP430F471xx system-on-chip (SOC) processor.
     This application report includes the necessary information with regard to metrology
     software, hardware and calibration procedures for this single chip implementation. Results
     are included at the end, which show performance of this device for three phase using
     current transformers as sensors.

1    Introduction
     The MSP430F471xx devices belong to the MSP430F4xx family of devices. These devices
     find its application in energy measurement and have the necessary architecture to support
     it. The MSP430F471xx devices have a powerful 16 MHz CPU with MSP430CPUx
     architecture. The analog front-end consists of up to seven analog to digital converters
     (ADC) based on a 2nd order sigma-delta architecture that supports differential inputs. The
     sigma-delta ADCs (SD16) that have a resolution of 16-bits can be configured and grouped
     together for simultaneous sampling of voltages and currents on the same trigger. Each
     SD16 supports a common mode voltage of up to -1 V and enables all sensors to be
     referenced to ground. In addition, it also has an integrated gain stage to support gains up
     to 32 for amplification of low-output sensors. A 32-bit x 32-bit HW multiplier on this chip
     can be used to further accelerate math intensive operations during energy computation.
     The SW supports calculation of various parameters for total three phase and for each
     individual phases. The key parameters calculated during energy measurements are: RMS
     current and voltage, Active and reactive power, power factor and frequency. The entire
     operations take about 1/3rd of the processing power and use about a tenth of resources.
     The application note has complete metrology source code provided as a zip file.

2    Block diagram
     Figure 1 depicts the block diagram that shows the high level interface used for a three-phase
     energy meter application. A three-phase four wire star connection to the mains is shown in this
     case. Current transformers (CT) are connected to each of the current channels and a simple
     voltage divider is used for corresponding voltages. Each CT has an associated burden resistor
     that has to be connected at all times to protect the measuring device. The choice of the CT and
     the burden resistor is done based on the manufacturer and current range required for energy
     measurements. The choice of voltage divider resistors for each voltage channel is selected to
     ensure the mains voltage is divided down to adhere to the normal input ranges that are valid for
     the MSP430 SD16. Refer to the 4xx user’s guide and specific datasheet for these numbers.

                                                                                                        1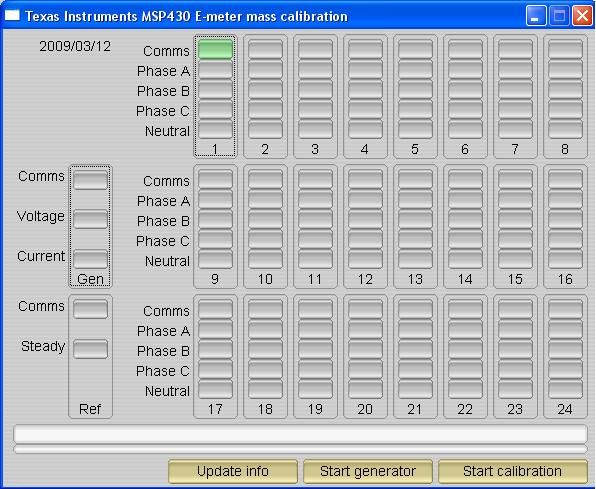
SLAA409A

                                                                              +

                                                                              -
                            Phase C
       Phase A
                                                   VCC                                  Sx, COMx
            Neutral

                            Phase B                                                         R33
                                                   RST
                                                   VSS                                                  LCDCAP

                                                                      +
           CT                                         IA
                                                                      -                    Px.x
                                                                                                   STATUS LEDs

                                                                   +                       Px.y
                                      CT              IB
                                                                      -

                                                                      +                     XIN

                                           CT         IC
                                                                          -
                                                                                          XOUT
                                                                                                   32, 768 Hz

                                                     Ineutral     +
                                                                                            Px x
                       CT
                                                                                                   User Interface
                                                                  -
                                                                                       UCxTXD0

                                                      VA                               UCxRXD0
                                                                      +
                                                                                                    UART( or SPI)
                                                                                                    9600- 115, 200
                                                                          -
                                                                                       UCxTXD1
                                                      VB
                                                                      +                             IR Comunication
                                                                                       UCxRXD1
                                                                          -

                                                      VC
                                                                      +                                    CC1xxx
                                                                                            SPI               or
                                                      VN                                                   CC 2xxx
                                                                          -
            Neutral

                            Phase B

       Phase A
                            Phase C

                      Figure 1: 3-phase 4-wire star connection using the MSP430F47197

2           Implementation of a Three-Phase Electronic Watt-Hour Meter Using the MSP430F471xx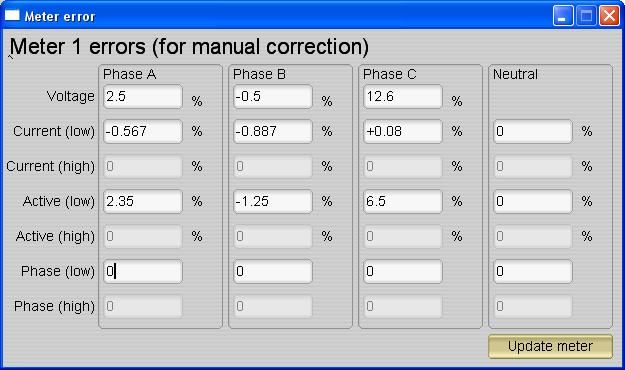
SLAA409A
3     Hardware implementation
      This section describes various pieces that constitute the HW for the working of an energy meter
      using the MSP430F471xx.

3.1   Power supply
      The MSP430 family of devices is ultra low-power microcontrollers from Texas Instruments.
      These devices support a number of low-power modes, in addition, boast of low-power
      consumption during active mode when the CPU and other peripherals are active. The low-power
      feature of this device family allows design of the power supply to be very extremely simple and
      cheap. The power supply allows the operation of the energy meter powered directly from the
      mains. The next sub-sections discuss the various power supply options that are available to
      users to support their design.

3.1.1 Resistor Capacitor (RC) power supply
      Figure 2 shows a simple capacitor power supply for a single output voltage of 3.3V directly from
      the mains.

      Figure 2: A simple capacitive power supply for the MSP430 energy meter
      Appropriate values of resistors (R4-R6) and capacitors (C1-C3) are chosen based on the
      required output current drive of the power supply. Voltage from mains is directly fed to a RC
      based circuit followed by a rectification circuitry to provide a DC voltage for the operation of the
      MSP430. This DC voltage is regulated to 3.3V for full speed operation of the MSP430. For the
      circuit above, the approximate drive provided by each phase is about 12mA. The design
      equations for the power supply are given in the application note from Texas Instruments;
      SLAA024, section 3.8.3.2. The above configuration allows for all three phases to provide the
      required current drive, which would then be three times the drive available from each phase. If a
      need for additional drive is required, either an NPN output buffer or a transformer based power
      supply maybe used.

                            Implementation of a Three-Phase Electronic Watt-Hour Meter Using the MSP430F471xx 3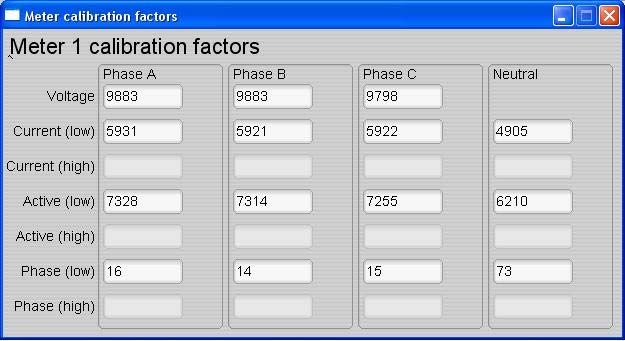
SLAA409A
3.1.2 Transformer based power supply
      For instances when a higher current drive is required, especially when RF transceivers are used,
      the simple capacitive power supply does not provide enough drive. Hence, a transformer based
      power supply is required. Voltage from the mains is brought down using a step-down
      transformer followed by a rectification circuitry. For this condition, a transformer is not needed at
      all three phases. Appropriate transformers must be selected to provide the drive required by the
      entire board. Figure 3 shows an example of the transformer based circuitry that can be used for
      the MSP430F47197 based energy meter.

      Figure 3: A transformer based power supply for the MSP430 energy meter

3.2   Analog inputs
      The MSP430 analog front end that consists of the SD16 ADC is differential and requires that the
      input voltages at the pins do not exceed +/- 500mV (gain=1). In order to meet this specification
      the current and voltage inputs need to be divided down. In addition the SD16 allows a maximum
      negative voltage of -1V, hence AC signals from mains can be directly interfaced without the
      need for level shifters. This sub-section describes the analog front end used for voltage and
      current channels.

3.2.1 Voltage inputs
      The voltage from the mains is usually 230 V or 110V and needs to be brought down to a range
      of 500mV. The analog front end for voltage consists of spike protection varistors followed by a
      simple voltage divider and a RC low-pass filter that acts like an anti-alias filter.

4             Implementation of a Three-Phase Electronic Watt-Hour Meter Using the MSP430F471xx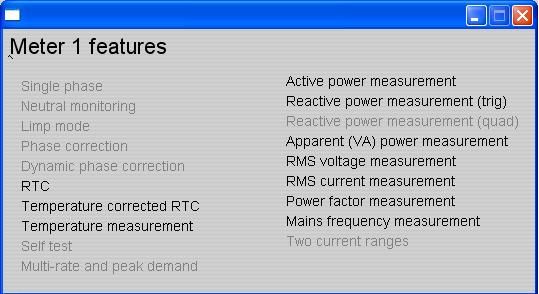
SLAA409A

                                Figure 4: Analog front end for voltage inputs
     Figure 4 shows the analog front end for the voltage inputs for a mains voltage of 230V. The
     voltage is brought down to approximately 350mV RMS, which is 495mV peak and fed to the
     positive input, adhering to the MSP430 SD16 analog limits. A common mode voltage of zero can
     be connected to the negative input of the SD16. In addition, the SD16 has an internal reference
     voltage of 1.2V that can be used externally and also as a common mode voltage if needed.
     It is important to note that the anti-alias resistors on the positive and negative sides are different
     because, the input impedance to the positive terminal is much higher and therefore a lower
     value resistor is used for the anti-alias filter. If this is not maintained, a relatively large phase shift
     of several degrees would result.

3.2.2 Current inputs
     The analog front-end for current inputs is a little different from the analog front end for the
     voltage inputs. Figure 4 shows the analog front end used for current channel I1 following the CT
     used.

                                Figure 5: Analog front end for current inputs

                             Implementation of a Three-Phase Electronic Watt-Hour Meter Using the MSP430F471xx 5
SLAA409A
Resistor R27 is the burden resistor that would be selected based on the current range used and
the turns-ratio specification of the CT. The value of the burden resistor for this design is around
5.1 Ohms. The anti-aliasing circuitry consisting of R26, R28, C20 and C22 follows the burden
resistor. The input signal to the converter is a fully differential input with a voltage swing of +/-
500mV maximum with gain of the converter set to 1. Similar to the voltage channels, the
common mode voltage is selectable to either analog ground (AGND) or internal reference
(VREF).
4 Software Implementation
The software for the implementation of 3-phase metrology is discussed in this section. The first
subsection discusses the setup of various peripherals of the MSP430. Subsequently, the entire
metrology software is described as two major processes; foreground process and background
process.
4.1 Peripherals setup
The major peripherals are the 16-bit sigma delta (SD16) ADC, clock system, LCD, basic timer
(BT), watchdog timer (WDT).
4.1.1 SD16 setup
As mentioned before, the F47197 has up to seven independent sigma delta data converters. For
a three phase system at least six SD16s are necessary to independently measure three voltages
and currents. The code accompanying this application note will address the metrology for a 3-
phase system with limited discussion to anti-tampering. Hence all seven SD16s are configured.
Power or energy measurement relies on the product of instantaneous voltage and current
samples. To ensure the reliability of this product, there should not be any difference or delay in
time during their sampling. The MSP430 SD16s allow several features to ensure easy and
accurate sampling of voltage and current samples for all six channels. The group feature
grouping of SD16s to allow simultaneous sampling of all on a single trigger. More is discussed
under background process. The clock to the SD16 ( fM ) is derived from the FLL that is locked to
f
the 32.768 KHz external crystal (ACLK). The sampling frequency is defined as fs = M OSR , the
OSR is chosen to be 256 and the modulation frequency fM , is chosen as 1.048576 MHz,
resulting in a sampling frequency of 4.096 Ksps. The SD16s are configured to generate regular
interrupts every sampling instant.
The following are the SD16 channels associations
A0.0+ and A0.0- Æ Voltage V1
A1.0+ and A1.0- Æ Voltage V2
A2.0+ and A2.0- Æ Voltage V3
A3.0+ and A3.0- Æ Current I1
A4.0+ and A4.0- Æ Current I2
A5.0+ and A5.0- Æ Current I3
6 Implementation of a Three-Phase Electronic Watt-Hour Meter Using the MSP430F471xxSLAA409A
Optional neutral channel can be processed via channel A6.0+ and A6.0-.
4.1.2 Clock system
The MSP430 supports an external low-frequency crystal (ACLK) of 32.768 KHz, the on-chip FLL
locks to this crystal. The FLL sources the CPU clock (MCLK) and SMCLK which is configured to
an integer multiple of ACLK. For the current application 12 MHz and 16 MHz frequency options
have been provided.
4.1.3 Basic Timer (BT)
The BT is configured to give precise 1 second interrupts for Real-time clock (RTC) functionality.
The clock to the BT is ACLK, which is the external 32.768 KHz crystal.
4.1.4 LCD controller
The LCD controller on the F47197 can support up to 4-mux displays and 160 segments. It is
also equipped with an internal charge pump that can be used for good contrast. In the current
design, the LCD controller is configured to work in 4-mux mode using the entire 160 segments.
The refresh rate is set to ACLK/128, which is 256 Hz.
4.1.5 Supply Voltage Supervisor (SVS)
The SVS module is a key peripheral in the MSP430 providing supply voltage monitoring. Figure
6 shows the CPU frequency versus voltage requirement for reliable operation for the F471xx
devices. The built in hardware SVS is turned ON to ensure that the MCU is in a known state at
all times
Figure 6: System (CPU) frequency versus voltage requirement
Implementation of a Three-Phase Electronic Watt-Hour Meter Using the MSP430F471xx 7SLAA409A
The F47197 CPU can operate up to 16 MHz and this maximum speed can be achieved only for
supply voltage (Vcc) ≥ 3.3 V. In order to ensure reliable operation of the CPU at any specified
frequency, the minimum Vcc has to be met from Figure 6. The SVS module can be configured to
perform this check and must be the first step in SW before changing the FLL to operate at this
higher frequency. The SVS can continue to monitor the Vcc and can be made to generate a
system reset whenever the voltage dips below the minimum allowed level for that operating
speed. In addition the Vcc for the MSP430 derived from the mains can also be connected to the
input of the comparator. This will pre-warn the system when there is a mains black-out to go into
ultra-low-power RTC mode.
4.2 The Foreground Process
The foreground process includes the initial setup of the MSP430 HW and SW immediately after
a device RESET. Figure 7 shows the flowchart for this process
Figure 7: Foreground process
8 Implementation of a Three-Phase Electronic Watt-Hour Meter Using the MSP430F471xxSLAA409A
The initialization routines involves the setup of the analog to digital converter (SD16), Clock
system, LCD controller, general purpose input/output (port) pins, timer and the Universal Serial
Communication Interface (USCI) for UART functionality. A check is made if the main power is
OFF and the device goes into LPM0. During normal operation, the background process notifies
the foreground process through a status flag every time a frame of data is available for
processing. This data frame consists of accumulation of energy for 1 second. This is equivalent
to accumulation of 50 or 60 cycles of data samples synchronized to the incoming voltage signal.
In addition, a sample counter keeps tack of how many samples have been accumulate over the
frame period. This count can vary as the software synchronizes with the incoming mains
frequency. The data samples set consist of processed current, voltage, active and reactive
energy. All values are accumulated in separate 48-bit registers to further process and obtain the
RMS and mean values.
4.2.1 Formulae
This section briefly describes the formulae used for the voltage, current and energy
calculations.
4.2.1.1 Voltage and Current
As discussed in the previous sections simultaneous voltage and current samples are obtained
from six independent SD16 converters at a sampling rate of 4096 Hz. Track of the number of
samples that are present in 1 second is kept and used to obtain the RMS values for voltage and
current for each phase.
Sample
count
∑ v ph2 (n)
n =1
VRMS = K v ∗
Sample count
Sample
count
∑ 2
i ph (n)
n =1
IRMS = K i ∗
Sample count
ph= Phase that takes the value 1, 2 or 3.
vph(n)= Voltage sample at a sample instant ‘n’
iph(n)= Current sample at a sample instant ‘n’
Sample count= Number of samples in 1 second
Kv= Scaling factor for voltage
Ki= Scaling factor for current
Implementation of a Three-Phase Electronic Watt-Hour Meter Using the MSP430F471xx 9SLAA409A
4.2.2 Power and energy
Power and energy are calculated for a frame’s worth of active and reactive energy samples.
These samples are phase corrected and passed on to the foreground process that uses the
number of samples (sample count) and use the formulae listed below to calculate total active
and reactive powers.
⎛ Sample ⎞
⎜ count ⎟
3
⎜
⎜
∑ v ph (n) × i ph (n) ⎟
⎟
PAct, Total = ∑ n =1
⎜ K p (ph) × Sample count ⎟
ph =1 ⎜ ⎟
⎜ ⎟
⎜ ⎟
⎝ ⎠
⎛ Sample ⎞
⎜ count ⎟
3
⎜
⎜
∑ v 90, ph (n) × i ph (n) ⎟
⎟
PReact, Total = ∑ ⎜ K p (ph) ×
n =1
Sample count ⎟
ph =1 ⎜ ⎟
⎜ ⎟
⎜ ⎟
⎝ ⎠
v90, ph(n) = Voltage sample at a sample instant ‘n’ shifted by 90 degrees
Kp(ph)= Scaling factor for power
The consumed energy is then calculated base on the active power value for each frame in
similar way as the energy pulses are generated in the background process except that
E Act, Total = PAct, Total × Sample count
For reactive energy we use the 90 degree phase shift approach for two reasons:
1. This allows us to measure the reactive power accurately down to very small currents.
2. This conforms to international specified measurement method.
Since the frequency of the mains varies, it is important to first measure the mains frequency
accurately and then phase shift the voltage samples accordingly. This is discussed under
Frequency measurement and cycle tracking in the following section.
The phase shift consists of an integer part and a fractional part, the integer part is realized by
providing an N samples delay. The fractional part is realized by a fractional delay filter (refer to:
Phase compensation).
4.2.3 Display
An additional display routine is called from the foreground process. This scrolls through in 2
second delays, displaying a number of values, VRMS, IRMS, power, frequency, power factor,
temperature, real-time clock etc.
10 Implementation of a Three-Phase Electronic Watt-Hour Meter Using the MSP430F471xxSLAA409A
4.3 The Background process
The background process uses the SD16 interrupt as a trigger to collect voltage and current
samples for each phase (six values in total). These samples are further processed and
accumulated in dedicated 48-bit registers. The background function deals mainly with timing
critical events in software. Once sufficient samples (1 second worth) have been accumulated
then the foreground function is triggered to calculate the final values of VRMS, IRMS, power and
energy. The background process is also wholly responsible for energy proportional pulses,
frequency and power factor calculation for each phase. Figure 8 shows the flow diagram of the
background process.
Figure 8: Background process
Implementation of a Three-Phase Electronic Watt-Hour Meter Using the MSP430F471xx 11SLAA409A
The following sections discuss the various elements of electricity measurement in the
background process.
4.3.1 Sigma Delta Converter interrupt
The SD16 converter is self triggering at a sampling frequency of 4096 samples/sec. The seven
independent converters are setup to sample in group mode. Each sample interval of
approximately 250μs would return three pairs of current (I) and voltage (V) samples plus the
neutral sample if needed. Figure 9 shows the SD16 signal flow with function blocks for one of
the phases. However, all three phases have similar functionality
Sample Trigger
+
-
SD16 Fractional Delay I1(n) DC removal filter
X2 Σ IRMS
X
+
-
SD16 Fractional Delay V1(n) DC removal filter Σ PACT
+ X2
-
SD16 Fractional Delay I2(n)
X Σ VRMS
+
-
SD16 Fractional Delay V2(n)
Σ PREACT
+
SD16 Fractional Delay I3(n) z −1 z −1 Fractional phase Delay
- 90 Deg phase
shift
+
SD16 Fractional Delay V3(n)
- Y Cycle 1 second worth
Cycle begin?
counter++ of samples?
+
SD16 Fractional Delay N(n)
- Y
Send flag to
Foreground process
Figure 9: SD16 samples signal flow
4.3.2 Voltage and Current signals
The Sigma Delta Converter has a fully differential input and therefore no added DC offset is
needed to precondition a signal which is the case with most single ended converters.
The output of the Sigma Delta is a 16-bit signed integer. Any stray DC offset value is removed
independently for V and I by subtracting a long term DC tracking filter’s output from each SD16
sample. This long term DC tracking filter is synchronized to the mains cycle to yield a highly
stable output.
The resulting instantaneous voltage and current samples are used to generate the following
information:
• Accumulated Squared voltage values of voltage and current for VRMS and IRMS
calculations.
• Accumulated energy samples to calculate Active energy.
12 Implementation of a Three-Phase Electronic Watt-Hour Meter Using the MSP430F471xxSLAA409A
• Accumulated energy samples with current and 90 degree phase shifted voltage to
calculate Reactive energy.
These accumulated values are processed by the foreground process.
4.3.3 Phase Compensation
The Current Transformer (CT) when used as a sensor and the input circuit’s passive
components together introduces an additional phase shift between the current and voltage
signal that needs compensation. The SD16 converter has built in hardware delay that can
applied to individual samples when grouped. This can be used to provide the phase
compensation required. This value is obtained during calibration and loaded on to the respective
PRELOAD register for each converter. Figure 10 shows the application of PRELOAD
Figure 10: Phase compensation using PRELOAD register
The fractional delay resolution is a function of input frequency (fin), OSR and the sampling
frequency (fs).
360 o × fin 360 o × fin
Delay resolutionDeg = =
OSR × fs fm
In the current application for input frequency of 60Hz, OSR of 256 and sampling frequency of
4096, the resolution for every bit in the preload register is about 0.02 degrees with a maximum of
5.25 degrees (maximum of 255 steps). Since the sampling of the 7 channels are group
triggered. An often method used is to apply 128 steps of delay to all channels and then
increasing or decreasing from this base value. This allows +/- delay timing to compensate for
phase lead or lag. This puts the practical limit in the current design to +/- 2.62 degrees. When
using CTs that provide a larger phase shift than this maximum, an entire sample delay along
with fractional delay must be provided. This phase compensation can also be modified on the fly
to accommodate temperature drifts in CTs.
4.3.4 Frequency measurement and cycle tracking
The instantaneous I and V signals for each phase are accumulated in 48 bit registers. A cycle
tracking counter and sample counter keep track of the number of samples accumulated. When
approximately one second’s worth of samples have been accumulated, the background process
stores these 48-bit registers and notifies the foreground process to produce the average results
like RMS and power values. We use cycle boundaries to trigger the foreground averaging
process since it gives very stable results.
Implementation of a Three-Phase Electronic Watt-Hour Meter Using the MSP430F471xx 13SLAA409A
For frequency measurements, we do a straight line interpolation between the zero crossing
voltage samples. Figure 11 depicts the samples near a zero cross and the process of linear
interpolation.
Figure 11: Frequency measurement
Since noise spikes can also cause errors, we use the rate of change check to filter out the
possible erroneous signals and make sure that the two points are interpolated from are genuine
zero crossing points. For example, if you have two negative samples, a noise spike can make
one of them positive and therefore making the negative and positive pair looks as if there is a
zero crossing.
The resultant cycle to cycle timing goes through a weak low pass filter to further smooth out
cycle to cycle variations. This results in a stable and accurate frequency measurement tolerant
of noise.
4.3.5 LED Pulse generation
In electricity meters, the energy consumed is normally measured in fraction of Kilo Watt Hour
(KWh) pulses. This information can be used to accurately calibrate any meter or to report
measurement during normal operation. In order to serve both these tasks efficiently the
microcontroller has to accurately generate and record the number of these pulses. It is a general
requirement to generate these pulses with relatively little jitter. Although, time jitters are not an
indication of bad accuracy, as long as the jitter is averaged out it would give a negative
indication on the overall accuracy of the meter.
We use the average power to generate the energy pulses. The average power (calculated by the
foreground process) is accumulated every SD16 interrupt. This is equivalent to converting it to
energy. Once the accumulated energy crosses a threshold, a pulse is generated. The amount of
energy above this threshold is kept and new energy amount is added on top of it in the next
interrupt cycle. Since the average power tends to be a stable value, this way of generating
energy pulses are very steady and free of jitter.
14 Implementation of a Three-Phase Electronic Watt-Hour Meter Using the MSP430F471xxSLAA409A
The threshold determines the energy “tick” specified by the power company and is a constant.
For example this can be in KWh. In most meters, the pulses per KWh decide this energy tick.
For example in this application the number of pulses generated per KWh is set to 1600 for active
and reactive energies. The energy “tick” in this case is 1KWh/1600. In addition to total three
phase energy pulses, pulses for individual phases are also generated and indicated via LEDs on
the board. Port pins are toggled for the pulses with control over the pulse width for each pulse.
Figure 12 shows the flow diagram for pulse generation.
SD16 interrupts
@ 4096 Hz
Energy
Accumulator+=
Average Power
N Energy Accumulator >
1KWh threshold?
Y
Energy Accumulator -
=1KWh threshold?
Generate 1
pulse
Proceed to other
tasks
Figure 12: Pulse generation for energy indication
The average power is in units of 0.01W and 1KWh threshold is defined as
1KWh threshold =1/0.01 * 1KW * (Number of interrupts/sec) * (number of seconds in 1 Hr)
= 100000 * 4096 * 3600 = 0x15752A00000
Implementation of a Three-Phase Electronic Watt-Hour Meter Using the MSP430F471xx 15SLAA409A
4.4 Energy meter configuration
Include files are used to initialize and configure the energy meter to perform several metrology
functions. In this section we list some of the options available that are user configurable. The file
that needs modification is the “emeter-3ph-neutral-47197.h” present in the parent directory
“emeter-ng”. It includes macro definitions that are used during the normal operation of the meter.
1. SERIAL_CALIBRATION_SUPPORT: This macro when defined will allow the meter to be
calibrated using the GUI provided and RS-232 interface to the PC.
2. MAINS_FREQUENCY_SUPPORT: The macro when defined will configure the meter to
measure the frequency of the mains.
3. MAINS_NOMINAL_FREQUENCY: The macro defines the default mains frequency, which
will be as a starting point for dynamic phase correction for non-linear CTs, or other sensors
for which the phase changes with the current.
4. TOTAL_ENERGY_PULSES_PER_KW_HOUR: This macro defined the total number of
pulses per 1KWh of energy. In this application it is defined to 1600. It is important to note that
this value is not a standard, but widely used by many meter manufacturers. There could be a
practical limit set on this number due to the reference meter’s ability to accept fast pulses
(due to large currents). This number is true for total three phase energy only.
5. PHASE_ENERGY_PULSES_PER_KW_HOUR: This macro defined the total number of
pulses per 1KWh of energy at each phase. In this application it is defined to 1600 if pulses
generation for each individual phase has been enabled
6. INHIBIT_NEGATIVE_PHASE_POWER_ACCUMULATION: This macro will prevent negative
energy to be accumulated at individual phases. Negative energy could be a result of
reversed connection at the voltage or current but not both at any of the phases.
7. INHIBIT_NEGATIVE_TOTAL_POWER_ACCUMULATION: This macro will prevent negative
energy to be accumulated for the three phases combined. Negative energy could be a result
of reversed connection at the voltage or current but not both at any of the phases.
8. ENERGY_PULSE_DURATION: This macro defines the duration of the LED ON time for an
energy pulse. This is measured in ADC samples (i.e. increments 1/4096 s). The maximum
allowed is 255, giving a pulse of about 62.5 ms and 163 gives a 40 ms pulse. This duration
might be too large with adjacent pulses overlapping when very high currents are measured.
It is recommended that this value be changed to a smaller number such as 80, if overlap is
seen at the pulse outputs.
9. RESIDUAL_POWER_CUTOFF: Tiny power levels should not record at all, as they may just
be rounding errors, noise, or the consumption of the meter itself. This value is the cutoff
level, in 0.01 Watt increments. In this application it is set to 250, resulting in a start-energy of
about 2.5 Watts
10. NEUTRAL_MONITOR_SUPPORT: This macro enables the support for neutral monitoring.
The 7th SD16 is used for this purpose.
11. LIMP_MODE_SUPPORT: This macro is used to enable the meter to operate under LIMP
mode.
16 Implementation of a Three-Phase Electronic Watt-Hour Meter Using the MSP430F471xxSLAA409A
12. MAINS_NOMINAL_VOLTAGE: This macro defines the nominal voltage to be used during
LIMP mode. Nominal voltage is used for power calculations during this mode.
13. VRMS_SUPPORT: This macro is used to configure the meter to calculate VRMS from the
voltage samples.
14. IRMS_SUPPORT: This macro is used to configure the meter to calculate IRMS from the
current samples.
15. REACTIVE_POWER_SUPPORT: This macro is used to configure the meter to calculate the
reactive power from the voltage and current samples.
16. REACTIVE_POWER_BY_QUADRATURE_SUPPORT: This macro is used to configure the
meter to calculate the reactive power from the delayed voltage samples by 90 degrees and
current samples instead of using the power triangle method.
17. APPARENT_POWER_SUPPORT: This macro is used to configure the meter to calculate the
apparent power.
18. POWER_FACTOR_SUPPORT: This macro is used to configure the meter to calculate the
power factor for both lead and lag. A frequency independent method, based on the ratio of
scalar dot products, is used.
19. TOTAL_ACTIVE_ENERGY_SUPPORT: This macro is used to configure the meter to
calculate the total 3-phase active energy consumption.
20. PER_PHASE_ACTIVE_ENERGY_SUPPORT: This macro is used to configure the meter to
calculate the active energy consumption for individual phases in addition to the total 3-phase
active energy.
21. TOTAL_REACTIVE_ENERGY_SUPPORT: his macro is used to configure the meter to
calculate the total 3-phase reactive energy consumption.
22. PER_PHASE_REACTIVE_ENERGY_SUPPORT: This macro is used to configure the meter
to calculate the reactive energy consumption for individual phases in addition to the total 3-
phase reactive energy.
23. TEMPERATURE_SUPPORT: This switch enables use of the MSP430's internal temperature
sensor to measure the meter's temperature.
24. MAGNETIC_INTERFERENCE_CURRENT: This macro defines the current to be used during
anti-tampering. When magnetic tampering is detected, the output of CTs is completely
unreliable. The meter can only assume there is a very high load at unity power factor, and
charge accordingly. In this application the units for this current is mA and is set to 60000
(60A) to be used for calculations.
25. RTC_SUPPORT: This macro is used to configure the meter to support a real-time clock. A
software RTC is implemented for this purpose.
26. CORRECTED_RTC_SUPPORT: This macro enables temperature compensation for the
real-time clock. It performs basic error compensation for the MSP430's 32 kHz crystal
oscillator to enable a higher quality RTC source, even using low accuracy (Eg: 20ppm)
crystals.
Implementation of a Three-Phase Electronic Watt-Hour Meter Using the MSP430F471xx 17SLAA409A
27. CURRENT_PHASE_GAIN: This macro defines the gain of the SD16’s internal
programmable gain amplifier (PGA) for all the three currents. In this application it is set to 1.
28. CURRENT_NEUTRAL_GAIN: This macro defines the gain of the SD16’s internal PGA for
neutral current monitoring. In this application it is set to 16.
29. VOLTAGE_GAIN: This macro defines the gain of the SD16’s internal programmable gain
amplifier (PGA) for all the three voltages. In this application it is set to 1.
30. PHASE_REVERSED_DETECTION_SUPPORT: This macro configures the meter to detect
reversed power condition.
31. PHASE_REVERSED_IS_TAMPERING: This macro configures the meter to treat phase
reversed connections as tampering.
32. DEFAULT_V_RMS_SCALE_FACTOR_A: This macro holds the scaling factor for voltage at
phase 1, this can be set to a value that is in fairly acceptable range and will be fine tuned
during calibration.
33. DEFAULT_V_RMS_SCALE_FACTOR_B: This macro holds the scaling factor for voltage at
phase 2, this can be set to a value that is in fairly acceptable range and will be fine tuned
during calibration.
34. DEFAULT_V_RMS_SCALE_FACTOR_C: This macro holds the scaling factor for voltage at
phase 3, this can be set to a value that is in fairly acceptable range and will be fine tuned
during calibration.
35. DEFAULT_I_RMS_SCALE_FACTOR_A: This macro holds the scaling factor for current at
phase 1, this can be set to a value that is in fairly acceptable range and will be fine tuned
during calibration.
36. DEFAULT_I_RMS_SCALE_FACTOR_B: This macro holds the scaling factor for current at
phase 2, this can be set to a value that is in fairly acceptable range and will be fine tuned
during calibration.
37. DEFAULT_I_RMS_SCALE_FACTOR_C: This macro holds the scaling factor for current at
phase 3, this can be set to a value that is in fairly acceptable range and will be fine tuned
during calibration.
38. DEFAULT_P_SCALE_FACTOR_A_LOW: This macro holds the scaling factor for active
power at phase 1, this can be set to a value that is in fairly acceptable range and will be fine
tuned during calibration.
39. DEFAULT_P_SCALE_FACTOR_B_LOW: This macro holds the scaling factor for active
power at phase 2, this can be set to a value that is in fairly acceptable range and will be fine
tuned during calibration.
40. DEFAULT_P_SCALE_FACTOR_C_LOW: This macro holds the scaling factor for active
power at phase 3, this can be set to a value that is in fairly acceptable range and will be fine
tuned during calibration.
18 Implementation of a Three-Phase Electronic Watt-Hour Meter Using the MSP430F471xxSLAA409A
41. DEFAULT_I_RMS_SCALE_FACTOR_NEUTRAL: This macro holds the scaling factor for
current at neutral, this can be set to a value that is in fairly acceptable range and will be fine
tuned during calibration.
42. DEFAULT_P_SCALE_FACTOR_NEUTRAL: This macro holds the scaling factor for active
power at neutral, this can be set to a value that is in fairly acceptable range and will be fine
tuned during calibration.
43. DEFAULT_BASE_PHASE_A_CORRECTION_LOW: This macro holds the value for phase
correction to compensate for the delay coming from the current transformer at phase 1. This
can be set to a value that is in fairly acceptable range and will be fine tuned under phase
correction during calibration.
44. DEFAULT_BASE_PHASE_B_CORRECTION_LOW: This macro holds the value for phase
correction to compensate for the delay coming from the current transformer at phase 2. This
can be set to a value that is in fairly acceptable range and will be fine tuned under phase
correction during calibration.
45. DEFAULT_BASE_PHASE_C_CORRECTION_LOW: This macro holds the value for phase
correction to compensate for the delay coming from the current transformer at phase 3. This
can be set to a value that is in fairly acceptable range and will be fine tuned under phase
correction during calibration.
5 Energy meter demo
The energy meter evaluation module (EVM) associated with this application note has the
MSP430F47197 and demonstrates up to three phase of energy measurements. The complete
demonstration platform consists of the EVM that can be easily hooked to any test system,
metrology SW and a PC GUI, which will be used to view results and perform calibration. In this
section we will discuss all of these in detail.
5.1 Hardware platform
The EVM consists of two boards, one which is the power supply board and the other which the
metrology board. A 10-pin connector interfaces the two boards. The power supply board has
been separated from the metrology board for ease of use and also to provide better immunity to
ESD and EFT.
5.1.1 EVM overview
The following figures of the EVM best describe the HW. Figure 1 is the top view of the energy
meter. The enclosure helps for easy evaluation of the energy meter. The enclosure
encapsulates the two boards and on-board current sensors which are CTs.
Implementation of a Three-Phase Electronic Watt-Hour Meter Using the MSP430F471xx 19SLAA409A
Figure 13: Top view of the 3-phase Energy meter EVM
The top of the EVM shows a 160 segment LCD that displays energy, voltage, current, RTC etc.
for all three phases. There is a RS-232 connector available to interface to a PC. Also there is a
provision for JTAG to program the MSP430, connector for the Chipcon transceivers and on-
board switches for display control.
Figure 14 shows the front view of the EVM with connections that need to be made to the current
outputs from the test system. Starting from the right going left connections for current is made.
GND on the extreme right can also be connected from the top with the voltages as shown in
Figure 15.
20 Implementation of a Three-Phase Electronic Watt-Hour Meter Using the MSP430F471xxSLAA409A
Figure 14: Front view with current connections
V1+ V2+ V3+ GND
Figure 15: Top view with voltage connections
Implementation of a Three-Phase Electronic Watt-Hour Meter Using the MSP430F471xx 21SLAA409A
5.1.2 Power supply options
The EVM can be configured to operate with different sources for power. The various sources of
power to the MSP430 are JTAG, mains voltage, backup-battery.
Power option Header JP1 Header JP2 Header JP7
JTAG Jumper on [1-2] No jumper No jumper
Mains supply Jumper on [2-3] Jumper present No jumper
Back-up Battery Jumper on [2-3] Jumper present Jumper present
Table 1: Power supply selection for MSP430
Table 1 lists the settings on headers JP1, JP2 and JP3 for different options as a source to power
the MSP430. By default if no jumper is present on JP1, the MSP430 will still be powered off the
mains supply. However, it is important to note that during JTAG programming, a jumper must be
present on JP1 [2-3] to indicate external voltage is supplied to the MSP430 and align all JTAG
lines out of the USB-FET to this voltage level.
When powered by the mains supply JP2 header can also be treated as a current consumption
header by placing an ammeter across. Also, when powered via JTAG, the current consumption
header will no longer JP2, instead the ammeter can be connected across [1-2] of header JP1.
5.2 Loading the example code
The source code is developed in the IAR environment using IAR compiler version 4.11. If earlier
versions of IAR are used, the project files will not open. If later than 4.11 versions are used when
project is loaded, a prompt to create a back-up will be issued and the user can click YES to
proceed. There are two parts to the energy metrology software, the tool kit which contains a
library of mostly mathematics routines and the main code which has the source and include files.
The entire source code is available as zip file attachment with this application note. After the zip
is decompressed, two folders will be shown, one for source and the other folder that has the
calibration GUI.
5.2.1 Opening the project
The “source” folder structure is shown below
The folder “emeter-ng” contains project files for various MSP430 devices and for this application
“emeter-47197.ewp” project file is to be used. The folder “emeter-toolkit” has corresponding
project file “emeter-toolkit-47197.ewp”. For first time use, it is recommended that both the
projects be completely rebuild.
22 Implementation of a Three-Phase Electronic Watt-Hour Meter Using the MSP430F471xxSLAA409A
Open IAR window, find and load the project “emeter-toolkit-47197.ewp” and do a rebuild all.
Then close the existing workspace and open the main project “emeter-47197.ewp”, rebuild all
and load this on to the MSP430F47197 energy meter. This is shown in the snapshot below.
Figure 16: Project build in IAR
Implementation of a Three-Phase Electronic Watt-Hour Meter Using the MSP430F471xx 23SLAA409A
Once the main project has be rebuilt, load it on to the EVM and hit GO from the Debug menu.
Use appropriate jumper settings at Jumper JP1, a jumper placed at pins [1-2] will power the
MSP430 from the USB-FET and jumper placed between [2-3] will power the MSP430 with
external power. The external power can be from the mains and this is controlled
6 Results and Calibration
If the procedures and configurations are complete in the previous two sections, the results can
be observed and based on these, calibration can be performed. Calibration is key to any meter’s
performance and is absolutely necessary for every meter to go through this process. Initially
every meter would exhibit different accuracies due to silicon-silicon differences, sensor
accuracies and other passive tolerances. In order to nullify their effects, every meter should be
calibrated. In this section we will show simple procedures in order to accomplish this process.
For any calibration to be performed accurately there should be an accurate source available.
The source should be able to generate any desired voltage, current and phase shifts (between V
and I) or power factors. In addition to an accurate source, there should also be a reference
meter that will act as an arbitrator between the source and the meter being calibrated. In this
section we discuss a simple and effective method of calibration of this 3-phase EVM.
A PC GUI is part of the downloadable zip file with this application note. After decompressing the
zip file, a folder by the name “GUI” will have all the necessary files to run this application.
6.1 Viewing results
Once the meter is turned ON, the results can be easily viewed using this GUI by connecting the
RS-232 header to the PC. Open the executable “calibrator.exe” in the GUI folder.
24 Implementation of a Three-Phase Electronic Watt-Hour Meter Using the MSP430F471xxSLAA409A
Under correct connections the user should see the GREEN filled button under “Comms”. If there
problems with connections or if the code is not configured correctly the button will have the color
RED.
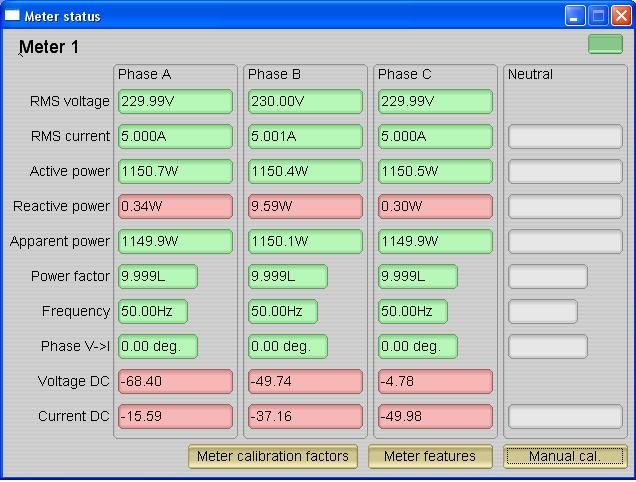
Click on the green button and we will see the meter results immediately on the GUI. A sample of
this is shown below
The configuration of the meter can also be viewed by clicking on “Meter features” to get this
screen
Results can also be viewed as pulses fed back to any energy meter test setup. Energy pulses
for total active and total reactive energies are available at JP8 (ACT) and JP9 (REACT). In
addition, the pulses go through on-board opto-couplers that might be necessary for interface to
any test equipment.
Implementation of a Three-Phase Electronic Watt-Hour Meter Using the MSP430F471xx 25SLAA409A
6.2 Calibrating the meter
The meter can be calibrated for each phase or total three phases easily using the GUI. Usually
gain correction for voltage and current can be done simultaneously for all 3-phases and gain
correction for active power must be done individually. Phase correction follows gain correction
and this must also be done for each phase individually.
6.2.1 Gain correction
Gain correction for voltage and current can be done simultaneously and the procedure is
discussed below
1. Connect GUI to view results for all 3-phases
2. Click on Manual cal seen in the above screen shot to give you this screen
3. The values that need to be entered are in % and this value is calculated by the following
formula. For example for any particular voltage the value will be
⎛V ⎞
% VAL = ⎜⎜ Observed − 1⎟⎟ × 100
⎝ Vdesired ⎠
4. Negative values are accepted in the voltage and current fields and the same procedure is
applicable for other voltages and currents. For voltages enter in field “Voltage” and for
currents, enter in field Current (low). After these values are entered, click on Update meter.
5. Gain correction for active power is done differently; the accuracy obtained from any test
system when pulses are fed from the meter is the most accurate method. When calibrating
Phase A, disable currents for Phase B and Phase B and have only their voltages ON.
6. Measure accuracy in the reference meter of the test system. This gives the true accuracy of
the meter for Phase A active energy.
26 Implementation of a Three-Phase Electronic Watt-Hour Meter Using the MSP430F471xxSLAA409A
7. Enter the “% accuracy” seen as-is in the Active (low) field. Click on update meter to do a gain
correction on Phase A. Repeat this for all three phases individually disabling currents for the
remaining two phases.
6.2.2 Phase correction
Phase correction has to be done on each phase individually and the following is the procedure.
1. Individually for Phase A, set voltage and current with a phase shift of +60 Degrees.
2. See % error on the test setup. If errors are not acceptable, start to enter values for the Phase
(low) field. Only increments/decrements should be entered in this field and preferably start
with 1 or -1 to determine the direction of correction. Click “Update meter”.
3. Measure error again to see if error increased/decreased. If error decreased, continue to add
desired increments till you arrive at an error close to zero, else add decrements.
4. Click on “Update meter” every time a modification is made to this field.
5. Change the phase now to -60 Degrees and check if this error is still acceptable. If not, fine
tune the values of Phase (low) again. Ideally, errors should be symmetric for same phase
shift on lag and lead conditions.
6. Repeat procedures 1 to 4 for phase B and C individually.
Once the meter has been calibrated it is possible to see these calibrated values for reference.
Click on “Meter calibration factors” to get this screen (sample values only).
Implementation of a Three-Phase Electronic Watt-Hour Meter Using the MSP430F471xx 27SLAA409A 7 Schematic 28 Implementation of a Three-Phase Electronic Watt-Hour Meter Using the MSP430F471xx
SLAA409A

8     Results
      Figure 17 shows the results of the energy meter EVM.

                                                           F47197 Accura cy Re sults
                           1
                         0.9
                         0.8
                         0.7
                         0.6              0 P hase shift             60 P hase shift            -60 P hase shift

                         0.5
                         0.4
                         0.3
                         0.2
          Accuracy (%)

                         0.1
                           0
                         -0.1
                         -0.2
                         -0.3
                         -0.4
                         -0.5
                         -0.6
                         -0.7
                         -0.8
                         -0.9
                           -1        -1                         0                           1                           2
                                10                         10                          10                          10
                                                                    Curre nt (A)

                                             Figure 17: Active power results
      Highlights of the results
    1. Less than 0.1% accuracy for unity PF at room temperature for a dynamic range of 2400:1
    2. Less than 0.03% accuracy for unity PF at room temperature for a dynamic range of 1200:1
    3. Overall accuracy of 0.3% for phase lag and lead at room temperature for a dynamic range of
       2400:1
    4. Overall accuracy of 0.2% for phase lag and lead at room temperature for a dynamic range of
       1200:1

                                Implementation of a Three-Phase Electronic Watt-Hour Meter Using the MSP430F471xx 29
SLAA409A
9 Reference
1 IEC62053 electricity meter specification
2 GB/T 17883-1999 electricity meter specification
3 MSP430F471x6 , F471x7 data sheets
4 MSP430x4xx Family User’s Guide SLAU056
30 Implementation of a Three-Phase Electronic Watt-Hour Meter Using the MSP430F471xxIMPORTANT NOTICE
Texas Instruments Incorporated and its subsidiaries (TI) reserve the right to make corrections, modifications, enhancements, improvements,
and other changes to its products and services at any time and to discontinue any product or service without notice. Customers should
obtain the latest relevant information before placing orders and should verify that such information is current and complete. All products are
sold subject to TI’s terms and conditions of sale supplied at the time of order acknowledgment.
TI warrants performance of its hardware products to the specifications applicable at the time of sale in accordance with TI’s standard
warranty. Testing and other quality control techniques are used to the extent TI deems necessary to support this warranty. Except where
mandated by government requirements, testing of all parameters of each product is not necessarily performed.
TI assumes no liability for applications assistance or customer product design. Customers are responsible for their products and
applications using TI components. To minimize the risks associated with customer products and applications, customers should provide
adequate design and operating safeguards.
TI does not warrant or represent that any license, either express or implied, is granted under any TI patent right, copyright, mask work right,
or other TI intellectual property right relating to any combination, machine, or process in which TI products or services are used. Information
published by TI regarding third-party products or services does not constitute a license from TI to use such products or services or a
warranty or endorsement thereof. Use of such information may require a license from a third party under the patents or other intellectual
property of the third party, or a license from TI under the patents or other intellectual property of TI.
Reproduction of TI information in TI data books or data sheets is permissible only if reproduction is without alteration and is accompanied
by all associated warranties, conditions, limitations, and notices. Reproduction of this information with alteration is an unfair and deceptive
business practice. TI is not responsible or liable for such altered documentation. Information of third parties may be subject to additional
restrictions.
Resale of TI products or services with statements different from or beyond the parameters stated by TI for that product or service voids all
express and any implied warranties for the associated TI product or service and is an unfair and deceptive business practice. TI is not
responsible or liable for any such statements.
TI products are not authorized for use in safety-critical applications (such as life support) where a failure of the TI product would reasonably
be expected to cause severe personal injury or death, unless officers of the parties have executed an agreement specifically governing
such use. Buyers represent that they have all necessary expertise in the safety and regulatory ramifications of their applications, and
acknowledge and agree that they are solely responsible for all legal, regulatory and safety-related requirements concerning their products
and any use of TI products in such safety-critical applications, notwithstanding any applications-related information or support that may be
provided by TI. Further, Buyers must fully indemnify TI and its representatives against any damages arising out of the use of TI products in
such safety-critical applications.
TI products are neither designed nor intended for use in military/aerospace applications or environments unless the TI products are
specifically designated by TI as military-grade or "enhanced plastic." Only products designated by TI as military-grade meet military
specifications. Buyers acknowledge and agree that any such use of TI products which TI has not designated as military-grade is solely at
the Buyer's risk, and that they are solely responsible for compliance with all legal and regulatory requirements in connection with such use.
TI products are neither designed nor intended for use in automotive applications or environments unless the specific TI products are
designated by TI as compliant with ISO/TS 16949 requirements. Buyers acknowledge and agree that, if they use any non-designated
products in automotive applications, TI will not be responsible for any failure to meet such requirements.
Following are URLs where you can obtain information on other Texas Instruments products and application solutions:
Products Applications
Amplifiers amplifier.ti.com Audio www.ti.com/audio
Data Converters dataconverter.ti.com Automotive www.ti.com/automotive
DLP® Products www.dlp.com Broadband www.ti.com/broadband
DSP dsp.ti.com Digital Control www.ti.com/digitalcontrol
Clocks and Timers www.ti.com/clocks Medical www.ti.com/medical
Interface interface.ti.com Military www.ti.com/military
Logic logic.ti.com Optical Networking www.ti.com/opticalnetwork
Power Mgmt power.ti.com Security www.ti.com/security
Microcontrollers microcontroller.ti.com Telephony www.ti.com/telephony
RFID www.ti-rfid.com Video & Imaging www.ti.com/video
RF/IF and ZigBee® Solutions www.ti.com/lprf Wireless www.ti.com/wireless
Mailing Address: Texas Instruments, Post Office Box 655303, Dallas, Texas 75265
Copyright © 2009, Texas Instruments IncorporatedYou can also read