Cloning, overexpression and biophysical characterization of grd/grl/wrt domains from
←
→
Page content transcription
If your browser does not render page correctly, please read the page content below
Characterization of grd/grl/wrt domains from C. elegans

                              Södertörns högskola | Institutionen för Livsvetenskaper
                              Magisteruppsats 30 hp | vårterminen 2008

                              Cloning, overexpression and
                              biophysical characterization of
                              grd/grl/wrt domains from
                              Caenorhabditis elegans in
                              Escherichia coli

                              Av: Marie Lindberg
                              Handledare: Prof. Kurt D. Berndt / Tobias Elgán

                                                                                        0
Characterization of grd/grl/wrt domains from C. elegans

1     Table of contents
1     Table of contents……………………………………………………………………….. 1
2     Abstract……………………………………………………………………………….....2
3     Introduction……………………………………………………………………………...3
    3.1 Proteins………………………………………………………………………………3
    3.2 Disulfide bonds & folding………………………………………………………….. 5
    3.3 Redox buffers……………………………………………………………………….. 7
4     Materials & Methods……………………………………………………………………9
    4.1 Cloning……………………………………………………………………………....9
    4.2 Quick change………………………………………………………………………..10
    4.3 Expression…………………………………………………………………………...10
    4.4 Purification…………………………………………………………………………..11
    4.5 Refolding…………………………………………………………………………….12
      4.5.1 Air oxidation……………………………………………………………………..12
      4.5.2 DTT redox buffer ………………………………………………………………..13
    4.6 CNBr…………………………………………………………………………………13
5     Results & discussion…………………………………………………………………….14
    5.1 Expression……………………………………………………………………………14
    5.2 Purification…………………………………………………………………………...15
    5.3 CD…………………………………………………………………………………… 17
    5.4 Refolding……………………………………………………………………………..18
      5.4.1 Air oxidation……………………………………………………………………...18
      5.4.2 DTT redox buffer…………………………………………………………………19
    5.3 CNBr analysis of grd-13…………………………………………………………….. 21
6    Conclusions and future perspectives………………………………………….…...……...23
7     References………………………………………………………………………………..24

                                                                       1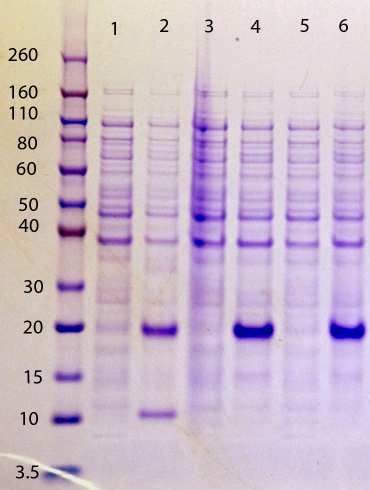
Characterization of grd/grl/wrt domains from C. elegans

    2 Abstract
Hedgehog related genes have been shown to play a major role in development in all
deuterostomes. In C.elegans, such genes have been found where the similarity is restricted to the
C-terminal domain. This work has focused on the hedgehog related C.elegans proteins called
ground (grd), ground-like (grl), and wart (wrt) which appear to form a unique structural family.
These proteins are cysteine rich and have conserved cysteine patterns which, together with the
thought that they are secreted, are expected to be in disulfide form. Since the extracellular
environment is very oxidizing and due to the conserved cysteine pattern, disulfide bonds are
thought to play a big part in the folding and stabilization of these proteins. The stability of the
protein and the formation of a disulfide bond are related through a thermodynamic cycle, which
insures that the stabilization of the protein by the disulfide is reflected by the identical
stabilization of the disulfide by the protein. Practically, there are numerous parameters that can
be used to try to achieve the correct disulfide bonds and folding, when doing in vitro trials, some
of which were used in this project. C.elegans proteins grd-5, grd-13, grl-24, wrt-3 and wrt-5 were
studied in this project. All of the proteins were expressed and purified with success, with the
exception of grl-24. All constructs formed inclusion bodies. Some refolding attempts were
performed on grd-13 and wrt-3. The presence of a disulfide bond in refolded grd-13 was
demonstrated using chemical fragmentation. In general, these attempts did not give correctly
folded proteins but provide a foundation to continue experiments aimed at producing a native-
like protein for structural and functional studies.

                                                                                                 2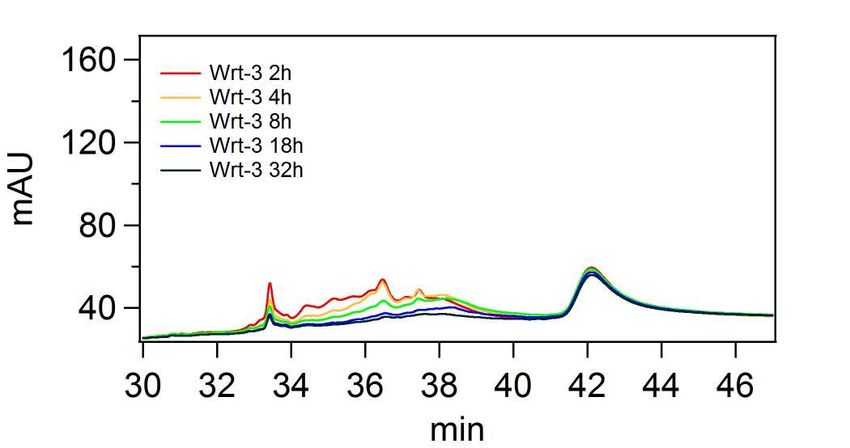
Characterization of grd/grl/wrt domains from C. elegans

3 Introduction
In all deuterostomes there is a family of proteins related to hedgehog proteins found initially in
Drosophila. They are all paracrine factors that are secreted. For theses signaling molecules,
disulfide bonds are important for the structure, and perhaps the function. When doing in vitro
refolding experiments redox buffers are often used, they help when forming the disulfide bonds.
This project is designed as a first step towards understanding how the proteins are involved and
functions in the signaling system.

3.1 Proteins
In Drosophila, Hedgehog genes are involved in the development of the fruit fly. The hedgehog
genes comprise one family of proteins involved in cell-cell signaling. The classical hedgehog
protein consists of two domains. The N-terminal domain “hedge” is the biologically active
signal. The C-terminal “hog” domain has autoproteolytic activity and is responsible for the
activation and release of the signal (4).

                                                                              ‘

                                  Fig 1 (1) Hedgehog realted
                                  protein Schematic picture of the
                                  domain organization in the
                                  hedgehog related genes

In Caenorhabditis elegans, there are several hedgehog related genes, where the similarity is
restricted to the C-terminal domain called hog. It is the N-terminus of these C.elegans genes that
divide them into different families called wart (wrt), ground (grd) and ground-like (grl). Wrt and
grd can exist with or without a hog domain, while grl has never been observed to exist together
with a hog domain (4,5).

Cysteines appear to be important for these wrt/grd/grl proteins, as evidenced by conserved
patterns of cysteine amino acids (4,5). The Hog domain has a conserved Cys-Phe sequence at the
position of the cleavage site. The different wrt proteins have eight conserved cysteines. The grd
proteins typically have four cysteines (with a few exceptions) (5). In grd proteins, it appears that

                                                                                                  3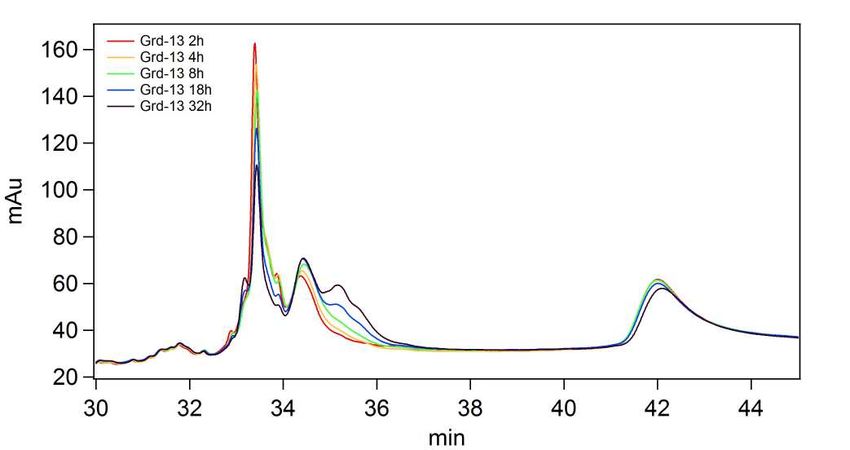
Characterization of grd/grl/wrt domains from C. elegans

the cysteines are organized into one doublet and two singlets, as can be seen by sequence
alignments.
The grl proteins share some features with grd & wrt, like a central core motif and secondary
structure, the central core motif have no known function (see Fig. 2) (2). A big difference is in
the cysteine pattern where one of the cysteines in the doublet is lost. Based on sequence
comparisons, the cysteines are lost or gained pairwise between the different proteins in the grl
and grd families, but there is always cysteines present. This is a sign that they might form
disulfide bond. Also relevant is the fact that the proteins are secreted, which due to the often
oxidizing nature of the extracellular environment, adds to the possibility of disulfide bond
formation.

                                                                   Fig 2 Conserved cysteine pattern and
                                                                   secondary structure(2) The conserved
                                                                   cysteine patterns in the different
                                                                   domains of wrt, grd, and grl. Predicted
                                                                   secondary structure is also shown.

Some structural predictions can be made by examining alignments. The first half of the protein
shows high scores for two α helices (2). The second half shows high scores for β strands (3 or 4)
that could form a β sheet. At the beginning of the first α helix there is a conserved cysteine.
Figure 3 shows an alignment of the protein sequences used in this project with the cysteines
highlighted.

                                                                                                             4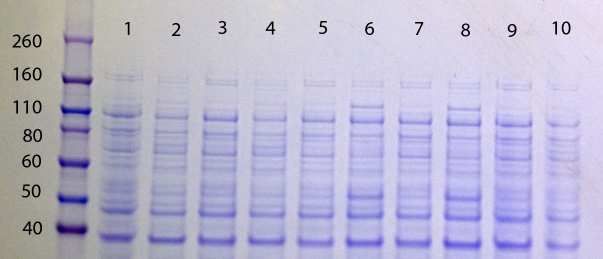
Characterization of grd/grl/wrt domains from C. elegans

               ....|....| ....|....| ....|....| ....|....| ....|....| ....|....| ....|....|
                   5          15         25         35         45         55         65
Wrt-3          DYCGSDQVPY GMEVHHSGVV RLMCSKPNCY DKNYSDCPER AESRHGCQKS NQWVGGFEKN IEGDLYTMCC
wrt-5          DYCGDHKVPF GMEVHKNGNV NILCSRPSCH EKKYAECPER ~ATSTTCSTN SSWVGGVTQH SDGSLRLMCC

               ....|....| ....|....| ....|....| ....|....| ....|....| ....|....| ....|....|
                   75         85         95        105        115        125        135
Wrt-3          EFEGLEKYAK VRYSDVRIRR GEFFEGEEKE NDDGDVVKFD VIKDIRMHKD DEGQAYYNLT VLSFNCESIP
wrt-5          EYDLLPTYST IQYEKLTIRT GEYFEGD~EQ MEGDVVTAFD LIGNIEQVKE PDGKYSYNLL IYRYHCGNIP

               ....|....| ....|....|
                  145        155
Wrt-3          DVKPAWYQKS QWPYFQFAKN
wrt-5          DTPPAWYMKK QWPYWEK---

               ....|....| ....|....| ....|....| ....|....| ....|....| ....|....| ....|....|
                   5          15         25         35         45         55         65
Grd-5          ---------- --QDNCYIND SGFTCCNKEL ESAMKGAMGG D-----DLLG SADSIQKGAE GSLGGKFETV
Grd-13         AYDDLPKPAD PYQPPGTEPK TESTCPDPYK KIITQLRAEL GKDVSS--IK FTNQLGSRVQ KAFGSAHEIT

               ....|....| ....|....| ....|....| ....|....| ....|....| ....|....| ....|....|...
                   75         85         95        105        115        125        135
Grd-5          VALDDFAYKS HFKEGKSCKI EK~NGQYALA WQP------- ---------- ---------- ---------- ---
Grd-13         MGPSEATLKT NFN-GTICRH ASTDGFHYIV YPTPGQYNIN NAAVEEYFEK FAEFAALGKS ANIADLPKDP RNV

               ....|....| ....|....| ....|....| ....|....| ....|....| ....|....| ....|....|
                   5          15         25         35         45         55         65
grl-24         QDDNFEGERC NDVILYDIIK KASKKTDDPV IIRRTSMDTM QNVFPLARSM GCICTDRNFQ FPDFTNHRYC

               ....|....| ....                            Fig 3 Proteins used in this project Sequence
                   75                                     alignments between wrt-3 and wrt-5, grd-5
grl-24         SVRVSNFRCH AIVF                            and grd-13. Grl-24 by itself. Cysteines
                                                          highlighted.

3.2 Disulfide bonds & folding
One important aspect when it comes to protein structure is the presence of disulfide bonds. There
are several different factors that affects the making and breaking of a disulfide bond. Those
factors are among others, the redox potential of the environment and the stability of the disulfide
bond and the stability of the protein containing it. These features are linked thermodynamically,
which means that the stability of the protein and the stability of the disulfide (redox potential)
stem from the same origin (3).

The formation of the correct disulfide bond in vivo is thought to be a matter of trial and error.
When disulfide bonds are formed, they may not be the native one, in which case then the
disulfides will reshuffle until it forms the native disulfide, that will say the one with the lowest
Gibbs energy (6). If reshuffeling does not occur, the polypeptide is trapped in a covalent
intermediate which can be difficult to escape from. Protein disulfide isomerase (PDI) catalyzes
the formation of disulfide bonds. PDI have not been shown to direct the protein to the correct
disulfide bonds, only to speed up the trial and error process (7,8).

                                                                                                         5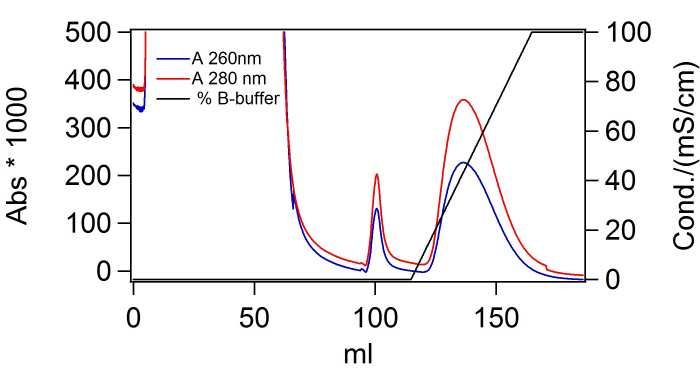
Characterization of grd/grl/wrt domains from C. elegans

The formation of a correct disulfide bond is not always easy – especially if the protein contains
many cysteines and the process is truly random. The number of possible conformations of
disulfide bonds that can be formed from a given number of cysteine residues can be calculated by
Eq 1, where n is the number of cysteines and p is the number of bonds.

                        n!                                Eq 1
                  p!(n − 2 p)!2 p
If there are only two cysteines it is easy because there is only one possible bond. For example if
there are eight cysteines that should form 4 specific disulfide bonds in the native protein, there is
only one correct pairing of the 8 cysteines out of 105 possible.

One problem that is often encountered while trying to form intramolecular disulfide bonds in
vitro is the formation of intermolecular dimers and oligomers. The formation of these dimers and
higher order oligomers can be decreased by using very diluted protein samples (9).

                                                                 Fig 4 Thermodynamic cycle A
                                                                 thermodynamic cycle that shows how the
                                                                 stability of the protein is affected by presence
                                                                 or absence of a disulfide bond and how the
                                                                 folding affects the disulfide bond. ∆G around
                                                                 the cycle must always sum up to 0. GSSG is
                                                                 oxidized glutathione , GSH is reduced
                                                                 glutathione. Figure taken from (3).

Figure 4 shows that the formation of a disulfide bond stabilizes and promotes the folding of the
protein and the folding of the protein promotes the formation of a disulfide bond. When a
disulfide bond is formed it organizes the unfolded protein to favor a particular folded state (when
looking at entropy). The folding of the protein favors the formation of a disulfide bond. Since it
is a thermodynamic cycle the ∆G calculated around the cycle must be zero. Gibbs free energy is
determined by the equilibrium constant.

                                                                                                                    6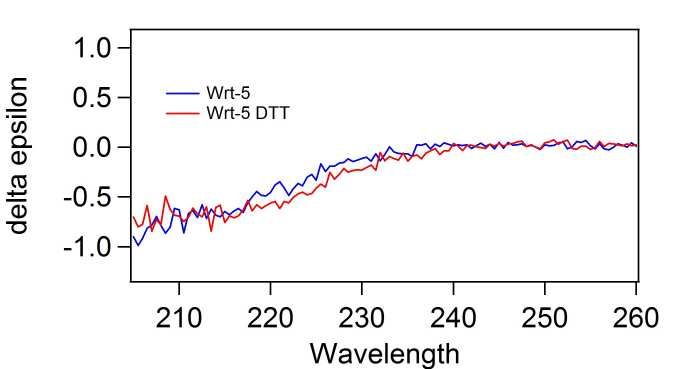
Characterization of grd/grl/wrt domains from C. elegans

                ∆G = − RT ln K eq                                   Eq 2

Entropy greatly affects the oxidation potential of the thiol/disulfide in unfolded proteins. It can be
related to the number of amino acids between the cysteines. The covalent loop formed when a
disulfide bond is formed will have to pay a penalty for creating geometric and entropic
constraints. The entropy directly affects the redox potential. Conformational entropy for an
unfolded protein increases when a disulfide bond is broken, and this decreases the stability of the
protein. There is an equation (eq 3) that can be used to calculate how a cross-link affects the
entropy, where n is the number or residues between the cysteines that are involved in the
disulfide bond (10).

           ∆S conf = −2.1 − (3 / 2) R ln n                            Eq 3

3.3 Redox buffers
A redox buffer is an aqueous solution of a thiol/disulfide pair of known redox potential and
predetermined concentrations of the oxidized and reduced components. One of the most common
redox buffers is prepared using glutathione (E°’ = -0.24 V) (11), which is readily available in
pure form in both the reduced and oxidized states. Another fairly common redox buffer is
prepared from dithiothreitol (DTT, E°’ = -0.33V) (12). DTT is commonly used for more stable
disulfides as DTT is significantly more reducing than glutathione. Dithiothreitol also has the
advantage of not remaining as an intermolecular disulfide due to the strong tendency to form
intramolecular disulfides, so there will not be that many mixed disulfides present, that can disturb
the folding.

The redox potential of a solution at non-standard conditions can be calculated by using the
Nernst equation (Eq. 4) (13). E is the observed redox potential. Eº is the redox potential at the
standard state (concentration 1M, 298K, 1atm) R is the ideal gas constant, T is the temperature in
Kelvin, F is the Faraday constant and Q is the ratio between the reduced and the oxidized state of
the redox buffer.

                          RT                        Eq 4
               E = E° −      ln Q
                          nF

                                                                                                    7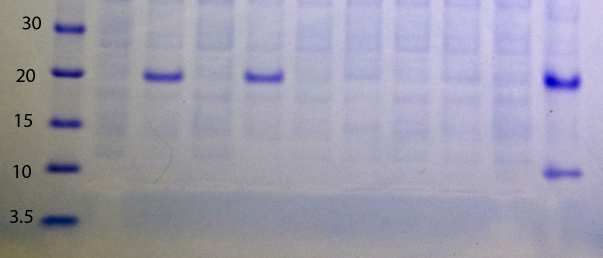
Characterization of grd/grl/wrt domains from C. elegans

When two cysteines are close to each other in space they may form a disulfide bond. When
glutathione is the reducing agent, the reaction will look like equation 5.

                                                          Eq 5
           P ( SH ) 2 + GSSG ↔ P ( SS ) + 2GSH

Here, P(SH)2 is a protein containing two cysteines in thiol form, GSSG is the oxidized form of
glutathione, P(SS) is the internally oxidized form of glutathione, and GSH is the reduced form of
glutathione. The stability of the disulfide bond in comparison to the stability of the GSH2/GSSG
pair is represented by the equilibration constant Kox, which is calculated by equation 6. This
equilibrium constant defines the oxidation potential of the dithiol P(SH)2.

                              [P(SS)][GSH ]
                                                2

                      K ox =                              Eq 6
                             [P(SH ) 2 ][GSSG ]

If for example a glutathione buffer with the redox potential of -263mV is to be prepared, the
concentrations of GSH and GSSG must to be calculated. Here it becomes clear that one solves
for the ratio [GSH]2/[GSSG]. Notice that a given ratio of [GSH]:[GSSG] will have different
redox potentials depending on the total concentration of glutathione in the solution. To prepare a
buffer, a total glutathione concentration (CT) must be selected such that CT = GSH + 2GSSG,
which then allows a unique solution to be calculated.

                RT [GSH ]
                                   2
− 0,263 = − E − 0
                  ln                           Eq 7
                nF [GSSG ]

The program Solver in Microsoft Excel was used to simplify this calculation. Equation 6 was
entered and GSH and GSSH were set to be variables to achieve the redox potential of -263mV
with the constraint of a given range for the total glutathione concentration. The concentrations of
GSH and GSSG were then obtained from the Solver routine. In this case the result was, GSH
18.5mM, GSSG 0.1mM.

                                                                                                 8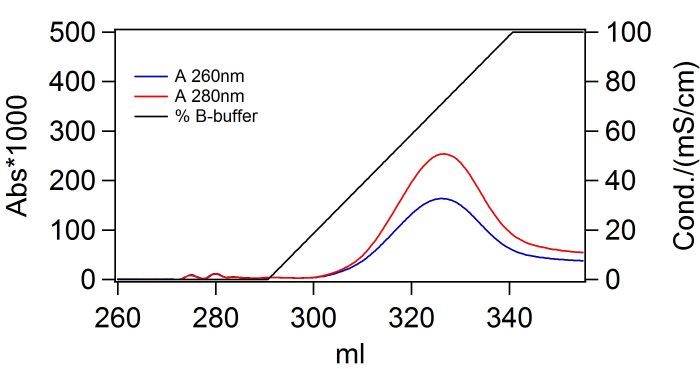
Characterization of grd/grl/wrt domains from C. elegans

4 Materials & Methods
4.1 Cloning
The pET-46 Ek/LIC overexpression vector uses the Ligand Independent Cloning (LIC) technique
to insert the gene into the vector. LIC does not require any restriction enzymes or ligation
reactions. Instead primers are designed to use in PCR which creates the desired gene with a
specific overhang complementary to the overhang in the pET vectors (14). The primers used for
the PCR were designed after guidelines from the Ek/LIC protocol (Table 1).

Genes containing the wrt, grd, or grl sequences were cloned from sequencing vectors as
identified from references (5) and (15) supplied as E. coli stab cultures or phage aliquots. Five
different cDNAs were used for this project: yk1580h06(grd-5), yk1620b07(grd-13),
yk123d11(grl-24) yk348a9(wrt-3), yk1139h04.3(wrt-5). A sample of the stab culture was grown
in SOC containing ampicilin (100µg/ml) at 37ºC overnight. The cell culture was transferred to an
Eppendorf tube and centrifuged at 13000 rpm in an Eppendorf centrifuge for 5 min. The cell
pellet was prepared for PCR by washing it in 1xPBS and centrifuging at 13000 rpm for 5min.
Aliquotes of phage were used directly in PCR without prior processing.

That pellet was washed once again in 1xPBS. The starting material (the sequencing plasmids
containing the desired genes) from either the cell pellet or virus solution were used directly as
template in PCR reactions which were prepared according to the protocol for the PFU DNA
polymerase (Promega).
    Primers

    Grd-5 Forward 5´ - GAC GAC GAC AAG ATG CAG GAC AAT TGC TAC ATC AAT G-3´
          Reverse 5´ - GAG GAG AAG CCC GGT TTA TGG CTG CCA TGC AAG - 3´

    Grd-13 Forward 5´ - GAC GAC GAC AAG ATG GCC TAT GAT GAT CTC CCA AAA C-3´
           Reverse 5´ - GAG GAG AAG CCC GGT TCA AAC GTT GCG TGG AT-3´

    Grl-16 Forward 5´ - GAC GAC GAC AAG ATG TGT ATC GGA GGT GCC GGA AGC -3´
           Reverse 5´ - GAG GAG AAG CCC GGT CAT TAA TCC TCC CAG GTA AGC-3´

    Grl-24 Forward 5´ - GAC GAC GAC AAG ATG CAA GAT GAT AAT TTT GAA GGT GAA C-3´
           Reverse 5´ - GAG GAG AAG CCC GGT TCA TTA AAA GAC AAT TGC ATG ACA C- 3´

    Wrt-3 Forward 5´ - GAC GAC GAC AAG ATG GAT TAC TGT GGA TCC GAT C-3´
          Reverse 5´ - GAG GAG AAG CCC GGT TCA GTT CTT TGC AAA TTG AAA G-3´

    Wrt-5 Forward 5´ - GAC GAC GAC AAG ATG GAC TAC TGT GGG GAT CAC -3´
          Reverse 5´ - GAG GAG AAG CCC GGT TCA TTA TTA TTT TTC CCA ATA CGG CCA C-3´

    Quick change mutagenesis primer

    Grd-5 Forward 5´ - CCT ACA AAT CTC ATT TCA AGG AGG GAA AAT CTT GCA AGA TCG - 3´
          Reverse 5´ - CGA TCT TGC AAG ATT TTC CCT CCT TGA AAT GAG ATT TGT AGG - 3´

              Table 1 Primers The primers used for amplification and quick change              9
Characterization of grd/grl/wrt domains from C. elegans
The PCR products (10 µl + 10 µl 6xSB + 40 µ l H2O) were run on a low melting 1% DNA-gel
(with 0.5mM ethidium bromide) in 1xTBE buffer (0.89M Tris-base, 0.89M Boric acid, 0.02M
EDTA, pH 8.0) at 100 V, for 40 min. DNA bands were visualized by exposure to UV light. The
band containing the PCR product was cut out by hand and purified by Wizard SV gel and PCR
clean-up system (Promega), according to protocol.
The purified PCR product was then ligated into a pET-46 Ek/LIC vector by following the
manufacturers protocol. The complete vector containing the wrt, grd, or grl genes was then
transformed into Giga single cells (Novagen) for plasmid preparation. These cells were grown on
a LB/amp plate overnight at 37 ºC. Colonies were selected and grown in LB/amp (100µg/ml),
37ºC with shaking overnight. Cells were harvested (13000rpm) and plasmid extracted and
purified using the Wizard plus SV minipreps DNA purification system (promega). Aliquotes of
the plasmid with the appropriate T7 sequencing primers were sent for sequencing to Uppsala
genome center (16).
4.2 Quick change:
The Grd-5 plasmid had an incorrect base apparently introduced during the PCR protocol. This
unwanted point mutation was corrected using the Quick change II site-directed mutagenesis kit
(Stratagene). Complementary primers were designed that had the correct base mismatch in the
middle (see Table 1). The protocol was followed and the corrected plasmid was transformed into
XL1-Blue super competent cells, colonies selected, and plasmid prepared. Aliquotes of the
plasmid with the appropriate T7 sequencing primers were sent for sequencing to Uppsala genome
center (16).
4.3 Expression:
Plasmids containing the wrt, grd or grl genes were transformed into BL21(DE3)Star cells
(Stratagene) for expression. Colonies were picked and grown in LB/amp (100 µg/ml) at 37 ºC
while shaking. For a test expression, a sample of overnight growth was diluted 50 times with LB
to a final volume of 10ml, and grown in 37 ºC with shaking to OD 0.7. Negative controls (no
induction) were taken at this time. The cultures were induced with 1mM isopropyl-beta-D-
thiogalactopyranoside (IPTG) and allowed to shake for 3h at 37 ºC. Aliquotes were run on an
SDS-PAGE gel (NOVEX 4-12% Bis-Tris Mini Gel, Invitrogen) with 1x NuPAGE MES buffer
system, to test for expression. The gels were stained by Coomassie Brilliant Blue R 250 (0.25g
were dissolved in 40% MeOH and 7% HOAc) and then destained using 10 % (v/v) aqueous
10Characterization of grd/grl/wrt domains from C. elegans
acetic acid. For the samples that showed expression, this was repeated in a larger scale. Glycerol
stocks of the BL21(DE3)Star cells containing the expression plasmid were prepared by taking 1
part of cell culture and 2 parts of 70% glycerol. Following expression, the cells were harvested
by centrifugation at 7000 rpm for 20 min at 4ºC.
4.4 Purification:
The cell pellets were resuspended in NPI-10 binding buffer (50mM NaH2PO4, 300mM NaCl,
10mM imidazole, pH 8.0). Hen egg lysozyme (0.1 mg/ml) was added to the cell pellets and the
suspension was incubated on ice for 30 min. After the incubation period, the cells were sonicated
(Branson S-250 analog sonicator, Sonifier) with a 13mm step horn, using maximum power 5
seconds on, 5 seconds off in a cycle for 2 min. The lysed cells were then centrifuged at 15000
rpm for 40 min at 4ºC to pellet cell debris. Preliminary experiments indicated that the proteins
were expressed as inclusion bodies in all cases and were present exclusively in the pellet at this
stage. The pellet was resuspended in NPI-10 binding buffer containing 8M urea to dissolve the
inclusion bodies and centrifuged again. Now the protein was found in the supernatant.
The expressed proteins were purified from the supernatant, taking advantage of the histidine
tagged N-terminus by using a 5ml Ni-NTA superflow cartridge (Qiagen) with an ÄKTA
purification system (GE health care). First the Ni-NTA superflow cartridge was equilibrated with
10 column volumes (CV) of NPI-10 binding buffer containing 8M urea. Then the sample was
loaded into the column, and then NPI-10 buffer containing 8M urea (2 column volumes, CV) was
flushed through to wash out nonspecifically bound proteins at a flow rate of 5 ml/min. The bound
protein was eluted using a gradient from NPI-20 (50mM NaH2PO4, 300mM NaCl, 20mM
imidazole, 8M urea, pH 8.0) to NPI-250 (50mM NaH2PO4, 300mM NaCl, 250mM imidazole,
8M urea, pH 8.0) over 10 CV. Column effluent was monitored by absorbance at 260 and 280 nm.
During the gradient, fractions of 5 ml were collected. Fractions containing the proteins were
identified by SDS-PAGE analysis and pooled.
The pooled samples were diluted 5 times to decrease the amount of imidazole (to a final volume
of 100 ml,and a concentration of 50mM), and then loaded back onto a clean Ni-NTA column.
Once the protein was bound, a gradient from 8M urea to buffers without urea was applied, this
was to try to refold the proteins. Once the urea was removed, an imidazole gradient from 20mM
to 250mM was applied, to elute the proteins.
11Characterization of grd/grl/wrt domains from C. elegans
To remove imidizole following the Ni-NTA column step, pooled fractions containing the protein
were concentrated by ultrafiltration (Amersham) using a YM-3 membrane (3kDa cutoff
membrane, Millipore). The concentrated sample was then diluted with a potassium phosphate
buffer (50mM, pH 7) and concentrated again. This was repeated until the concentration of
imidazole had been reduced from 250mM to < 1mM.
The protein concentration of the purified samples was determined by Beer’s law using a UV-
spectrophotometer (AVIV, model 14DS UV-VIS). The absorbance was measured at 280 nm.
Extinction coefficients used for calculation was determined via a “Protein calculator” based on
the method of Gill and von Hippel (17,18).
Protein Extinction Extinction MW (Da) # Cys
coefficient reduced coefficient oxidized
(M-1 cm-1) (M-1 cm-1)
Grd-5 9530 9770 9119 4
Grd-13 8960 9080 15383 2
Grl-16 38160 32220 37504 7
Grl-24 2560 2800 9856 5
Wrt-3 31150 31630 18738 8
Wrt-5 38120 38600 17844 8
4.5 Refolding
4.5.1 Air oxidation
Ni-NTA purified samples of Grd-13 and Wrt-3 were reduced with a 50 times molar excess of
DTT, for 30 min. The samples were desalted using a PD-10 column (GE healthcare) with
phosphate buffer and 0.5 ml fractions were collected. The fractions from the void volume with
high concentrations of protein and no DTT were pooled. Protein concentrations were determined
by UV-spectroscopy at 280 nm. Protein solutions(with a concentration of 3.3 mg/ml) were left to
oxidize in air and sampled by taking aliquots after 0h, 2h, 4h, 8h, 16h, 32h, 64h and 128h. The
samples were immediately quenched with H3PO4 (20µl to 40µl sample) to prevent further
oxidation or disulfide exchange. Reversed phase HPLC (RP-HPLC) was used to separate the
reduced proteins from the oxidized variants. An RP-18 column (Chromolith) with a gradient
from 5% acetonitrile to 95% acetonitrile during 90 minutes was used. Column effluent was
monitored at 214 and 280nm.
12Characterization of grd/grl/wrt domains from C. elegans
4.5.2 DTT redox buffer
First a test was performed to determine the kinetics of DTT in the air oxidation. Then, two
versions of this auto oxidation experiment were performed without the protein present. First a
stock solution was prepared. (50mM DTT, 8M urea, 100mM Tris and 2mM EDTA). In the first
experiment the stock solution was diluted 10 times with water, creating time point zero. 10 µ l
diluted samples were taken and quenched with 5 µl H3PO4 after various time intervals. In the
second experiment, a part of the stock solution was left to oxidize. When 10µl samples were
taken, they were diluted 10 times with water and left to equilibrate for 1h and then quenched with
50µl H3PO4.
Grd-13 refolding was initiated by using the second version of the experiment (where the aliquot
is diluted 10 times). All the samples were separated and analyzed by RP-HPLC. The gradient
started with an isocratic segment (15% buffer B) for 5 min and then a gradient from 32% to 40%
buffer B over 28 min.
4.5 CNBr cleavage at methionine residues:
A stock solution of 50 µM CNBr in 0.1M HCl was prepared with caution in the fume hood as
this compound is extremely toxic. Three samples were prepared, one negative control with 10 µ g
of protein in 0.1M HCl to test for non-specific cleavage by solvent and two samples with 10µg of
protein in 0.1M HCl and different concentrations of CNBr (5mM, 12mM). The protein was
added to the CNBr mixtures as a 0.065mM solution. Since the protein concentration and the
CNBr concentrations are known the molar ration for the CNBr added can be calculated. With
5mM concentration of CNBr there is an approximate 77 times molar excess of CNBr. With
12.5mM concentration of CNBr there is a molar excess of approximately 192 times. The samples
were incubated overnight (wrapped in aluminum foil to minimize light catalyzed free radical
reactions) and then frozen using a mixture of ethanol and dry ice. Samples were lyophilized,
resuspended in H2O and lyophilized again to remove all traces of the volatile acid and CNBr.
This was repeated at least 3 times. The samples were then suspended in water and aliquotes were
taken and prepared for SDS-PAGE gel. (5µ l sample, 5µl 4xSB, 6µl H2O). For each of the three
samples, a sample with 5mM DTT and a sample without DTT were prepared. Samples were
boiled at 95ºC for 10 min. The gel was run for 40 min, then stained with Coomassie Brilliant blue
for 2h and then destained with 10% acetic acid for 1h.
13Characterization of grd/grl/wrt domains from C. elegans
5 Results & Discussion
5.1 Expression
The cloned grd, grl, and wrt genes were expressed to see if the cloning was correct and that the
right protein was expressed. Grl-24 was the only protein was not express in any of the trials.
Based on SDS PAGE analysis, grd-5, grd-13, wrt-3 and wrt-5 were all expressed.
Fig 7 Test expression for wrt-3 (lanes 1-
Fig 6 Test expression of grd-13 (lanes 1-4), grl-24 (lanes 1) and wrt-5 (lanes 3-6). Odd numbered
5-8), and wrt-3 (lanes 9-10). Every odd numbered lane are lanes are uninduced, even numbered lanes
uninduced and every even numbered lane are induced with are induced with IPTG. All samples are
IPTG for 3 hrs. treated the same with the exception that
the even numbered lanes are treated with
IPTG.
The computer program UN-SCAN-IT (Silk Scientific, Inc.) was used to digitize the gel bands
and obtain a chromatogram-like representation for the differnet lanes (Fig. 8). From the graph of
the lanes containing protein standards, a calibration curve could be obtained (Fig. 9). A fourth-
order polynomeal equation was fitted to the scanned band positions as a function of migration
distance using the IGOR program. The resulting paramaterized equation was used to calculate
the molecular weights for the expressed proteins.
L
o
g
M
W
mm mm
Fig 8 Chromatogram of the protein
ladder, values from UNSCANIT Fig 9 Curve fitting to the values
from the protein ladder.
14Characterization of grd/grl/wrt domains from C. elegans
MW calculated
MW calculated
Protein actual values
UNSCANIT (Da)
(Da)
Table 3 shows the
Grd-13 22021 15383 molecular weights
Wrt-3 23341 18738 calculated from
UNSCANIT values.
Wrt-5 8mM)22475 17844 (mean value from the two
double samples)
Grd-5 13163 9119
Table 3 shows the calculated values from UNSCANIT and the actual calculated values. The
values from UNSCANIT were some kDa bigger than real values. It could be that the proteins
have a conformation or charge distribution that makes them act bigger than they are on SDS
PAGE.
5.2 Purification
A Ni-NTA column was used to purify the proteins by following protocol. The Ni-NTA column
was first run on ÄKTA with buffers containing 8M urea to keep the proteins, expressed as
aqueous insolubile inclusion bodies in solution. The fractions containing the protein were pooled
and bound to a freshly equilibrated Ni-NTA column again. This time buffers without urea were
used. Between these steps some of the protein was lost (Table 4). Several samples of grd-13 from
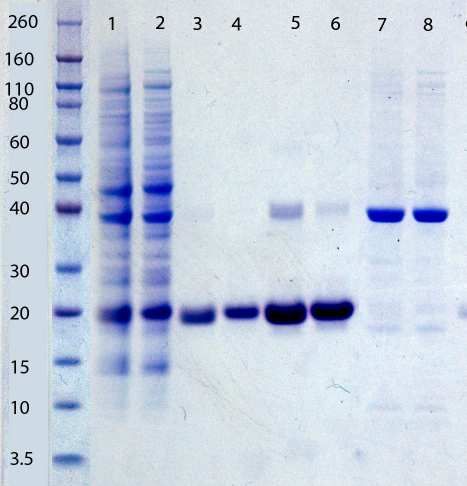
different stages of purification (See Fig. 12) were loaded on a SDS gel to see the purity. The
pooled protein fractions, now in buffer without urea, were concentrated and the imidazole
concentration decreased by ultrafiltration. After this step, the protein concentration was measured
by UV at 280nm.
Grd-13 and wrt-3 partially precipitated while stored in the freezer, so they had to be centrifuged
to remove the precipitated proteins and the concentration remeasured. We were able to obtain the
concentrations grd-13 (248 µM), wrt-3 (196 µM), wrt-5 (138 µM). Then they were stored at 4 C.
Fig 10 Representative
chromatogram (grd-13) from Ni-
NTA purification in the first cycle
under denaturing conditions.
15Characterization of grd/grl/wrt domains from C. elegans
Fig 11 Chromatogram
from Ni-NTA
purification(grd-13). The
second cycle under native
condition.
Fig 12 SDS PAGE of the Purification Process
Samples after different stages of purification of Grd-
13. Even numbered lanes are treated with DTT (to
break any disulfide bonds), odd numbered lanes are
not. Lanes 1,2 are flow through from the Ni-NTA
column (cycle 1). Lanes 3,4 are from the small peak
of of purification in Ni-NTA. Lanes 5,6 are from the
large peak. Lanes 7,8 are from the pellet before
dissolved and put on Ni-NTA column.
After first After second Ni-NTA
Protein
Ni-NTA (mg) (mg)
Table 4 Final concentrations
after purification. The amount
of protein after each step ofthe Grd-13 62 43
Ni-NTA purification Wrt-3 71 43
Wrt-5 97 25
Fig 12 shows that the samples were > 95% pure after the final purification step. This is shown by
the single bands in lanes 3-6. The amount of protein obtained after each step of the purification
process is shown in table 4. Note the considerable loss between the first and second step of the
purification.
16Characterization of grd/grl/wrt domains from C. elegans
5.3 Circular Dichroism Spectroscopy
CD spectra were taken of the purified wrt-3, wrt-5 and grd-13 proteins to determine if the
proteins hade the predicted fold or if they were unfolded, and in need of refolding. The CD
spectra shown in Figs. 18-20 are CD spectra to show the result of the refolding experiments.
Fig 18 CD spectrum wrt-5,
blue line refolded sample, red
line reduced sample.
Fig 19 CD spectrum
wrt-3, blue line refolded
sample, red line reduced
sample.
Fig 20 CD spectrum
Wrt-5, blue line refolded
sample, red line reduced
sample.
17Characterization of grd/grl/wrt domains from C. elegans
Fore each protein, one sample was reduced with 6M urea and one sample with 50mM DTT. The
6M urea and 50mMDTT samples showed the same results. The reduced samples were compared
with untreated protein samples. All the different proteins show a difference between the
untreated and the treated samples. The delta epsilon value starts decreasing at a higher
wavelength for the reduced (hopefully unfolded) samples than for the untreated samples
(hopefully folded). This indicates that there is some folding present in the intreated samples. If
the samples contained only correctly folded protein the delta epsilon should start decreasing at a
higher wavelength (19). The results show a mix between correctly and uncorrectly folded
proteins. This can be an indication that 6M urea or 50mM DTT may not be enough to fully
reduce the protein samples. Due to some problems with the CD instrument, together with the
high buffer background, values at wave lengths lower than 210 nm could not be obtained. It is in
that region that the difference between unfolded and folded is showing the most.
5.4 Refolding
Since the CD spectra showed that the proteins were not in a homogenous, correctly folded state,
some refolding experiments were made to try to get them correctly folded.
5.4.1 Air oxidation
Aliquotes from the refolding experiments were analyzed by reversed phase HPLC which can
distinguish different disulfide bonded pairings and will be used to check for sample homogeneity
(from this perspective). The chromatograms (Figs. 14 and 15) showed that something happened
to the protein during the oxidation. But it did not shift in retention time when compared to fully
oxidized Grd-13 and Wrt-3. Since the peak is also growing broader and not higher, this indicates
that it is not likely a homogenous product after oxidation. It seams to be a mixture of many types
of misfolded proteins – perhaps oligomers.
Fig 14 Chromatograms for the
air oxidation experiment with
Grd-13. Arrow indicates retention
time for fully reduced Grd-13.
18Characterization of grd/grl/wrt domains from C. elegans
Fig 15 Chromatograms for the
air oxidation experiment with
Wrt-3. Arrow indicates retention
time for fully reduced wrt-3.
5.4.2 DTT redox buffers
Taking advantage of the ability of thiols to air air oxidatize, an oxidation scheme was devised in
which a starting concentration of reduced DTT would be allowed to oxidize in air thus creating a
constantly changing redox buffer. Proteins in this buffer would then have a chance to equilibrate
at these redox potentials. Since the redox potential of samples containing DTT changes over
time, some calculations on DTT had to be made to get the redox potentials for the various
samples. DTTox has a known extinction coefficient at 290nm. Therefore the measurements on
DTT were made at that wavelength (se fig 16). The peaks for DTTox were integrated as a
function of oxidation time. A plot of the amount of DTTox as a function of oxidation time is
clearly a first-order reaction as evidenced by the fit of the experimental data points to a first-order
equation (Eq. 7), by non-linear regression.
DTTox = DTTt =0 +DTTt =∞ × (1- e(-k*t) ) Eq 7
The parameters obtained for the fit shown in Fig. 16B are DTTt=0 = 1.40 x 10⁻⁹ ± 1.74 x 10⁻⁹ mol.,
DTTt=∞ = 3.33 x 10⁻⁸ ± 1.81 x 10⁻⁹ mol., and k = 8.88 x 10⁻⁴ ± 1.47 x 10⁻⁴ mol. sec-1. By knowing
the amount of DTTox the ratio between DTTox and DTT is known and the redox potentials
could be calculated. (table 5)
19Characterization of grd/grl/wrt domains from C. elegans
Fig 16A A superposition of the elution profile (290 nm)
containing the DTTox peak at different time points with the
shortest time at the bottom. Curves have a vertical and
horizontal offset to better see the peaks. Each chromatogram
represent the same sample after different times as stated in fig
14.
16B Plot of the integrated DTTox peaks in A as a function of
time. The solid line represents the best-fit to the first-order
equation (Eq. 6). The calculated rate constant is 8.88 x 10⁻⁴ ±
1.47 x 10⁻⁴ mol. sec-1
Table 5 Redox potentials
as a function of time for
the different samples.
Fig 17 Grd-13 at 214nm. Treated
with the DTT buffer.
Redox
Time (h)
potential (mV)
8 -361
16 -336
32 -328
48 -308
70 -261
20Characterization of grd/grl/wrt domains from C. elegans
RP-HPLC chromatograms of aliquots from the Grd-13 refolding experiment indicate that the
protein is changing over time as evidenced by shifting peak positions. The sample that was
shifted the most was the sample after 16h, with the redox potential of -336mV. Since the samples
are oxidized in a high concentration of urea, the disulfide bonds may not stay native
(intramolecular) since the protein will not fold and stabilize the bond. This is the reason why the
peak is shifting even after the protein has been in the right redox buffer. From these results a
redox buffer of -336mV (Table 5) would seem to be the most effective at achieving
intramolecular oxidation.
5.5 CNBr analysis of Grd-13
Cyanogen bromide is one of the few chemical methods for cleaving peptide chains (after
methionine) that is specific enough to be useful in most cases. Used with care, it can be used to
demonstrate the presence of a disulfide bond (providing there is at least one methionine between
the suspected cystine pair). The most common solvent for cleavage is 70% formic acid which
fulfills the low pH requirement of the reaction and is an excellent solvent for eventual peptide
fragments (20-22). 70% formic acid is very reducing so it may also reduce the disulfide bond
(20). A side reaction that will often occur with 70% formic acid is formylation of the peptide,
thereby increasing it’s mass and modifying nucleophilic amino acid side chains. To avoid this
HCl can be used (22). 70% formic acid and other solutions like guanidine hydrochloride are good
solvents except when serine or threonine follow the methionine. Instead of cleaving the
polypeptide, a side reaction occurs that keeps it intact. CH3CN/HCl in different ratios has been
shown to decrease the side reactions.
Serendipitously, grd-13 is an excellent protein to perform this experiment on. It has a single
methionine halfway between the two cysteine residues suspected to form the disulfide bond.
When the CNBr cleaves the protein and then run on a SDS-PAGE gel, two different results can
occur, depending on the state of the the two cysteine residues. First if there is a disulfide bond
present a band will show with the same size as the whole protein. On the other hand if there is no
disulfide bond present two smaller bands will show.
M
I M II
S-S
SH HS
Fig 5 CNBr cleavage Shows how the two
peptide fragments are held together after
cleavage when a disulfide bond (yellow line)
is present. II shows how the two peptide
fragments are separated after cleavage when
HS there is no disulfide bond.
S-S SH
21Characterization of grd/grl/wrt domains from C. elegans
The negative controls (without CNBr), both with and without DTT both showed a band with the
molecular weight of approximately 21kDa (Fig. 13) Samples that had been treated with CNBr
and then reduced with DTT showed a band at approximately 6kDa, approximately the size of the
expected fragments N- and C-terminal to the single methionine (7.5kDa and 7.8kDa,
respectively), indicating that at least some of the sample was cleaved. The CNBr treated sample
without DTT showed a single band at 17kDa, approximately the size of the sum to the two
fragments and approximately the actual size of the whole protein (15 kDa). Comparing the lanes
containing the CNBr-cleaved material, with and without DTT indicates that there is a significant
population of molecules containing a disulfide bond. If not, the CNBr treated sample without
DTT should show the same band as the CNBr treated sample with DTT. The band in the negative
control is somewhat larger than the band in the CNBr treated sample. One possible explanation is
that the intact Grd-13 protein, due to its conformation, migrates at an apparent molecular weight
larger than the expected value. When cleaved at the single methionine, this conformation is lost
and the protein migrates closer to the expected value. While the SDS-containing sample buffer is
expected to denature proteins allowing a uniform density of bound detergent, this may not be the
case and could explain the abnormal migration.
What this experiment does not show is whether the disulfide bond is intramolecular or
intermolecular since both cases would give rise to the same molecular weights. The absence of
strong, unique bands at higher molecular weights makes this scenario less attractive.
Fig 13 CNBr experiment. Even
numbered lanes are treated with
DTT, odd numbered are not. Lanes
1,2 negative control with only the
HCl solvent. Lanes 3,4 treated with
5mM CNBr. Lanes 5,6 treated with
12,5mM CNBr.
22Characterization of grd/grl/wrt domains from C. elegans
6 Conclusions and future perspectives
All the proteins were successfully cloned into the pET-vectors as determined by sequencing. The
test expressions were successful for all proteins except grl-24 which showed no detectable
expression. Grd-5 was never used past this stage. Grd-13, wrt-3 and wrt-5 were all expressed in
full scale and purified. CD spectra were taken for all the proteins but none of the proteins showed
large amounts of secondary structures. Different techniques for refolding were attempted but
none showed positive indications that it would be correctly folded. For grd-13, the DTT redox
buffer refolding showed that -336mV could be a good redox potential of a DTT buffer if
refolding is attempted again. The presence of a disulfide bond in grd-13 was shown by the
cyanogen bromide experiment.
Ultimately, the goal is to find out how these proteins function in the signaling system of C.
elegans. This project has contributed by cloning, expressing and purifying the proteins and
starting to characterize the structure of the proteins. In the future for grl-24, different temperature
and times of inducing can be applied to get it to express, then purification should not be a
problem. Grd-5 should be expressed in a larger scale and then purified. The same technique that
was used to get the approximate redox potential ford grd-13 could be used for the other proteins,
then attempts to refold the grd-13 (-336mV) and the other proteins in that calculated redox buffer
can be performed. The next step is to find a better way to detect the disulfide bonds and if the
proteins are correctly folded and how they are folded. It is a matter of trial and error until we find
one of the many available techniques that is good these proteins. Mass spectrometry one of these
methods that definitely should be tested to determine the sequence of the protein.
23Characterization of grd/grl/wrt domains from C. elegans
7 References
1. Javitt, N. B. (2008) Steroids 73, 149-157
2. Burglin, T. R., and Kuwabara, P. E. (2006) WormBook, 1-14
3. Gilbert, H. F. (1995) Methods Enzymol 251, 8-28
4. Burglin, T. R. (1996) Curr Biol 6, 1047-1050
5. Aspock, G., Kagoshima, H., Niklaus, G., and Burglin, T. R. (1999) Genome Res 9, 909-
923
6. Anfinsen, C. B. (1973) Science 181, 223-230
7. Gilbert, H. F. (1997) J Biol Chem 272, 29399-29402
8. Woycechowsky, K. J., and Raines, R. T. (2000) Curr Opin Chem Biol 4, 533-539
9. Anfinsen, C. B., and Haber, E. (1961) J Biol Chem 236, 1361-1363
10. Pace, C. N., Grimsley, G. R., Thomson, J. A., and Barnett, B. J. (1988) J Biol Chem 263,
11820-11825
11. Aslund, F., Berndt, K. D., and Holmgren, A. (1997) J Biol Chem 272, 30780-30786
12. Inaba, K., and Ito, K. (2002) Embo J 21, 2646-2654
13. Zumdahl, S. S. Z. S. S. (2003) Chemistry, 6 Ed., Houghton Mifflin
14. Novy, E. R. InNovations 5
15. Wormbase. (www.wormbase.org)
16. Uppsala.Genome.Center. (Dept. of Genetics and Pathology Rudbeck Laboratory Dag
Hammarskjölds väg 20 SE-751 85 Uppsala Sweden)
17. Putnam, C. (2006) http://www.scripps.edu/~cdputnam/protcalc.html march 28, 2006
18. Gill, S. C., and von Hippel, P. H. (1989) Anal Biochem 182, 319-326
19. Sheehan, D. (2000) Physical Biochemistry: Principles and Applications, John Wiley &
Sons Ltd.
20. Villa, S., De Fazio, G., and Canosi, U. (1989) Anal Biochem 177, 161-164
21. Inglis, A. S., and Edman, P. (1970) Anal Biochem 37, 73-80
22. Kaiser, R., and Metzka, L. (1999) Anal Biochem 266, 1-8
24You can also read