Household COVID-19 risk and in-person schooling - Science
←
→
Page content transcription
If your browser does not render page correctly, please read the page content below
REPORTS

                                                                                                                                  Cite as: J. Lessler et al., Science
                                                                                                                                 10.1126/science.abh2939 (2021).

Household COVID-19 risk and in-person schooling
Justin Lessler1*, M. Kate Grabowski1,2, Kyra H. Grantz1, Elena Badillo-Goicoechea3, C. Jessica E. Metcalf4, Carly
Lupton-Smith5, Andrew S. Azman1,6, Elizabeth A. Stuart3,5,7
1Department of Epidemiology, Johns Hopkins Bloomberg School of Public Health, Baltimore, MD, USA. 2Department of Pathology, Johns Hopkins School of Medicine,
Baltimore, MD, USA. 3Department of Mental Health, Johns Hopkins Bloomberg School of Public Health, Baltimore, MD, USA. 4Department of Ecology & Evolutionary Biology,
Princeton University, Princeton, NJ, USA. 5Department of Biostatistics, Johns Hopkins Bloomberg School of Public Health, Baltimore, MD, USA. 6Institute of Global Health,
Faculty of Medicine, University of Geneva, Geneva, Switzerland. 7Department of Health Policy and Management, Johns Hopkins Bloomberg School of Public Health,
Baltimore, MD, USA.
*Corresponding author. Email: justin@jhu.edu

In-person schooling has proved contentious and difficult to study throughout the SARS-CoV-2 pandemic.
Data from a massive online survey in the United States indicates an increased risk of COVID-19-related
outcomes among respondents living with a child attending school in-person. School-based mitigation
measures are associated with significant reductions in risk, particularly daily symptoms screens, teacher

                                                                                                                                                                            Downloaded from http://science.sciencemag.org/ on May 15, 2021
masking, and closure of extra-curricular activities. A positive association between in-person schooling and
COVID-19 outcomes persists at low levels of mitigation, but when seven or more mitigation measures are
reported, a significant relationship is no longer observed. Among teachers, working outside the home was
associated with an increase in COVID-19-related outcomes, but this association is similar to other
occupations (e.g., healthcare, office work). While in-person schooling is associated with household COVID-
19 risk, this risk can likely be controlled with properly implemented school-based mitigation measures.

The role of schools in transmission, and the value of school                           infection when exposed (10), though it is unclear if they are
closure, has been one of the most contentious issues of the                            less likely to pass on the virus once infected (11, 12), or if this
COVID-19 pandemic. There is ongoing debate about exactly                               reduced susceptibility is offset by increases in number of con-
how much SARS-CoV-2 risk is posed to individuals and com-                              tacts during school (13). Even when school-aged children are
munities by in-person schooling. While there is general con-                           infected, their risk of severe disease and death is low (14).
sensus that it should be possible to open schools safely with                          This means that one of the main reasons for a focus on
adequate mitigation measures, there is little data and even                            schools is not the risk to students, but the risk that in-person
less agreement as to what level of mitigation is needed.                               schooling poses to teachers and family members (15), and its
    Many ecological studies have shown an association be-                              impact on the overall epidemic. Yet, few studies have focused
tween in-person schooling and the speed and extent of com-                             on the risk in-person school poses to household members
munity SARS-CoV-2 transmission (1–3), though these results                             (15).
have not been uniform (4). While there have been numerous                                  Different interpretations of the evidence and local politics
outbreaks in schools and school-like settings (5–7), studies                           have led to massive heterogeneity in approaches to schooling
outside of outbreak settings have suggested that, when miti-                           across the United States during the 2020-21 school year (16),
gation measures are in place, transmission within schools is                           running the gambit from complete cessation of in-person
limited and infection rates mirror that of the surrounding                             learning to opening completely with no mitigation measures.
community (8, 9).                                                                      Most schools that have opened have made some efforts to
    However, the ways in which in-person schooling influ-                              mitigate transmission, but there is much diversity in the ap-
ences community SARS-CoV-2 incidence are complex.                                      proaches adopted.
Schools play a unique role in the social fabric of the United                              This hodgepodge of approaches to schooling creates a nat-
States and other countries, and often create potential trans-                          ural experiment from which we can learn about what does,
mission connections between otherwise disparate communi-                               and does not, work for controlling school-associated SARS-
ties. Even if transmission in classrooms is rare, activities                           CoV-2 spread. However, there is no central repository of the
surrounding in-person schooling, such as student pick-up                               measures implemented across the over 130,000 schools in the
and drop-off, teacher interactions, and broader changes to                             United States, or health outcomes in these schools. Where
behavior when school is in session could lead to increases in                          data are available, they are often restricted to traditional pub-
community transmission.                                                                lic-school systems, though 28% of Pre-K through 12th grade
    There is also a growing body of evidence that younger                              students are in private or charter schools, and rarely can data
children (e.g., those under 10 years) are less susceptible to                          be linked with individual- or household-level outcomes.

First release: 29 April 2021                                            www.sciencemag.org                (Page numbers not final at time of first release) 1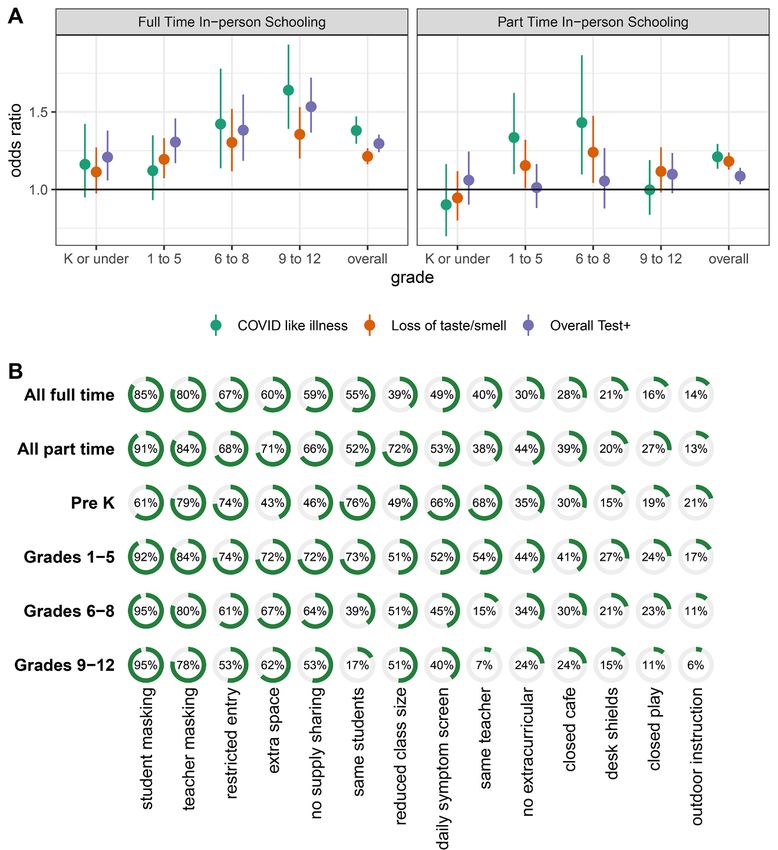
The COVID-19 Symptom Survey provides a unique oppor-           CLI (aOR 1.21, 95% CI 1.13-1.29), loss of taste or smell (aOR
tunity to collect and analyze data on schooling behaviors and      1.18, 95% CI 1.13-1.24) and reporting a positive test (aOR 1.09,
SARS-CoV-2 related outcomes from households throughout             95% CI, 1.03-1.14). Among those reporting part-time school-
the United States. This survey is administered through Face-       ing, the association between grade and COVID-19-related out-
book in partnership with Carnegie Mellon University and            comes is less clear (Fig. 2A and table S4).
yields approximately 500,000 survey responses in the United            Respondents were asked to select all mitigation measures
States weekly (17). It includes questions on symptoms related      in place for any household child engaged in in-person school-
to COVID-19, testing and, since late November 2020, the            ing from a list of 14 measures (see materials and methods for
schooling experience of any children in the household [sur-        wording). For students engaged in any form of in-person
vey details and questionnaires are available at (18)]. Analysis    learning, the most common mitigation measure reported was
weights adjust for non-response and coverage bias (see mate-       student mask mandates (88%, unweighted), followed by
rials and methods).                                                teacher mask mandates (80%), restricted entry (e.g., no par-
    We analyzed data collected over two time periods during        ents or caregivers allowed into school) (66%) and extra space
the 2020-2021 school year (Nov. 24, 2020-Dec. 23, 2020 and         between desks (63%) (see table S5 for survey weighted rates).
Jan. 11 2021-Feb. 10, 2021). Of 2,142,887 total respondents in     The distribution of mitigation measures reported was similar

                                                                                                                                        Downloaded from http://science.sciencemag.org/ on May 15, 2021
the 50 US states and Washington DC during this period,             between those reporting full- and part-time in-person school-
576,051 (26.9%) reported at least one child in Pre-K through       ing, though most measures were slightly more likely to be re-
high school living in their household (tables S1 and S2, Fig.      ported in the part-time setting (Fig. 2B). Besides staying with
1A, and fig. S1). While larger states have more responses, the     the same teacher and staying with the same students
per-capita response rate was fairly consistent across states       throughout the day, we found minimal evidence of clustering
(20 per 100,000, range 10-29 per 100,000) and slightly higher      of mitigation measures in principal components (table S6) or
in smaller states (fig. S2). Forty-nine percent                    hierarchical clustering analyses (fig. S6). Student mask man-
(284,789/576,051) of these respondents reported a child living     dates were the only intervention reported alone.
in the household engaged in either full- (68.8%) or part-time          Overall, respondents reporting a household child engaged
(46.0%) in-person schooling, with substantial variation both       in in-person school reported a mean of 6.7 (IQR 4-9) mitiga-
within and between states (Fig. 1 and table S3). Overall, in-      tion measures in place at any school attended. Those report-
person schooling increased between the two periods from            ing only children in part-time schooling reported more
48% to 52%, though decreases were observed in some states          mitigation measures (mean 7.0, IQR 5-10) than those report-
(e.g., Arizona) (fig. S1 and table S3). Previous work has shown    ing only children in full-time schooling (mean 6.4, IQR 4-9).
that household-reported rates of in-person schooling col-          There is substantial geographic heterogeneity in the number
lected through the COVID-19 Symptom Survey track well              of mitigation measures reported (Fig. 1D, fig. S7, and tables
with administrative data (19).                                     S5 and S7), with households in South Dakota reporting the
    After adjusting for county-level incidence and other indi-     least (mean 4.6, IQR 2-7), and households in Vermont report-
vidual- and county-level factors (but not school-based mitiga-     ing the most (mean 8.9, IQR 8-11).
tion measures; tables S1 and S2 and fig. S3), living in a              We find a dose-response relationship with the number of
household with a child engaged in full-time in-person school-      mitigation measures implemented and the risk of COVID-19
ing is associated with a substantial increase in the odds [ad-     outcomes among adult household members responding to
justed odds ratio (aOR) 1.38, 95% CI 1.30-1.47] of reporting       the survey after adjustment for individual- and county-level
COVID-19 like illness (CLI, fever of at least 100°F, along with    factors. On average, each measure implemented is associated
cough, shortness of breath, or difficulty breathing), loss of      with a 9% decrease in the odds of CLI (aOR 0.91, 95% CI 0.89-
taste or smell (aOR 1.21, 95% CI 1.16-1.27), or a positive SARS-   0.92), an 8% decrease in the odds of loss of taste or smell (aOR
CoV-2 test result within the previous 14 days (aOR 1.30, 95%       0.92, 95% CI 0.91-0.93) and a 7% decrease in the odds of a
CI 1.24-1.35) (Fig. 2A and table S4). Rates of reported COVID-     recent positive SARS-CoV-2 test (aOR 0.93, 95% CI 0.92-0.94)
19 outcomes were positively correlated with county-level con-      (table S8). Regression treating each individual mitigation
firmed SARS-CoV-2 incidence (figs. S4 and S5). When strati-        measure as having an independent effect shows that daily
fying by grade level (restricted to households reporting           symptom screening is clearly associated with greater risk re-
children in a single grade strata), we find that the strength of   ductions than the average measure (Fig. 3 and table S9), with
the associations with full-time schooling increases with grade     some evidence that teacher mask mandates and cancelling
(Fig. 2A and table S4).                                            extra-curricular activities are also associated with larger re-
    The association between COVID-19 outcomes and report-          ductions than average. In contrast, closing cafeterias, play-
ing a child in the household engaged in part-time in-person        grounds and use of desk shields are associated with lower risk
schooling is attenuated but still statistically significant for    reductions (or even risk increases); however this may reflect

First release: 29 April 2021                           www.sciencemag.org       (Page numbers not final at time of first release)   2
saturation effects as these are typically reported along with a    status, or incidence, we found few systematic or statistically
high number of other measures. Notably, part-time in-person        significant deviations from overall estimates, even if overall
schooling is not associated with a decrease in the risk of         rates of outcomes differed (i.e., little evidence of effect modi-
COVID-19-related outcomes compared to full-time in-person          fication by strata). We find similar results when stratifying
schooling after accounting for other mitigation measures. De-      counties by reported schooling behaviors, state, percent
spite this heterogeneity in impact, we find that models in-        white, poverty and access to broadband internet (figs. S11 to
cluding only the number of mitigation measures well                S14 and table S12). The notable exception is an apparent in-
approximate those where measures are modeled individually          crease in the risk associated with in-person schooling in
(fig. S8).                                                         households with a higher propensity to have children attend-
    To explore what, if any, levels of mitigation are associated   ing in-person classes (Fig. 5C).
with elimination of the risk posed by in-person schooling, we          While we were not able to specifically examine the rela-
conducted analyses where the in-person exposure groups             tionship between in-person schooling, mitigation measures
were specific to whether 0, 1-3, 4-6, 7-9 or 10 or more mitiga-    and risk to teachers, we were able to assess the risk associated
tion measures were reported (Fig. 4, fig. S9, and tables S10       with reporting paid work outside the home among pre-K
and S11). We found that when 7 or more mitigation measures         through high school teachers. Teachers working outside the

                                                                                                                                        Downloaded from http://science.sciencemag.org/ on May 15, 2021
were in place the positive association between in-person           home were more likely to report COVID-19-related outcomes
schooling and COVID-19 outcomes disappeared. This result           than those working at home (e.g., Test positive aOR 1.8, 95%
was robust to adjustment for the expected number of inter-         CI 1.5-2.2; fig. S15 and table S13). The confidence interval
ventions (i.e., generalized propensity scores) based on geo-       summarizing the elevation of risk overlapped with corre-
graphic or individual level covariates, but was less clear when    sponding intervals associated with working in healthcare
propensity scores were based on both (fig. S10). Among those       (aOR 1.7, 95% CI 1.5-1.9) and office work (aOR 1.6, 95% CI 1.5-
reporting 7 or more mitigation measures, over 80% reported         1.7).
student and teacher mask mandates, restricted entry, extra             The results presented here provide evidence that in-per-
space between desks and no supply sharing, and over 50%            son schooling poses a risk to those living in the households
reported student cohorting, reduced class size and daily           of students, but that this risk can be managed through com-
symptom screening.                                                 monly implemented school-based mitigation measures. This
    The results presented here show a clear association be-        is consistent with findings from Sweden, where authors
tween in-person schooling and the risk of COVID-19-related         found risk to parents and teachers using a quasi-experi-
outcomes in adult household members, and that this associ-         mental approach (15). However, much remains unknown. We
ation disappears when more than seven school-based mitiga-         were unable to measure the risk posed by in-person schooling
tion measures are reported. However, this association may          to the students themselves, nor were we able to specifically
not be causal, particularly given that in-person schooling and     assess how different policies impact teachers and other
mitigation measures are not distributed randomly in the pop-       school staff. While the interplay between school policies and
ulation (Fig. 1 and tables S1 to S3, S5, S7, S10, and S11). For    local incidence is complex and, possibly, multi-directional, we
instance, households with a student attending in-person            find substantial variation in SARS-CoV-2 incidence regard-
school tend to be in counties that are a higher percentage         less of the mean number of mitigation measures imple-
white (fig. S2), and contain respondents who are more likely       mented within counties (figs. S8 and S15) and observed
to have recently eaten out or gone to a bar (table S2). Despite    associations persist across study periods (figs. S17 to S19).
our best efforts to adjust for local incidence, individual be-     This study also provides limited insight into the mechanisms
havior and other potential confounders, it is possible that un-    by which in-person schooling increases risk, and it remains
measured factors drive the observed associations; and some         possible that classroom transmission plays a minor role, and
sub-analyses raise the possibility that complex interactions       other school-related activities drive risk.
between geography and individual factors (but neither alone)           This study has limitations. Measures of association be-
may explain some of the observed results (fig. S10), though        tween COVID-19 outcomes and key exposures may be biased
over-adjustment is a concern in these models.                      if confounding factors were not fully accounted for. Though
    To address the possibility that the association with in-per-   we adjust for several county-level measures of socioeconomic
son schooling could be the result of differences between ur-       status, these data were not available at the individual level
ban, suburban and rural counties, local patterns of incidence,     and are known to be associated with COVID-19 risk and atti-
or other differences between those more and less likely to         tudes about in-person schooling. Analyses stratified on ur-
send children to school in-person we performed several strat-      banization, background COVID-19 risk, and propensity for in-
ified analyses (Fig. 5). When stratifying by propensity for in-    person schooling (table S5) did not reveal substantial sensi-
person schooling and counties classified by size and metro         tivity to the levels of factors investigated, nor did examining

First release: 29 April 2021                           www.sciencemag.org       (Page numbers not final at time of first release)   3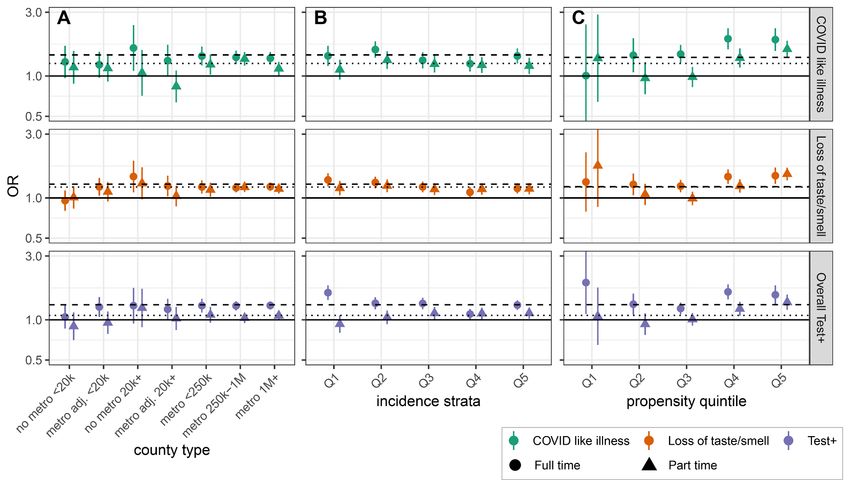
alternative measures of individual and household COVID-19                                       Whittaker, H. Zhu, T. Berah, J. W. Eaton, M. Monod, Imperial College COVID-19
occurrence (figs. S20 to S22), alleviating some of these con-                                   Response Team, A. C. Ghani, C. A. Donnelly, S. Riley, M. A. C. Vollmer, N. M.
                                                                                                Ferguson, L. C. Okell, S. Bhatt, Estimating the effects of non-pharmaceutical
cerns. Still, more formal studies that span schools with mul-                                   interventions on COVID-19 in Europe. Nature 584, 257–261 (2020).
tiple policies and approaches would enhance insights into                                       doi:10.1038/s41586-020-2405-7 Medline
these questions.                                                                           3. B. Yang, A. T. Huang, B. Garcia-Carreras, W. E. Hart, A. Staid, M. D. T. Hitchings, E.
    Additionally, cross-sectional internet-based surveys have                                   C. Lee, C. J. Howe, K. H. Grantz, A. Wesolowksi, J. C. Lemaitre, S. Rattigan, C.
                                                                                                Moreno, B. Borgert, C. Dale, N. Quigley, A. Cummings, A. McLorg, K. LoMonaco, S.
limitations and are subject to response biases. Although re-                                    Schlossberg, D. Barron-Kraus, H. Shrock, UFCOVID Interventions Team, J.
sults are qualitatively consistent across COVID-19 outcomes                                     Lessler, C. D. Laird, D. A. T. Cummings, Effect of specific non-pharmaceutical
[symptoms-based, test-based, and among those tested (figs.                                      intervention policies on SARS-CoV-2 transmission in the counties of the United
S20 to S22)], self-report has numerous limitations, for in-                                     States. medRxiv 2020.10.29.20221036 [Preprint]. 3 November 2020.
                                                                                                https://doi.org/10.1101/2020.10.29.20221036.
stance, we cannot robustly assess asymptomatic spread. We                                  4. D. N. Harris, E. Ziedan, S. Hassig, The Effects of School Reopenings on COVID-19
were also unable to evaluate compliance with or investment                                      Hospitalizations [National Center for Research on Education Access and Choice
in reported mitigation measures, and there is potential for                                     (REACH), 2021]; www.reachcentered.org/publications/the-effects-of-school-
mitigation measures to be reported inaccurately on the sur-                                     reopenings-on-covid-19-hospitalizations.
                                                                                           5. C. Stein-Zamir, N. Abramson, H. Shoob, E. Libal, M. Bitan, T. Cardash, R. Cayam, I.
vey. Survey respondents may not be representative of the full                                   Miskin, A large COVID-19 outbreak in a high school 10 days after schools’

                                                                                                                                                                                           Downloaded from http://science.sciencemag.org/ on May 15, 2021
U.S. population, and while survey weights help account for                                      reopening, Israel, May 2020. Euro Surveill. 25, 2001352 (2020).
non-response and coverage biases, weights calculated based                                      doi:10.2807/1560-7917.ES.2020.25.29.2001352 Medline
on the Facebook user base were adjusted for representative-                                6. A. S. Lopez, M. Hill, J. Antezano, D. Vilven, T. Rutner, L. Bogdanow, C. Claflin, I. T.
                                                                                                Kracalik, V. L. Fields, A. Dunn, J. E. Tate, H. L. Kirking, T. Kiphibane, I. Risk, C. H.
ness of the wider population based only on age and gender,                                      Tran, Transmission Dynamics of COVID-19 Outbreaks Associated with Child Care
hence may not ensure representativeness across all covari-                                      Facilities - Salt Lake City, Utah, April-July 2020. MMWR Morb. Mortal. Wkly. Rep.
ates. However, the sample size of the survey and consistency                                    69, 1319–1323 (2020). doi:10.15585/mmwr.mm6937e3 Medline
of our findings across sub-analyses allay some of these con-                               7. C. M. Szablewski, K. T. Chang, M. M. Brown, V. T. Chu, A. R. Yousaf, N. Anyalechi, P.
                                                                                                A. Aryee, H. L. Kirking, M. Lumsden, E. Mayweather, C. J. McDaniel, R. Montierth,
cerns, as does assessment of non-COVID outcomes (figs. S23                                      A. Mohammed, N. G. Schwartz, J. A. Shah, J. E. Tate, E. Dirlikov, C. Drenzek, T. M.
and S24). Further, any response biases would have to be dif-                                    Lanzieri, R. J. Stewart, SARS-CoV-2 Transmission and Infection Among Attendees
ferential based on schooling status to bias our results away                                    of an Overnight Camp - Georgia, June 2020. MMWR Morb. Mortal. Wkly. Rep. 69,
from the null.                                                                                  1023–1025 (2020). doi:10.15585/mmwr.mm6931e1 Medline
                                                                                           8. S. A. Ismail, V. Saliba, J. Lopez Bernal, M. E. Ramsay, S. N. Ladhani, SARS-CoV-2
    The debate around in-person schooling in the United                                         infection and transmission in educational settings: A prospective, cross-sectional
States has been intense, and has exacerbated differences in                                     analysis of infection clusters and outbreaks in England. Lancet Infect. Dis. 21,
approach between independent school systems and individ-                                        344–353 (2021). doi:10.1016/S1473-3099(20)30882-3 Medline
ual families nationally. This lack of coordination has pro-                                9. A. Falk, A. Benda, P. Falk, S. Steffen, Z. Wallace, T. B. Høeg, COVID-19 Cases and
                                                                                                Transmission in 17 K-12 Schools - Wood County, Wisconsin, August 31-November
vided an opportunity to learn about the risks of in-person                                      29, 2020. MMWR Morb. Mortal. Wkly. Rep. 70, 136–140 (2021).
schooling, and the degree to which mitigation measures may                                      doi:10.15585/mmwr.mm7004e3 Medline
reduce risk. The results presented here provide one dimen-                                 10. R. M. Viner, O. T. Mytton, C. Bonell, G. J. Melendez-Torres, J. Ward, L. Hudson, C.
sion of evidence for decision makers to consider in the con-                                    Waddington, J. Thomas, S. Russell, F. van der Klis, A. Koirala, S. Ladhani, J.
                                                                                                Panovska-Griffiths, N. G. Davies, R. Booy, R. M. Eggo, Susceptibility to SARS-CoV-
text of a complex policy landscape with many competing risks                                    2 Infection Among Children and Adolescents Compared With Adults: A Systematic
and priorities. While online surveys have their unique limita-                                  Review and Meta-analysis. JAMA Pediatr. 175, 143–156 (2021).
tions, the wide reach of the COVID-19 Symptom Survey has                                        doi:10.1001/jamapediatrics.2020.4573 Medline
                                                                                           11. S. Flasche, W. J. Edmunds, The role of schools and school-aged children in SARS-
allowed us to gather data from households engaged in heter-
                                                                                                CoV-2 transmission. Lancet Infect. Dis. 21, 298–299 (2021). doi:10.1016/S1473-
ogeneous schooling activities throughout the country in a                                       3099(20)30927-0 Medline
way few other studies could. In analyzing these data, we find                              12. Q. Bi, J. Lessler, I. Eckerle, S. A. Lauer, L. Kaiser, N. Vuilleumier, D. A. T. Cummings,
support for the idea that in-person schooling carries with it                                   A. Flahault, D. Petrovic, I. Guessous, S. Stringhini, A. S. Azman, SEROCoV-POP
                                                                                                Study Group, Household Transmission of SARS-CoV-2: Insights from a
increased COVID-19 risk to household members; but also ev-
                                                                                                Population-based Serological Survey. medRxiv 2020.11.04.20225573 [Preprint].
idence that common, low cost, mitigation measures can re-                                       16 January 2021. https://doi.org/10.1101/2020.11.04.20225573.
duce this risk.                                                                            13. J. Zhang, M. Litvinova, Y. Liang, Y. Wang, W. Wang, S. Zhao, Q. Wu, S. Merler, C.
                                                                                                Viboud, A. Vespignani, M. Ajelli, H. Yu, Changes in contact patterns shape the
REFERENCES AND NOTES                                                                            dynamics of the COVID-19 outbreak in China. Science 368, 1481–1486 (2020).
                                                                                                doi:10.1126/science.abb8001 Medline
1. Y. Li, H. Campbell, D. Kulkarni, A. Harpur, M. Nundy, X. Wang, H. Nair, Usher Network   14. J. F. Ludvigsson, L. Engerström, C. Nordenhäll, E. Larsson, Open Schools, Covid-
     for COVID-19 Evidence Reviews (UNCOVER) group, The temporal association of                 19, and Child and Teacher Morbidity in Sweden. N. Engl. J. Med. 384, 669–671
     introducing and lifting non-pharmaceutical interventions with the time-varying             (2021). doi:10.1056/NEJMc2026670 Medline
     reproduction number (R) of SARS-CoV-2: A modelling study across 131 countries.        15. J. Vlachos, E. Hertegård, H. B. Svaleryd, The effects of school closures on SARS-
     Lancet Infect. Dis. 21, 193–202 (2021). doi:10.1016/S1473-3099(20)30785-4                  CoV-2 among parents and teachers. Proc. Natl. Acad. Sci. U.S.A. 118,
     Medline                                                                                    e2020834118 (2021). doi:10.1073/pnas.2020834118 Medline
2. S. Flaxman, S. Mishra, A. Gandy, H. J. T. Unwin, T. A. Mellan, H. Coupland, C.          16. Map: Where Has COVID-19 Closed Schools? Where Are They Open? (Education

First release: 29 April 2021                                               www.sciencemag.org                 (Page numbers not final at time of first release)                       4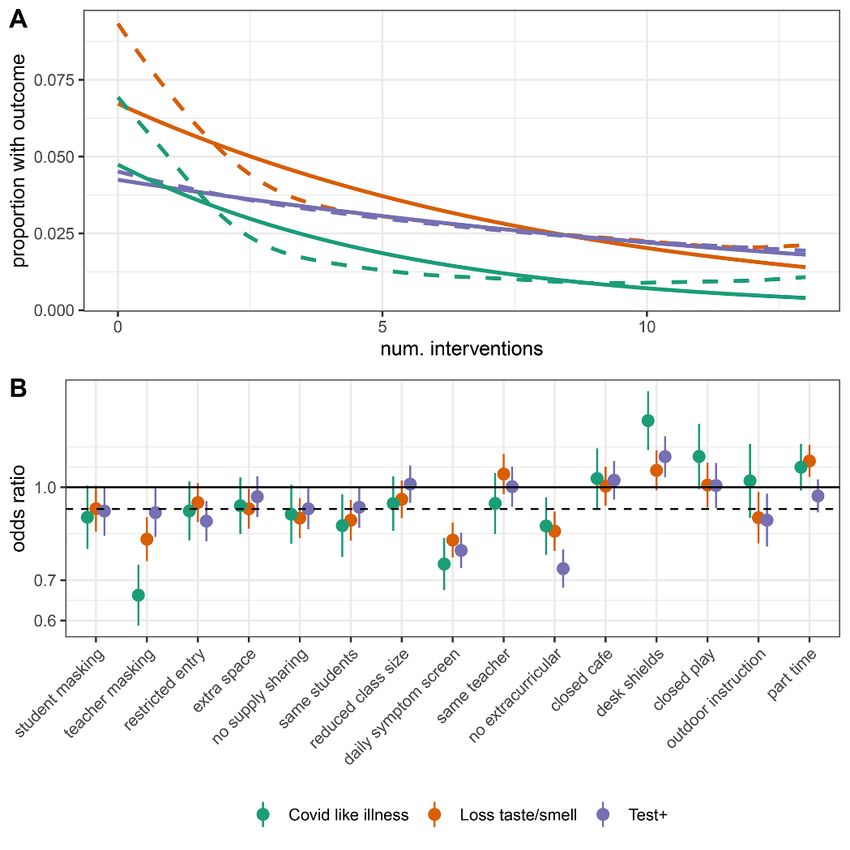
Week,         2020);         www.edweek.org/leadership/map-where-are-schools-               27 February 2021; accepted 26 April 2021
    closed/2020/07.                                                                             Published online 29 April 2021
17. F. Kreuter, N. Barkay, A. Bilinski, A. Bradford, S. Chiu, R. Eliat, J. Fan, T. Galili, D.   10.1126/science.abh2939
    Haimovich, B. Kim, S. LaRocca, Y. Li, K. Morris, S. Presser, T. Sarig, J. A. Salomon,
    K. Stewart, E. A. Stuart, R. Tibshirani, Partnering with a global platform to inform
    research and public policy making. Surv. Res. Methods 14, 159–163 (2020).
    doi:10.18148/srm/2020.v14i2.7761
18. Symptom Surveys, Delphi Epidata API (2020); https://cmu-
    delphi.github.io/delphi-epidata/api/covidcast-signals/fb-survey.html.
19. C. Lupton-Smith, E. B. Goicoechea, M. Collins, J. Lessler, M. K. Grabowski, E. A.
    Stuart, Consistency between household and county measures of K-12 onsite
    schooling during the COVID-19 pandemic. arXiv:2103.13296 [stat.AP] (24 March
    2021).
20. J. Lessler, M. K. Grabowski, K. H. Grantz, E. Badillo-Goicoechea, C. J. E. Metcalf, C.
    Lupton-Smith, A. S. Azman, E. A. Stuart, HopkinsIDD/inperson-schooling-covid-
    survey: second release with updated supplement, version v1.1, Zenodo (2021);
    http://doi.org/10.5281/zenodo.4710757.
21. N. Barkay, C. Cobb, R. Eilat, T. Galili, D. Haimovich, S. LaRocca, K. Morris, T. Sarig,
    Weights and Methodology Brief for the COVID-19 Symptom Survey by University

                                                                                                                                                                         Downloaded from http://science.sciencemag.org/ on May 15, 2021
    of Maryland and Carnegie Mellon University, in Partnership with Facebook.
    arXiv:2009.14675 [cs.SI] (25 September 2020).
22. Questions and Coding, Delphi Epidata API (2020); https://cmu-
    delphi.github.io/delphi-epidata/symptom-survey/coding.html.
23. E. Dong, H. Du, L. Gardner, An interactive web-based dashboard to track COVID-
    19 in real time. Lancet Infect. Dis. 20, 533–534 (2020). doi:10.1016/S1473-
    3099(20)30120-1 Medline
24. M. N. Wright, A. Ziegler, ranger: A Fast Implementation of Random Forests for High
    Dimensional Data in C++ andR. J. Stat. Softw. 77, 1–17 (2017).
    doi:10.18637/jss.v077.i01
ACKNOWLEDGMENTS
This research is partially based on survey results from Carnegie Mellon University’s
    Delphi Group. Funding: Johns Hopkins University Discovery Award (EB, CL,
    EAS); Johns Hopkins University COVID-19 Modeling and Policy Hub Award (EB,
    CL, EAS); Department of Health and Human Services (JL, MKG). Author
    contributions: Conceptualization: JL, MKG, CJEM, ASA, EAS. Methodology: JL,
    MKG, EAS. Investigation: JL, MKG, EB, CL, KHG. Visualization: JL, MKG, KHG.
    Funding acquisition: JL, EAS. Project administration: JL, EAS. Supervision: JL,
    MKG, EAS. Writing – original draft: JL, MKG, KHG, EB, CJEM, CL, ASA, EAS.
    Writing – review and editing: JL, MKG, KHG, EB, CJEM, CL, ASA, EAS. Competing
    interests: Authors declare they have no competing interests. Data and
    materials availability: Data are freely available from the CMU Delphi Research
    Group to researchers at universities and non-profits as detailed at Getting Data
    Access - Delphi Epidata API (https://cmu-delphi.github.io/delphi-epidata/). All
    analytic code with dummy data sets is available at
    https://github.com/HopkinsIDD/inperson-schooling-covid-survey (note this
    code will not reproduce paper tables and figures without obtaining underlying
    data from CMU). Analytic code is available at (20). This work is licensed under a
    Creative Commons Attribution 4.0 International (CC BY 4.0) license, which
    permits unrestricted use, distribution, and reproduction in any medium,
    provided the original work is properly cited. To view a copy of this license, visit
    https://creativecommons.org/licenses/by/4.0/. This license does not apply to
    figures/photos/artwork or other content included in the article that is credited
    to a third party; obtain authorization from the rights holder before using such
    material.
SUPPLEMENTARY MATERIALS
science.sciencemag.org/cgi/content/full/science.abh2939/DC1
Materials and Methods
Figs. S1 to S26
Tables S1 to S13
References (21–24)
MDAR Reproducibility Checklist
Data S1 to S3

First release: 29 April 2021                                                    www.sciencemag.org               (Page numbers not final at time of first release)   5
Downloaded from http://science.sciencemag.org/ on May 15, 2021
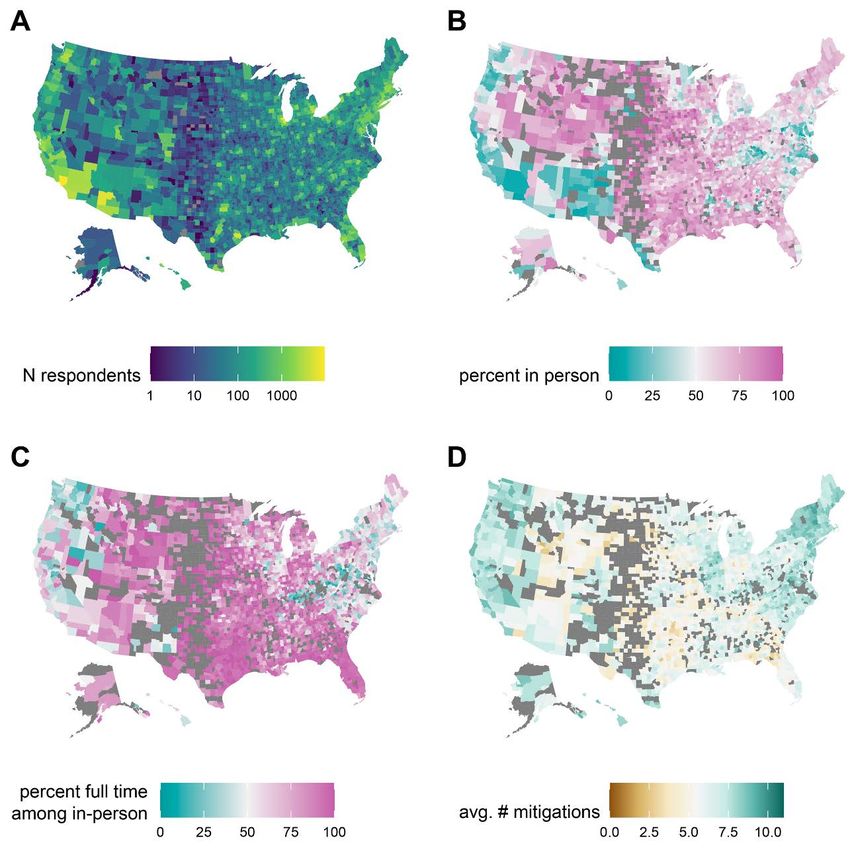
Fig. 1. Spatial distribution of survey responses. (A) Number of survey respondents
reporting a school age student in the household by county. (B) Percentage of households
with school age children reporting any in-person schooling by county, excluding counties
with fewer than 10 responses (excluded counties in dark grey). (C) Percentage of
households reporting a child in in-person schooling who report full-time in-person
schooling, excluding counties with fewer than 10 reporting in-person schooling. (D)
Average number of school-based mitigation measures reported for children with in-
person schooling, excluding counties with fewer than 10 reporting in-person schooling.
First release: 29 April 2021 www.sciencemag.org (Page numbers not final at time of first release) 6Fig. 2. Risk from in-person schooling and distribution of mitigation measures by grade. Downloaded from http://science.sciencemag.org/ on May 15, 2021
(A) Odds ratio of COVID-19-related outcomes associated with full- and part-time in-person
schooling by outcome and grade level, compared to individuals with children in their
household not attending in-person schooling and adjusted for individual- and county-level
covariates (but not number of mitigation measures) indicating that the strength of the
association increases with grade level. (B) Distribution of mitigation measures by grade level
and full- versus part-time in-person status across all grades.
First release: 29 April 2021 www.sciencemag.org (Page numbers not final at time of first release) 7Downloaded from http://science.sciencemag.org/ on May 15, 2021
Fig. 3. Impact of individual mitigation measures. (A) Relationship
between number of mitigation measures and percent reporting COVID-
19-related outcomes using a log-linear (solid) and spline (dashed) model.
(B) Odds ratio of COVID-19-related outcomes by mitigation measure in
multivariable model including all measures, versus the reduction due to
a generic mitigation measure (dotted line).
First release: 29 April 2021 www.sciencemag.org (Page numbers not final at time of first release) 8Downloaded from http://science.sciencemag.org/ on May 15, 2021
Fig. 4. Risk of in-person schooling by strata of number of reported mitigation measures.
(A) Estimated risk associated with full- and part-time in-person schooling by outcome and
number of mitigation measures implemented, adjusted for individual and county-level
covariates. (B) Distribution of mitigation measures by total number of measures
implemented.
First release: 29 April 2021 www.sciencemag.org (Page numbers not final at time of first release) 9Downloaded from http://science.sciencemag.org/ on May 15, 2021
Fig. 5. Sub-group analysis of association between in-person schooling and COVID-19-related outcomes.
Estimated odds ratio (versus those in strata not reporting in-person schooling) of COVID-19-related outcomes
from full-time (circles, dashed lines) and part-time (triangles, dotted line) in-person schooling when data are
stratified by (A) county population size and relation to metropolitan areas (metropolitan area, non-metropolitan
area, adjacent to metropolitan area), (B) quintile of incidence (Q1 is lowest, Q5 is highest) and (C) propensity to
report in-person schooling (Q5 most likely to have in-person schooling, Q1 least likely). Horizontal dashed and
dotted lines show overall point estimates for full-time and part-time in-person instruction, respectively.
First release: 29 April 2021 www.sciencemag.org (Page numbers not final at time of first release) 10Household COVID-19 risk and in-person schooling
Justin Lessler, M. Kate Grabowski, Kyra H. Grantz, Elena Badillo-Goicoechea, C. Jessica E. Metcalf, Carly Lupton-Smith, Andrew
S. Azman and Elizabeth A. Stuart
published online April 29, 2021
Downloaded from http://science.sciencemag.org/ on May 15, 2021
ARTICLE TOOLS http://science.sciencemag.org/content/early/2021/04/28/science.abh2939
SUPPLEMENTARY http://science.sciencemag.org/content/suppl/2021/04/28/science.abh2939.DC1
MATERIALS
RELATED http://stm.sciencemag.org/content/scitransmed/12/559/eabc3103.full
CONTENT
http://stm.sciencemag.org/content/scitransmed/12/556/eabc7075.full
http://stm.sciencemag.org/content/scitransmed/12/554/eabc1126.full
REFERENCES This article cites 17 articles, 4 of which you can access for free
http://science.sciencemag.org/content/early/2021/04/28/science.abh2939#BIBL
PERMISSIONS http://www.sciencemag.org/help/reprints-and-permissions
Use of this article is subject to the Terms of Service
Science (print ISSN 0036-8075; online ISSN 1095-9203) is published by the American Association for the Advancement of
Science, 1200 New York Avenue NW, Washington, DC 20005. The title Science is a registered trademark of AAAS.
Copyright © 2021 The Authors, some rights reserved; exclusive licensee American Association for the Advancement of Science.
No claim to original U.S. Government Works. Distributed under a Creative Commons Attribution License 4.0 (CC BY).You can also read