Shapes, shocks and wiggles - Kaleem Siddiqia,*, Benjamin B. Kimiab, Allen Tannenbaumc, Steven W. Zuckera
←
→
Page content transcription
If your browser does not render page correctly, please read the page content below
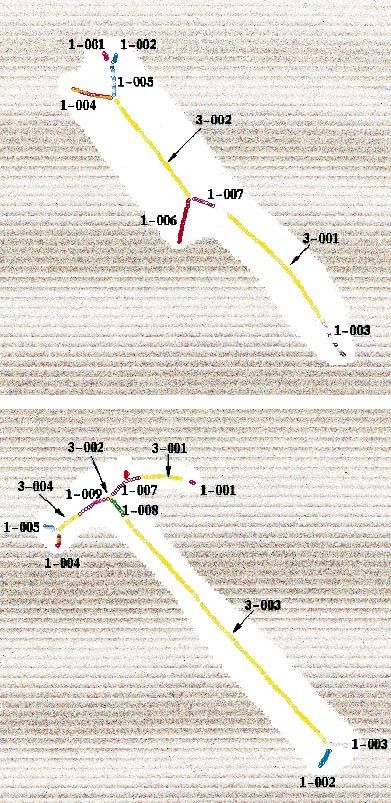
Image and Vision Computing 17 (1999) 365–373

                                                 Shapes, shocks and wiggles
           Kaleem Siddiqi a,*, Benjamin B. Kimia b, Allen Tannenbaum c, Steven W. Zucker a
                            a
                                Center for Computational Vision and Control, Yale University, New Haven, CT 06520-8285, USA
                                            b
                                              Division of Engineering, Brown University, Providence, RI 02912, USA
                                 c
                                   Department of Electrical Engineering, University of Minnesota, Minneapolis, MN 55455, USA
                                     Received 3 July 1997; received in revised form 18 March 1998; accepted 5 May 1998

Abstract
   We earlier introduced an approach to categorical shape description based on the singularities (shocks) of curve evolution equations. The
approach relates to many techniques in computer vision, such as Blum’s grassfire transform, but since the motivation was abstract it is not
clear that it should also relate to human perception. We now report that this shock-based computational model can account for recent
psychophysical data collected by Burbeck and Pizer. In these experiments subjects were asked to estimate the local centers of stimuli
consisting of rectangles with ‘wiggles’ (sides modulated by sinusoids). Since the experiments were motivated by their ‘core’ model, in which
the scale of boundary detail is proportional to object width, we conclude that such properties are also implicit in shock-based shape
descriptions. More generally, the results suggest that significance is a structural notion, not an image-based one, and that scale should be
defined primarily in terms of relationships between abstract entities, not concrete pixels. 䉷 1999 Elsevier Science B.V. All rights reserved.
Keywords: Shocks; Shape description; Shape perception; Shape significance

1. Introduction                                                                  significant for shape; after all, these are the ones that will
                                                                                 survive to the largest image scales. However, this is demon-
   The notion of ‘scale’ in computer vision is commonly                          strably not the case; see Fig. 1. Here we show three shapes: a
formulated in image-based terms. Fine scale features are                         thin rectangle, a thin rectangle with bumps, and a thicker
typically extracted using operators occupying a small spatial                    rectangle with bumps. Notice that the bumps significantly
extent (in pixels), whereas coarse scale features are                            alter the perception from a block to a ‘wiggle’, while for the
extracted using larger operators. This view has led to the                       last shape the bumps look like protrusions and the block is
development of scale-spaces in vision and image proces-                          once again perceived as being straight. Clearly there is more
sing, where many mathematical properties of the fine-to-                         to scale than size in pixels.
coarse simplification process have been formally motivated                          Secondly, the above example shows that context plays an
[1–10]. This effort is further supported by physiological                        important role; stated informally, note that a pimple on a
evidence that receptive fields for visual neurons can be                         teenager’s cheek is not quite the catastropic event that the
observed to be sensitive to a range of spatial support, a result                 same pimple on her nose would be. Despite the emergence
that is normally interpreted to imply that receptive field size                  of an elaborate literature on scale-spaces in computer vision,
defines the spatial scale of a ‘biological’ operator. The exis-                  to date there has been little insight into how such perceptual
tence of many such receptive fields covering each retinoto-                      observations can be explained, or into their deeper implica-
pic position suggests a ‘pyramid’-like organization of                           tions for object recognition. The pimple on the nose is a
operators upon which to base image representation [11].                          simple counterexample to the image-based view that small
   In contrast to this commonly held view of scale, there are                    operators will pick out structurally less significant features,
also structural considerations which dictate that scale should                   and the wiggles illustration shows that perceptions change
be formulated in object-based terms and not image-based                          as a complex function of size.
ones [12–14]: fingernails are fine scale with respect to the                        In this paper we investigate the notion of scale for 2D
fingers, fingers are fine scale with respect to the hand, and                    shape from computational and from perceptual considera-
the hand with respect to the arm, etc. The commonly held                         tions. We claim, from both considerations, that the signifi-
view implies that larger image structures should be more                         cance of a structure depends on its size with respect to
                                                                                 structures to which it is attached. This would explain, for
  * Corresponding author.                                                        example, why a pimple is perceived to be more salient when
0262-8856/99/$ - see front matter 䉷 1999 Elsevier Science B.V. All rights reserved.
PII: S0262-885 6(98)00130-9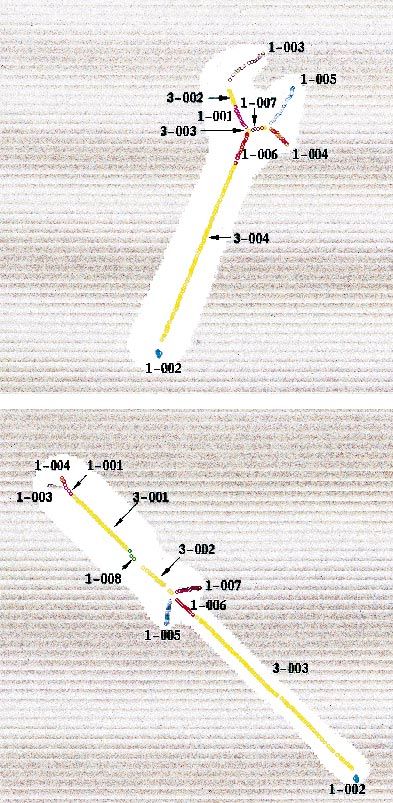
366 K. Siddiqi et al. / Image and Vision Computing 17 (1999) 365–373
situated on a (smaller) nose than when placed on a (larger)
cheek. The wiggles, however, are more complex. In order to
explain such percepts we first review the classification of
shocks upon which our computational model is based, and
briefly describe algorithms for computing such descriptions
in Section 2. In Section 3 we summarize the recent psycho-
physical experiments of Burbeck et al. designed to measure
the effect of boundary perturbations on the perceived centers
of elongated rectangle shapes [16]. This provides a quanti-
tative measure of how such shapes are represented by the
Fig. 2. A coloring of shocks into four types [18]. A 1-shock derives from a
human visual system. We then demonstrate that our shock-
protrusion, and traces out a curve segment of adjacent 1-shocks. A 2-shock
based model is consistent with the psychophysical data, and arises at a neck, and is immediately followed by two 1-shocks flowing away
show that it leads to a natural structural sale for significance, from it in opposite directions. 3-shocks correspond to an annihilation into a
as illustrated by numerous computational examples in curve segment due to a bend, and a 4-shock to an annihilation into a point or
Section 4. The key insight is to abstract the system of shocks a seed. The loci of these shocks give Blum’s medial axis.
into an object-based structure which, although derived from
image properties, supports the computational significance of or entropy-satisfying singularities, can form. The locus of
each component in relative terms (its size with respect to the points through which the shocks migrate is related to
components to which it is attached). Blum’s grassfire transformation [18,20], although signifi-
cantly more information is available via a ‘coloring’ of
these positions. Four types can arise, according to the
2. Shocks and the shape triangle local variation of the radius function along the medial axis
(Fig. 2). Intuitively, the radius function varies monotoni-
2.1. Shock classification cally at a type 1, reaches a strict local minimum at a type
2, is constant at a type 3 1 and reaches a strict local maximum
Observing that shapes which are slight deformations of at a type 4. The classification of shock positions according
one another appear similar, Kimia et al. proposed the to their colors is at the heart of our result.
following evolution equation for visual shape analysis
[17,18]: 2.2. Shock detection
C t 1 ⫹ akN The numerical simulation of Eq. (1) is based on level set
1 methods developed by Osher and Sethian [21,22]. The
C p; 0 C 0 p
essential idea is to represent the curve C(p, t) as the zero
Here C(p, t) is the vector of curve coordinates, N(p, t) is level set of a smooth and Lipschitz continuous function
the inward normal, p is the curve parameter, and t is the C :R 2 × [0, t ) ! R, given by {X 僆 R 2:C (X, t) 0}.
evolutionary time of the deformation. The constant a ⱖ 0 Since C(p, t) is on the zero level set, it satisfies
controls the regularizing effects of curvature k . When a is C C; t 0 2
large, the equation becomes a geometric heat equation;
when a 0, the equation is hyperbolic and shocks [19], By differentiating Eq. (2) with respect to t, and then with
respect to the curve parameter p, it can be shown that
Ct 1 ⫹ ak储7C储 3
Eq. (3) is solved using a combination of discretization and
numerical techniques derived from hyperbolic conservation
laws. The curve C, evolving according to Eq. (1), is then
obtained as the zero level set of C .
A convenient choice for C is the signed distance function
to the shape, which can be computed efficiently [23]. The
real-valued embedding surface also provides high resolution
information for detecting and localizing shocks. In particu-
lar, the four shock types can be classified using differential
properties of C (see Fig. 3). The algorithm for shock
Fig. 1. The small bumps significantly alter the perception of a straight
rectangle (left) to a ‘wiggle’ (middle). However, when the boundaries are
1
pulled apart (right) the shape is once again perceived as being straight, but Although this condition reflects the non-genericity of 3-shocks, ‘bend’-
now with wiggly sides. Adapted from [15,16]. like structures are abundant in the world and are perceptually salient.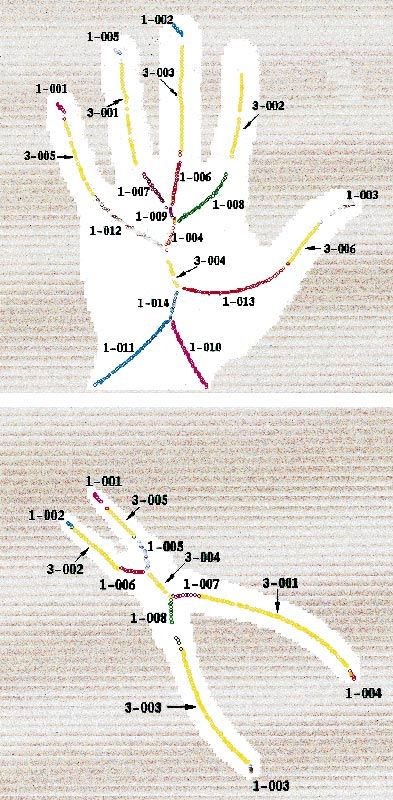
K. Siddiqi et al. / Image and Vision Computing 17 (1999) 365–373 367
Fig. 3. A classification of shock types based on properties of the embedding surface C (in this case the signed distance function, shown as a shaded surface).
Top left: First-order shocks occur at corners of the square shape, corresponding to creases on the surface with 兩7C 兩 ⬎ 0. Top right: A second-order shock forms
at the ‘neck’ of the peanut shape, corresponding to a hyperbolic point with 兩7C 兩 0. Bottom left: A set of third-order shocks forms along the central axis of the
worm shape, where k 1k 2 兩7C 兩 0. Bottom right: A fourth-order shock forms in the center of the circle shape, where k 1k 2 ⬎ 0 and 兩7C 兩 0. Adapted from [24].
detection, described in detail in [25], can now be summar- parts separated at a ‘neck’ (second-order shock), with each
ized as follows: part consisting of three ‘protrusions’ (first-order shock
groups) merging onto a ‘seed’ (fourth-order shock). The
1. For a small time step, evolve the curve by Eq. (1) with notion of parts for 2D shape, popularized by Hoffman and
a 0, using a shock capturing curve evolution scheme Richards’ work [30], has been further investigated in [31].
[26,27]. It can be proven that the locus of positions covered by all
2. Obtain estimates of current shock locations and veloci- of the above shocks is formally equivalent to the Blum
ties by subpixel interpolation on C [24,28]. skeleton [32], which raises the question of why we choose
3. Group current shocks together with past shocks with to work with shocks. The examples in Figs. 10–12 provide
which they are consistent [24]. the answer: with shocks there are two additional factors
4. Repeat till the shape is annihilated. labeling the skeleton: (i) the type of shock which ‘colors’
The above algorithm provides accurate descriptions, but the skeletal points; and (ii) the significance of the shock,
at significant computational cost. In particular, the subpixel related to its time formation. As we shall see later, type and
interpolation algorithm requires multiple polynomial fits to significance provide an enriched description that is better
portions of the surface C . In ongoing work, alternative suited to recognition than simply the locus of shock points.
methods for shock detection are being explored [29];
2.3. The shape triangle
these are computationally more efficient and can be applied
to fragmented contours as well. The generic perceptual shape classes discussed above
To get an intuitive feel for the shock detection process, have led to the metaphor of a shape triangle, where three
consider the numerical simulation of a dumbbell shape evol- distinct processes compete with one another to explain
ving under constant inward motion, Fig. 4. Note the emer- shape [15], Fig. 5 (left). The sides of the triangle reflect
gence of a qualitative description of the shape as that of two this competition and capture the tension between object
Fig. 4. The detection of shocks for a dumbbell shape undergoing constant inward motion. Each sub-figure is a snapshot of the evolution in time, with the outline
of the original shape shown in black, the evolved curve overlaid within, and the arrows representing velocity vectors for the current first-order shocks. Adapted
from [24].368 K. Siddiqi et al. / Image and Vision Computing 17 (1999) 365–373
Fig. 5. Left: the sides of the shape triangle represent continua of shapes; the extremes correspond to the ‘parts’, ‘protrusions’ and ‘bends’ nodes [15]. Right: we
plot the time till formation of the second-order shock (for constant inward motion), normalized by the lifetime of the shape, for samples of the ‘bow-tie’ stimuli
used in [15]. Observe the increase in this ratio in moving from the parts node (shape 10) to the protrusions node (shape 1).
composition (parts), boundary deformation (protrusions) ‘bends’ node the axis is seen to wiggle, whereas for thicker
and region deformation (bends). When one considers the objects placed close to the ‘protrusions’ node the axis is
parts–protrusions continuum and plots the time till forma- perceived to be straight. Within the shock-based framework,
tion of the second-order shock under constant inward such effects are reflected in the geometry of the high-order
motion, normalized by the time till annihilation of the shocks that arise, Fig. 8. We are formally led to the follow-
shape, Fig. 5 (right), a curious connection is unearthed. ing prediction:
The ratio is a measure of local width versus global width, Prediction 1: The perceived center of a ‘wiggle’ along a
and provides a metric for the perceptual distance of the horizontal line in alignment with a sinusoidal peak coin-
shape from the ‘parts’ node along this axis. cides with a high-order shock 2 that forms under constant
Now, note that intermediate shapes along the bends– inward motion.
protrusions continuum closely resemble wiggles. The term The psychophysical experiments of Burbeck et al., intro-
‘wiggle’ appropriately describes not only the sinusoidal duced next, involved precisely the above class of shapes.
nature of the boundary modulation but also its perceived
2
effect on the object’s central axis [16]. In the context of Type 3 or 4 for in-phase sinusoids, and type 2 for out-of-phase ones
the shape triangle, for thin objects placed close to the (mirror symmetric shapes).
Fig. 6. Left: the geometry of a ‘wiggle’ stimulus. Right: is the dot to the left or to the right of the object’s center?K. Siddiqi et al. / Image and Vision Computing 17 (1999) 365–373 369
of the center of the object, as measured along a horizontal
line through the dot’’. 3 As a sample experiment, view the
stimulus on the right of Fig. 6 for a period of one second
from a distance of 1.5 m. You are likely to judge the dot to
be to the right of the object’s center. It may surprise you to
find that it actually lies midway between the boundaries on
either side, as can be verified by placing a ruler across the
figure. In fact, despite instructions to make a local judge-
ment, your visual system is biased towards acquiring edge
information across a more global spatial extent.
Burbeck and Pizer quantified this effect of edge modula-
Fig. 7. The shock-based description of selected 40% amplitude modulation
tion on the perceived center by varying the horizontal posi-
stimuli used in [16]: (a) 0.75⬚ width, 0.25 cycles/⬚ edge modulation; (b) tion of the probe dot and subjecting the data to probit
0.75⬚ object, 2.0 cycles/⬚ edge modulation; (c) 1.5⬚ object, 0.25 cycles/⬚ analysis. The center of the object was inferred as the 50%
edge modulation; (d) 1.5⬚ object, 2.0 cycles/⬚ edge modulation. point on the best-fitting probit function, 4 and the bisection
threshold was defined as the variance of this function. The
perceived central modulation was then obtained as the hori-
3. Wiggles zontal displacement between the perceived centers in align-
ment with left and right sinusoidal peaks. The main findings
Pizer et al. [16,33,34] have developed an alternative were:
approach to visual shape analysis, called the core model. Result 1: For a fixed edge modulation frequency the
Underlying the formulation of the core model is the hypoth- perceived central modulation decreases with increasing
esis that the scale at which the human visual system inte- object width.
grates local boundary information towards the formation of Result 2: For a fixed object width the perceived central
more global object representations is proportional to object modulation decreases with increasing edge modulation
width. Psychophysical examinations of Weber’s law for frequency.
separation discrimination support this proposal [35]. These results appear to be consistent with our earlier
Arguing that the same mechanism explains the attenuation prediction. Specifically, if the perceived centers of the
of edge modulation effects with width, Burbeck et al. have wiggle stimuli inferred by Burbeck et al. coincide with
recently reported on an elegant set of psychophysical high-order shocks, the central modulation, computed as
experiments where subjects were required to bisect elon- the horizontal displacement between fourth-order shocks
gated stimuli with wiggly sides. In the following we present in alignment with successive left and right sinusoidal
their main findings. As predicted above, we will later peaks, Fig. 8, should agree with the psychophysical data.
demonstrate a strong correlation between these findings Thus, in the following section, we compare computational
and computational results obtained from a shock-based results obtained using the shock detection algorithm
description of the wiggles. (Section 2.2) with Burbeck et al.’s data.
The stimuli consisted of rectangles subtending 4⬚ of
visual arc in height, with sinusoidal edge modulation, Fig.
6 (left). Two widths were considered (0.75⬚ and 1.5⬚) and for 4. Shock-based results
each width there were six edge modulation frequencies
4.1. Psychophysics
(0.25, 0.5, 1, 2, 4, 8 cycles/⬚) and two edge modulation
amplitudes (20% and 40% of object width). A black probe
We computed shock-based representations for all 24
dot appeared near the center of each stimulus, in horizontal
wiggles using the algorithm in Section 2.2. Results for
alignment with a sinusoidal peak. The subject was asked to
selected stimuli are shown in Fig. 7, with the geometry of
indicate ‘‘whether the probe dot appeared to be left or right
the high-order shocks explained in Fig. 8. As evidence in
support of our hypothesis, consider the computed central
modulations overlaid as solid lines on the original observer
data, taken from [16], in Fig. 9. We note that the predicted
central modulations are consistent with an ‘average’ obser-
ver’s data.
Whereas the core and the shock-based representation are
motivated from quite different points of view, the strong
3
Fig. 8. Shape (d) from Fig. 7 is rotated and second-order and fourth-order See [16] for further details.
shocks are labelled (all other shocks are first-order). Note that the fourth- 4
The location at which a subject is statistically equally likely to judge the
order shocks are in alignment with the sinusoidal peaks. probe dot to be to the left or the right of the object’s center.370 K. Siddiqi et al. / Image and Vision Computing 17 (1999) 365–373
Fig. 10. The shocks computed for a hand (from the NRCC database) and a
plier (from the Rutgers University Tool Database) using the algorithm in
Section 2.2. The shapes were segmented from intensity images using the
active contour developed in [46]. Each distinct group of shocks is given a
Fig. 9. Central modulations computed from shock-based descriptions (solid unique label, with the first digit denoting the ‘type’. Adapted from [47].
lines) are overlaid on the average observer data (dashed lines) from [16].
The central modulations are expressed as a percentage of the edge modula-
tion amplitude and are plotted against edge modulation frequency for connections that have emerged. In particular, the ‘fuzziness’
amplitudes of 20% of the object width (top) and 40% of the object width of the core model, whereby the width of the core scales with
(bottom). Results for the wider 1.5⬚ object are depicted by circles and for object width, is paralleled by the ratio of a shock’s forma-
the narrower 0.75⬚ object by squares. tion time to the lifetime of the shape, a measure of local
width/global width. This property is also reflected in the
overlap between computational and psychophysical results ‘bisection threshold’ or variance of the perceived centers
for each model points to an intimate connection between in the psychophysical experiments of Burbeck et al. Under-
them. A precise mathematical comparison is beyond the lying this notion is the concept that the scale at which
scope of this paper. Instead, we identify the qualitative boundaries should interact to form more global objectK. Siddiqi et al. / Image and Vision Computing 17 (1999) 365–373 371
Fig. 11. The shocks computed for a brush and a hammer (from the Rutgers Fig. 12. The shocks computed for a wrench and a screwdriver (from the
University Tool Database) using the algorithm in Section 2.2. The shapes Rutgers University Tool Database) using the algorithm in Section 2.2. The
were segmented from intensity images using the active contour developed shapes were segmented from intensity images using the active contour
in [46]. Each distinct group of shocks is given a unique label, with the first developed in [46]. Each distinct group of shocks is given a unique label,
digit denoting the ‘type’. Adapted from [47]. with the first digit denoting the ‘type’. Adapted from [47].
models is proportional to the spatial extent arcoss which relevant to the recognition of generic objects. To begin, in
they communicate. Both models support medial-axis like Figs. 10–12 we show examples of a collection of different
representations for shape [32,36–45]. It is indeed gratifying objects with their labeled shocks. Recalling that the Blum
that they are further quantifiably consistent with human skeleton is the locus of positions through which the shocks
performance involving shape. migrate, notice that from a topological perspective several
very different objects have almost identical Blum skeletons.
4.2. Recognition and structural significance (To do this, just ignore the colors in the diagrams that
follow; the skeleton is the locus of shock positions.) The
We now expand the previous ideas to show how they are problem of shape matching using medial-axis based372 K. Siddiqi et al. / Image and Vision Computing 17 (1999) 365–373
representations, attempted by [42,48,49] and others, has References
proved difficult precisely for this reason. Changes in the
representation due to noise are often more extensive than [1] J.J. Koenderink, The structure of images, Biological Cybernetics 50
(1984) 363–370.
inherent structural differences. To make matters worse, even [2] J.J. Koenderink, A.J. van Doorn, Dynamic shape, Biological Cyber-
perfect skeletons may not suffice for recognition: different netics 53 (1986) 383–396.
objects may give rise to the same skeleton, as exemplified [3] A.P. Witkin, Scale-space filtering. In: Proceedings of the 8th Interna-
by the pliers in Fig. 10 and the skeleton of an elementary tional Joint Conference on Artificial Intelligence, Karlsruhe, West
rectangle. Of course, there are quantitative geometric differ- Germany, August 1983, pp. 1019–1022.
[4] L. Alvarez, F. Guichard, P.L. Lions, J.M. Morel, Axioms and funda-
ences, but it is these differences that are most sensitive to mental equations of image processing. Archive of Rational Mechanics
noise. and Analysis (1993) 123.
Labeling the skeleton with the type of shock from which [5] G. Sapiro, A. Tannenbaum, Affine invariant scale-space. International
each skeletal point derives provides a much richer founda- Journal of Computer Vision, 10 (1993) 25–44.
tion for recognition. In effect, this puts the ‘color’ back into [6] T. Lindeberg, Scale-Space Theory in Computer Vision. Kluwer
Academic Publishers, Dordrecht, 1994.
our illustrations and, in particular, now reveals that the [7] B.M.t. Haar Romeny (Ed.), Geometry-driven Diffusion in Computer
pliers, the brush and the hammer all have very different Vision. Kluwer Academic Publishers, Dordrecht, 1994.
labeled skeletons. Moreover, the labeling can direct the [8] L.M.J. Florack, B.M.t. Haar Romeny, J.J. Koenderink, M.A. Vierg-
matching. For example, it would be implausible to match ever, Linear scale-space, Journal of Mathematical Imaging and Vision
a 3-shock branch in the nose of the pliers (Fig. 10) to a 1- 4 (4) (1994) 325–351.
[9] L.M.J. Florack, A.H. Salden, B.M.t. Haar Romeny, J.J. Koenderink,
shock branch in the corner of the brush (Fig. 11), although M.A. Viergever, Nonlinear scale-space, Image and Vision Computing
each of these is simply a skeletal branch in the Blum sense. 13 (1995) 279–294.
Such notions have been formalized via an abstraction of the [10] L.M.J. Florack, B.M.t. Haar Romeny, J.J. Koenderink, M.A. Vierg-
shock-based system into a shock graph, and algorithms have ever, The Gaussian scale-space paradigm and the multiscale local jet,
been developed for shape matching using graph-theoretic International Journal of Computer Vision 18 (1996) 61–75.
[11] P.J. Burt, E.H. Adelson, The Laplacian pyramid as a compact
concepts [47,50]. The topological structure of the graph image code, IEEE Transactions on Communications 31 (4) (1983)
provides a powerful means of indexing into a database to 532–540.
find structurally similar shapes, and the matching algorithms [12] T.O. Binford, Visual perception by computer. In: IEEE Conference on
are very efficient, typically taking only a few seconds to Systems and Control, Miami, FL, December 1971.
converge. [13] D. Marr, K.H. Nishihara, Representation and recognition of the
spatial organization of three dimensional structure, Proceedings of
More is required for matching than simple labeling, the Royal Society of London, B 200 (1978) 269–294.
however, as the psychophysical results in this paper have [14] S.W. Zucker, Structural scales in computational vision. In: K.
shown. The perceptual effect of a ‘wiggle’ was a function of Bowyer, N. Ahuja (Eds.), Advances in Image Understanding, A
the geometry of the shocks as well as the ratio of local width Festschrift for Azriel Rosenfeld. IEEE Computer Society Press,
to global width, as measured by the ratio of 2-shock to 4- 1996, pp. 130–141.
[15] B.B. Kimia, A. Tannenbaum, S.W. Zucker, The shape triangle: Parts,
shock formation times. This ratio is an example of a struc- protrusions, and bends. In C. Arcelli, L.P. Cordella, G.S. di Baja
tural significance measure which extends to far more (Eds.), Proceedings of the Second International Workshop on Visual
complicated shapes than the symmetric wiggles. For exam- Form: Aspects of Visual Form Processing, World Scientific, Capri,
ple, the significance of any component of the hand shape in Italy, 1994, pp. 307–323.
Fig. 10, such as a finger, can be measured with respect to the [16] C.A. Burbeck, S.M. Pizer, B.S. Morse, D. Ariely, G.S. Zauberman, J.
Rolland, Linking object boundaries at scale: A common mechanism
formation time of the central 3-shock. This is an example of for size and shape judgements, Vision Research 36 (3) (1996) 361–
an object-based scale, like our earlier example of a nose 372.
pimple as compared to a pimple on the cheek. Much remains [17] B.B. Kimia, A. Tannenbaum, S.W. Zucker, Toward a computational
to be done with respect to object-based scales, and we hope theory of shape: An overview, in: Proceedings of the First European
that the examples in this paper provide a motivation for Conference on Computer Vision, Antibes, France. Lecture Notes in
Computer Science, Springer-Verlag 427, 1990, pp. 402–407.
considering them more fully in the future. [18] B.B. Kimia, A. Tannenbaum, S.W. Zucker, Shape, shocks, and defor-
mations I: The components of two-dimensional shape and the reac-
tion–diffusion space, International Journal of Computer Vision 15
Acknowledgements (1995) 189–224.
[19] P.D. Lax, Shock waves and entropy, in: Contributions to Nonlinear
Functional Analysis, Academic Press, New York, 1971, pp. 603–634.
This work was supported by grants from the Natural [20] R. Brockett, P. Maragos, Evolution equations for continuous-scale
Sciences and Engineering Research Council of Canada, morphology, in: Proceedings of the IEEE Conference on Acoustics,
from the National Science Foundation, from the Air Force Speech and Signal Processing, San Francisco, CA, March 1992.
Office of Scientific Research and from the Army Research [21] S.J. Osher, J.A. Sethian, Fronts propagating with curvature dependent
Office. We thank Christina Burbeck, Steve Pizer and Xiao- speed: Algorithms based on Hamilton–Jacobi formulations, Journal
of Computational Physics 79 (1988) 12–49.
fei Wang for fruitful discussions and for supplying us with [22] J.A. Sethian, Level Set Methods: Evolving Interfaces in Geometry,
the wiggle stimuli, and Sven Dickinson for the use of shapes Fluid Mechanics, Computer Vision, and Materials Science.
from the Rutgers Tools database. Cambridge University Press, 1996.K. Siddiqi et al. / Image and Vision Computing 17 (1999) 365–373 373
[23] P. Danielsson, Euclidean distance mapping. Computer Graphics and [37] C. Arcelli, G.S. de Baja, Euclidean skeleton via centre-of-maximal-
Image Processing, 14 (1980) 227–248. disc extraction, Image and Vision Computing 11 (3) (1993) 163–173.
[24] K. Siddiqi, B.B. Kimia, A shock grammar for recognition, in: Confer- [38] M. Brady, H. Asada, Smoothed local symmetries and their imple-
ence on Computer Vision and Pattern Recognition, San Francisco, mentation, International Journal of Robotics Research 3 (3) (1984)
CA, IEEE Computer Society Press, June 1996, pp. 507–513. 36–61.
[25] K. Siddiqi, B.B. Kimia, A shock grammar for recognition. Technical [39] M. Leyton, Symmetry-curvature duality, Computer Vision, Graphics,
Report LEMS 143, LEMS, Brown University, September 1995. and Image Processing 38 (1987) 327–341.
[26] C.-W. Shu, S.J. Osher, Efficient implementation of essentially non- [40] S.M. Pizer, W.R. Oliver, S.H. Bloomberg, Hierarchial shape descrip-
oscillatory shock-capturing schemes, Journal of Computational tion via the multiresolution symmetric axis transform. IEEE Trans-
Physics 77 (1988) 439–471. actions on Pattern Analysis and Machine Intelligence, 9 (4) (1987)
[27] S.J. Osher, C.-W. Shu, High-order essentially non-oscillatory 505–511.
schemes for Hamilton–Jacobi equations, SIAM Journal of Numerical [41] F. Leymarie, M.D. Levine, Simulating the grassfire transform using
Analysis 28 (1991) 907–922. an active contour model. IEEE Transactions on Pattern Analysis and
[28] K. Siddiqi, B.B. Kimia, C. Shu, Geometric shock-capturing ENO Machine Intelligence, 14 (1992) 56–75.
schemes for subpixel interpolation, computation and curve evolution, [42] R.L. Ogniewicz, Discrete Voronoi Skeletons, Hartung–Gorre, 1993.
Graphical Models and Image Processing 59 (5) (1997) 278–301. [43] H. Rom, G. Medioni, Hierarchial decomposition and axial shape
[29] H. Tek, F. Leymarie, B.B. Kimia, Interpenetrating waves and multiple description. IEEE Transactions on Pattern Analysis and Machine
generation shocks via the CEDT. In: C. Arcelli, L.P. Cordella, G.S. di Intelligence, 15 (10) (1993) 973–981.
Baja (Eds.), Proceedings of the Third International Workshop on [44] I. Kovacs, B. Julesz, Perceptual sensitivity maps within globally
Visual Form: Advances in Visual Form Analysis, World Scientific, defined visual shapes, Nature 370 (1994) 644–646.
Capri, Italy, 1997, pp. 582–593. [45] M. Kelly, M.D. Levine, Annular symmetry operators: A method for
[30] D.D. Hoffman, W.A. Richards, Parts of recognition, Cognition 18 locating and describing objects. In: Fifth International Conference on
(1985) 65–96. Computer Vision, June 1995, pp. 1016–1021, Boston, MA.
[31] K. Siddiqi, K.J. Tresness, B.B. Kimia, Parts of visual form: Psycho- [46] K. Siddiqi, Y.B. Lauzière, A. Tannenbaum, S.W. Zucker, Area and
physical aspects, Perception 25 (1996) 399–424. length-minimizing flows for shape segmentation, IEEE Transactions
[32] H. Blum, Biological shape and visual science, Journal of Theoretical on Image Processing 7 (3) (1998) 433–443.
Biology 38 (1973) 205–287. [47] K. Siddiqi, A. Shokoufandeh, S.J. Dickinson, S.W. Zucker, Shock
[33] B.S. Morse, S.M. Pizer, C.A. Burbeck, General shape and specific graphs and shape matching. In: Proceedings of the International
detail: Context-dependent use of scale in determining visual form, in: Conference on Computer Vision, Bombay, India, 1998, pp. 222–229.
C. Arcelli, L.P. Cordelia, G.S. di Baja (Eds.), Proceedings of the [48] S. Zhu, A.L. Yuille, Forms: a flexible object recognition and model-
Second International Workshop on Visual Form: Aspects of Visual ling system, International Journal of Computer Vision 20 (3) (1996)
Form Processing, World Scientific, Capri, Italy, 1994, pp. 374–383. 187–212.
[34] C.A. Burbeck, S.M. Pizer, Object representation by cores: Identifying [49] A. Francois, G. Medioni, Generic shape learning and recognition, in:
and representing primitive spatial regions, Vision Research 35 (13) J. Pance, A. Zisserman, M. Herbert (Eds.), International Workshop on
(1995) 1917–1930. Object Representation in Computer Vision, Cambridge, England,
[35] C. Burbeck, S. Hadden, Scaled position integration areas: Accounting 1996, Lecture Notes in Computer Science 1144, Springer-Verlag.
for Weber’s law for separation. Journal of the Optical Society of [50] M. Pelillo, K. Siddiqi, S.W. Zucker, Matching hierarchical structures
America A, 10 (1) (1993) 5–15. using association graphs, in: H. Burkhardt, B. Neumann (Eds.),
[36] C. Arcelli, L.P. Cordella, S. Leviadi, From local maxima to connected Proceedings of the Fifth European Conference on Computer Vision,
skeletons. IEEE Transactions on Pattern Analysis and Machine June 1998, vol. II, pp. 3–16. Lecture Notes in Computer Science
Intelligence, 3 (2) (1981) 134–143. 1406, Springer-Verlag, Freiburg, Germany.You can also read