Scanning SQUID microscopy in a cryogen-free dilution refrigerator
←
→
Page content transcription
If your browser does not render page correctly, please read the page content below
Scanning SQUID microscopy in a cryogen-free dilution refrigerator
                                                               D. Low,1 G. M. Ferguson,1 Alexander Jarjour,1 Brian T. Schaefer,1 Maja D. Bachmann,2, 3 Philip J. W. Moll,4
                                                               and Katja C. Nowack1, 5, a)
                                                               1)
                                                                  Laboratory of Atomic and Solid-State Physics, Cornell University, Ithaca, NY 14853,
                                                               USA
                                                               2)
                                                                  Max Planck Institute for Chemical Physics of Solids, D-01187 Dresden, Germany
                                                               3)
                                                                  School of Physics and Astronomy, University of St. Andrews, St. Andrews KY16 9SS,
                                                               UK
                                                               4)
                                                                  Laboratory of Quantum Materials (QMAT), Institute of Materials, École Polytechnique Fédéral de Lausanne (EPFL),
                                                               1015 Lausanne, Switzerland
                                                               5)
                                                                  Kavli Institute at Cornell for Nanoscale Science, Cornell University, Ithaca, NY 14853,
arXiv:2102.09588v1 [cond-mat.mes-hall] 18 Feb 2021

                                                               USA
                                                               (Dated: 22 February 2021)
                                                               We report a scanning superconducting quantum interference device (SQUID) microscope in a cryogen-free
                                                               dilution refrigerator with a base temperature at the sample stage of at least 30 mK. The microscope is
                                                               rigidly mounted to the mixing chamber plate to optimize thermal anchoring of the sample. The microscope
                                                               housing fits into the bore of a superconducting vector magnet, and our design accommodates a large number
                                                               of wires connecting the sample and sensor. Through a combination of vibration isolation in the cryostat
                                                               and a rigid microscope housing, we achieve relative vibrations between the SQUID and sample that allow
                                                               us to image with micrometer resolution over a 150 µm range while the sample stage temperature remains at
                                                               base temperature. To demonstrate the capabilities of our system, we show images acquired simultaneously
                                                               of the static magnetic field, magnetic susceptibility, and magnetic fields produced by a current above a
                                                               superconducting micrometer-scale device.

                                                                                                                       4
                                                     I.   INTRODUCTION                                                  He transfers are necessary, which can interrupt measure-
                                                                                                                       ments and prevent running experiments remotely over
                                                        Superconducting Quantum Interference devices                   extended periods of time. Cryogen-free DRs are often
                                                     (SQUIDs) are among the most sensitive magnetic                    built with a large sample volume as they do not require
                                                     sensors available and have been widely used for magnetic          a 4 He bath to envelop the inner vacuum chamber. How-
                                                     imaging at cryogenic temperatures. Scanning SQUID                 ever, vibrations from the cryocooler put cryogen-free DRs
                                                     microscopy can be used to image static stray magnetic             at a major disadvantage. During the pulse tube cooling
                                                     fields above a sample, to measure the local magnetic              cycle, high-pressure helium gas is pushed in and out of
                                                     response and to image the magnetic field produced by              the pulse tube at a frequency of approximately 1 Hz,
                                                     applied and spontaneous currents in a device. This                rendering scanning probe microscopy in a cryogen-free
                                                     technique has been applied to a wide variety of quantum           DR challenging. To date only a few scanning probe mi-
                                                     materials and mesoscopic devices including uncon-                 croscopes have been reported that operate in cryogen-
                                                     ventional superconductors1 , topological insulators2,3 ,          free DRs, including a scanning gate microscope13 and a
                                                     complex oxides4–6 , superconducting and normal metal              scanning tunneling microscope14 . In both cases, custom
                                                     rings7–10 , and unconventional Josephson junctions11,12 .         spring stages were used to mechanically isolate the mi-
                                                     Some physical phenomena require cooling to sub-Kelvin             croscope from the cryostat.
                                                     temperatures, which can be achieved in a dilution                    Scanning SQUID microscopy has been implemented in
                                                     refrigerator (DR). In a traditional DR, an inner vacuum           two different types of cryogen-free cryostats with base
                                                     chamber is immersed in a liquid 4 He bath. Within                 temperatures of ∼3–4 K, but not in a cryostat reach-
                                                     the vacuum chamber, a smaller bath of liquid 4 He is              ing lower temperatures. In Ref.15 , the authors used a
                                                     pumped to lower its temperature to ∼1.5 K. This bath              cryostat with built-in mechanical isolation between the
                                                     precools a circulating 4 He/3 He mixture that ultimately          cryocooler and the cold plate on which the microscope
                                                     provides continuous cooling to a few millikelvin. In a            is mounted. In Ref.16 , the microscope was placed in a
                                                     cryogen-free DR, all liquid 4 He baths are replaced by a          pulse tube based cryostat similar to our own but without
                                                     cryocooler, often a pulse tube, which provides cooling            the dilution unit and associated cold plates. A custom
                                                     to approximately 3 K. Closed-cycle circulation of a               spring stage was used to significantly reduce vibrations
                                                     4
                                                       He/3 He mixture is still used in these systems to achieve       in the microscope. However, such mechanical isolation
                                                     temperatures of a few millikelvin at the mixing chamber.          often comes at the cost of reduced thermal anchoring:
                                                        A cryogen-free DR is attractive due to rising prices           a less rigid mechanical connection implies less thermal
                                                     and uncertain supply of liquid helium. In addition, no            conductivity between the microscope and the cold plate.
                                                                                                                       A weak thermal connection can prevent rapid measure-
                                                                                                                       ments over a large scan window due to the heat piezoelec-
                                                     a) Electronic   mail: kcn34@cornell.edu                           tric elements generate while moving. This is particularly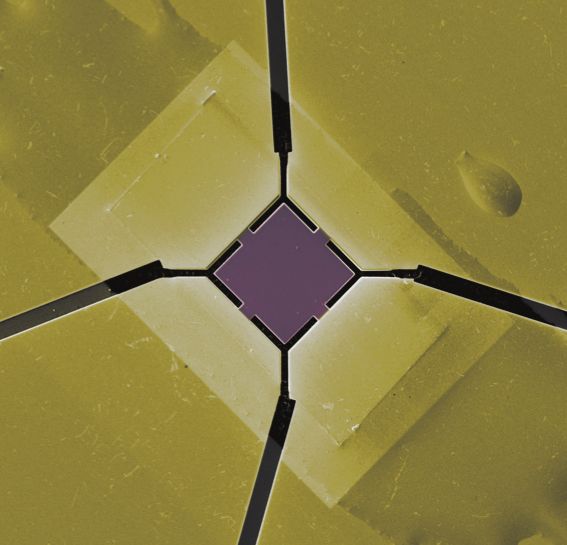
2

challenging when operating near the base temperature           (a)                        (b)             (c)
                                                               Air Spring                              Sa
in a DR due to the limited cooling power. In addition,                                                pu mple
a spring stage is difficult to combine with mechanically                                                ck
rigid low-loss coaxial connections to either the SQUID or                                               SQ
the sample. Such connections are necessary to implement                                               mo UID
                                                                                                         un
a dispersive SQUID readout17–19 or to deliver gigahertz       Cu Braid
                                                                                                            t
and fast rise time excitations to a sample. Combining a                        Pulse Tube              Pie
spring stage with a superconducting magnet is challeng-                                               sc zo
                                                                                                        an
                                                              Mixing                                       ne
ing as well, since a strong magnetic field may exert forces                                                   r
on the microscope and causes undesirable motion20 . In        Chamber                                At
                                                                                                        t
                                                              plate                                 po ocu
principle, scanning probe microscopes are only affected                                               sit be
                                                                                                          ion
by relative motion of the probe and the sample. This sug-                y Vector                            er
                                                                                                               s
gests that a rigid microscope in which the probe and sam-                  Magnet
                                                                     z
ple move together in response to the pulse-tube-induced                                                     x          y
vibrations offers an alternative to using spring stages.      1000 mm                       100 mm                         25 mm
                                                                                                                   z
   Here, we report the implementation of a scanning
SQUID microscope in a cryogen-free DR with a base             FIG. 1. Drawings of experimental setup and scanning probe
temperature of ∼10 mK. The microscope is operated             microscope. (a) Cross-sectional view of dilution refrigerator
in the bore of a superconducting vector magnet. We            with scanning probe microscope. The room temperature vac-
avoid the use of a spring stage in order to optimize          uum can is shown. Light tight cans at 60 K, 4 K, and 1 K and
for low sample temperatures. To achieve an acceptable         various cross beams on both frames are omitted for clarity. (b)
level of vibrations, we designed the microscope priori-       Cold finger and microscope housing that attach to the mix-
tizing rigidity while still maintaining a scan range of       ing chamber plate. (c) Microscope housing cutaway showing
                                                              coarse positioners, the piezoelectric scanner, and sample puck.
150 × 150 × 100 µm3 and 6 × 6 × 6 mm3 coarse position-
                                                              The piezoelectric benders are shown in dark grey. The sam-
ing range.                                                    ple is mounted face-down on the sample puck. The SQUID
                                                              is mounted on a printed circuit board (not shown) inserted
                                                              on the end of the horizontal piezoelectric bender providing
II. DESCRIPTION OF THE SCANNING SQUID                         vertical motion.
MICROSCOPE

   Fig. 1 shows drawings of the scanning SQUID micro-         mented a linear motor driver for the cold head motor
scope mounted in the DR. Computer-aided design draw-          as suggested in Ref.13 . The high-pressure lines connect-
ings of the microscope as shown in (b,c) are available        ing the remote motor head and the compressor are run
at21 . We use a Bluefors BF-LD 400 DR with a base tem-        through thick fiberglass sleeving to reduce the acoustic
perature of 10 mK and 400 µW cooling power at 100 mK.         noise in the lab. The still pump line is passed through a
Cooling to ∼3 K is provided by a Cryomech PT-415 pulse        concrete block between the cryostat and the gas handling
tube cooler implemented with a remote motor option. A         cabinet. The gas handling cabinet and the compressor
superconducting vector magnet from American Magnet-           are in a utility space that is well separated from the lab
ics Inc. can apply 6 T perpendicular to and 1 T in any        space.
in-plane direction of the sample. A few modifications            The microscope consists of a cold finger and the micro-
designed and implemented by Bluefors reduce the vibra-        scope housing. Each is machined from a single block of
tions of the mixing chamber plate. The DR rests on two        copper and bolted together on machined flat, keyed sur-
nested aluminum frames to reduce the mechanical cou-          faces using four brass screws. The cold finger is mounted
pling between the pulse tube cooler and the interior of       to the mixing chamber plate using six brass screws. The
the cryostat. All cold plates, vacuum cans, and the su-       outer diameter of the housing is set by the 68 mm di-
perconducting magnet are supported by the inner frame         ameter bore of the superconducting magnet. The length
while the pulse tube and related components are mounted       of the cold finger is chosen such that the sample is po-
onto the outer frame. The two nested frames are only          sitioned at the center of the magnet. Windows in the
connected via an edge-welded stainless steel bellows to       microscope housing (see Fig. 1b) can be opened by re-
maintain vacuum and via copper braids inside the vac-         moving copper plates to get visual access when aligning
uum chamber to thermally link the cold plates and the         the SQUID to the sample at room temperature.
pulse tube. The top plate of the cryostat is bolted to           All wiring runs along the cold finger and enters the mi-
heavy metal plates (approx. 400 kg). These metal plates       croscope housing through a box at the bottom of the cold
rest on air springs mounted to the inner frame. The re-       finger. This box has two removable plates, which allows
mote motor head of the pulse tube, which is a source          us to include and change desired wiring feedthroughs. A
of vibrations, is housed in a sound isolation box that is     light tight gold plated copper can (not shown) is bolted
mounted on the outer frame and connected to the pulse         below the wiring feedthrough box on the cold finger.
tube by high- and low-pressure flexible lines. We imple-      This design allows to in principle route fully filtered and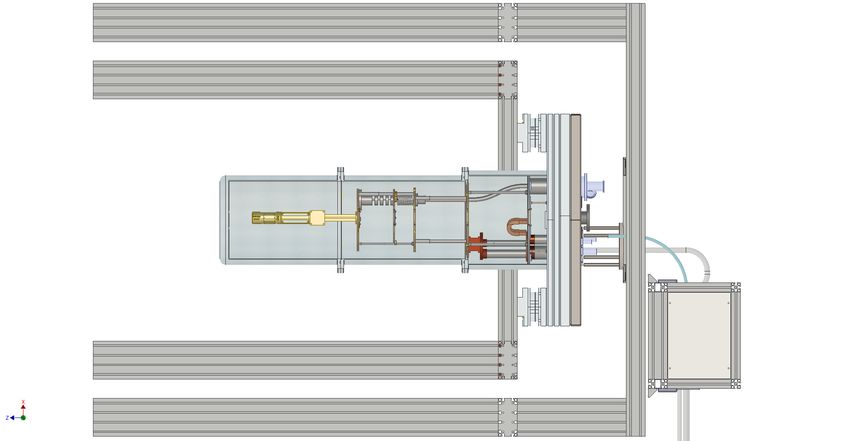
3
shielded wiring to the microscope. All machined parts 150 mФ0
are gold-plated.
(a) (b)
The SQUID is mounted on a home-built piezoelectric
scanner similar to the ones described in Refs.15,16 , which 1 2
in turn is mounted on a three-axis stack of attocube
coarse positioners (see Fig. 1c). We chose bearing-based
attocube ANPx311 positioners with 6 mm coarse range.
Two machined brackets adapt a high-load ANPx311 po- 4 3
sitioner to act as a z positioner. The attocube positioners
are made of grade 2 (99% pure) titanium. The scanner
is assembled from piezoelectric bimorphs and machined
Macor parts22,23 . Two pairs of “s-benders” move the (c) (d)
SQUID in a horizontal plane, while an additional can-
tilever piezo allows for vertical motion. Imaging range
and stiffness compete in the scanner design, since both
depend on the dimensions of the benders. Here we chose
x, y s-benders with lateral dimensions 38.1 × 6.4 mm and
0.13 mm thickness. The z bender has 25.4 × 6.35 mm
lateral dimensions and is 0.19 mm thick. The benders
are joined by Macor blocks using EPO-TEK H70e epoxy.
The scanner is attached to a top Macor plate visible in -190 Ф0/A -190 -60 Ф0/A 0
Fig. 1. This plate is mounted with spring-loaded screws
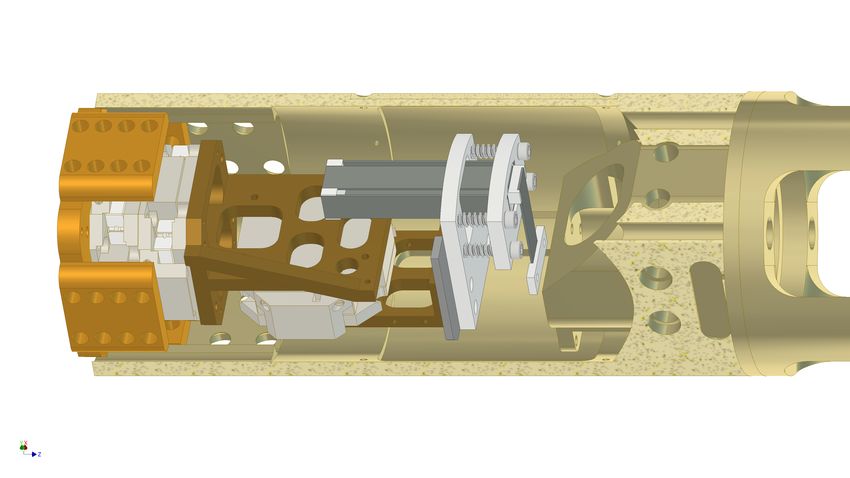
to a bottom Macor plate, which in turn is rigidly mounted FIG. 2. Scanning SQUID images of a superconducting
on the coarse positioners. This arrangement allows us CeIrIn5 microstructure fabricated using a focused ion beam.
to adjust the alignment angles between the SQUID and (a) Scanning electron microscope (SEM) image of the de-
the sample through adjusting the spring-loaded screws. vice with contacts 1-4. (b) Image of the stray magnetic field
Our scan range at cryogenic temperatures is approxi- above the device. The image shows a combination of Meissner
mately 150 µm in the x, y-directions and 110 µm in the screening (red) of a small background field and and vortices
z-direction. The scanner and attocube stack are mounted (blue) in the device. (c) Image of the magnetic field pro-
duced by a total current of ∼ 56 uA flowing from contact 1 to
on a copper puck that slides out at the bottom of the mi-
3. (d) Image of the magnetic susceptibility. Bright regions are
croscope housing allowing for easy SQUID replacement. strongly diamagnetic and therefore superconducting, whereas
The copper puck is threaded and bolted on two adjacent dark regions are non-superconducting. Images were acquired
sides to the microscope housing with four brass screws simultaneously at 225 mK. All scale bars are 25 µm. Part of
on each side. To detect when the SQUID touches down this data was published in Ref.24 .
on the sample, the SQUID is mounted on a flexible brass
cantilever. We monitor the capacitance between this can-
tilever and a ground plane on the printed circuit board. used to operate the piezo scanner, the attocube coarse
At touchdown, a sharp increase in the capacitance is de- positioners and the SQUID. One bundle is available for
tected. These cantilevers are typically 5 mm long, 2 mm sample connections. In addition, the cryostat includes
wide and 50 µm thick. rigid and semi-rigid coaxial wiring to the mixing chamber
The sample is mounted upside-down on a puck that plate. The combination of 24 wires available to connect
slides into the top of the microscope housing to allow to the sample and large coarse positioning range allows us
easy sample replacement and is fastened using four brass to image devices with several contacts and electrostatic
screws. A ruthenium oxide thermometer is mounted on gates, perform full transport characterization of these de-
the sample puck. The base temperature on the mixing vices, and image multiple devices in a single cooldown.
chamber plate is ∼10 mK. The sample mount reaches
50 mK at the same time as the mixing chamber plate Fig. 2 shows an example of measurements on a CeIrIn5
and continues to cool as the mixing chamber plate cools microstructure studied in Ref.24 taken with the scanning
further. The sample mount thermometer is calibrated SQUID microscope described here. We used a SQUID
to 50 mK, but based on the continued change in its re- with a ∼1.5 µm sensitive area (pickup loop) and a ∼6 µm
sistance, we estimate that the sample mount cools to at on-chip field coil which enables local magnetic suscepti-
least 30 mK and likely lower. Importantly, no appreciable bility measurements. Applying a current to the field coil
heating is observed during scanning at a rate of ∼20 µm/s applies a small magnetic field to the sample. The SQUID
even at base temperature. has a gradiometric design, such that the current in the
Three wire bundles with 12 twisted pairs are connected field coil only couples a minimal amount of flux directly
to the microscope (two bundles with 36 AWG phosphor into the SQUID25 . This amount can be calibrated with
bronze, one bundle with 36 AWG Cu and NbTi/CuN the SQUID retracted from the sample. A finite magnetic
wires for low resistance connections). Two of these are response by the sample to the field applied with the field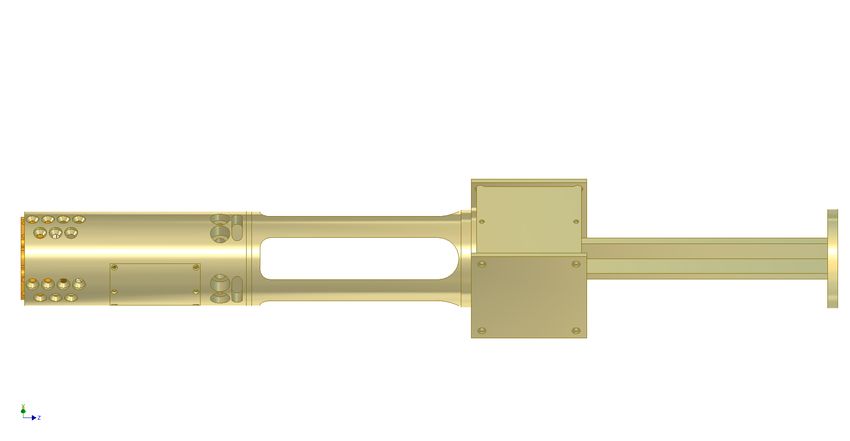
4

(a)                               (b)                    10              background field and vortices in the structure. The cur-
                        60                                               rent was applied from contact 1 to contact 3. The local

                                                          m 0/ m
                                                                         magnetic susceptibility shows a strong diamagnetic re-
                                                         0

                             0
                        40                                               sponse above the superconducting structure. All images

                            m
                                                                         shown in Figs. 2 (b-d) were acquired simultaneously.
                        20
5 m                                                       10
(c)                     10        (d)                    15              III. CHARACTERIZATION OF RELATIVE MOTION
                                                                         BETWEEN SQUID AND SAMPLE
                         m 0/ m

                                                          m 0/ m
                        0                                0                  The pulse tube causes vibrations in the cryostat. These
                                                                         only affect the imaging if they cause a relative motion
                                                                         between the SQUID and sample. We characterize this
                                                             15          relative motion by following a method reported in Ref.26
                            10                                           based on analyzing the excess flux noise caused by vibra-
                                                                         tions in areas with large magnetic field gradients.
FIG. 3. (a) Image of a superconducting vortex in a FIB de-                  Fig. 3(a) shows a vortex in a microstructure fabricated
fined microstructure. ((b-d) Flux gradients in the (b) x, (c)
                                                                         from Sr2 RuO4 . The corresponding magnetic flux gradi-
y, and (d) z directions. The x and y gradients are obtained
from numerically differentiating (a), whereas the z gradient is          ents in the (x, y) direction (Figs. 3(b,c)) are obtained by
obtained from measurements taken at two heights separated                numerically differentiating Fig. 3(a). To obtain the flux
by ∆z = 0.6 µm.                                                          gradient in the z direction (Fig. 3(d)) we took a second
                                                                         measurement at ∆z = 0.6 µm higher than Fig. 3(a). Rel-
                                                                         ative motion between the SQUID and the sample causes
coil modifies the flux in the SQUID by an amount that                    noise in the measured flux signal that depends on the
is proportional to magnetic susceptibility of the sample.                strength and direction of the gradient and the magni-
The device was fabricated from a bulk single crystal of                  tude and direction of the motion. The intrinsic flux
CeIrIn5 using a focused ion beam (FIB). A lamella is cut                 noise of the SQUID
                                                                                        √       has a white noise floor on the or-
out from the crystal (outline of the lamella is shown in                 der of 1 µΦ0 / Hz and a 1/f tail below 100 Hz. Given
Fig. 2(a) as white dashed line), placed on a substrate,                  the magnitude of the flux gradients√      of approximately
and contacted with a gold layer. The gold is removed in                  10 µΦ0 /µm, flux noise of 1 µΦ0 / √  Hz corresponds to an
the active area of the device, and four electrical contacts              approximate sensitivity of 0.1 nm/ Hz for detecting rel-
are separated by cutting trenches (black in the image) us-               ative motion between the SQUID and the sample. Each
ing a FIB again (see Ref.24 for details). The images were                pixel in Fig. 3(a) is the average of a four-second time
taken at 225 mK at which all parts of the CeIrIn5 struc-                 trace. The Fourier transforms of each time trace provide
ture were superconducting. The images shown in Figs. 2                   a position-dependent flux noise spectral density. Exam-
(b-d) showcase different imaging modes: imaging static                   ples of spatial maps of the noise spectral density at a few
stray magnetic fields (Fig. 2 (b)), imaging the magnetic                 frequencies are shown in the left panels of Fig. 4.
field produced by an AC current applied to the device                       To find the power spectral density of the vibrations, we
(Fig. 2 (c)), and imaging the local magnetic susceptibil-                model the flux power spectral density at each pixel (i, j)
ity (Fig. 2 (c)). The static magnetic image ((Fig. 2 (b))                and frequency f as a sum of vibration-induced noise and
shows a combination of Meissner screening of a small                     intrinsic SQUID and electrical noise16 :

                                                                                         !2
                            h      i2         ∂Φ              ∂Φ                 ∂Φ                         2
                             Φ̂(f ) =                X̂(f ) +          Ŷ (f ) +          Ẑ(f )    + N̂ (f ) .                 (1)
                                  ij          ∂x   ij         ∂y     ij          ∂z   ij

Here, Φ̂(f ) denotes the flux noise amplitude spectral den-              bootstrapping with 200 trials to avoid local optima and
sity, ∂Φ/∂(x, y, z) are the flux gradients shown in Fig. 3,              determine the 95% confidence intervals of the fits27 .
X̂(f ), Ŷ (f ), Ẑ(f ) are the vibrations along the (x, y, z) di-          In the right panels of Fig. 4(a-d) we show exam-
rection, and N̂ (f ) models intrinsic SQUID noise and is                 ples of fits to the maps of flux noise spectral den-
strictly positive. We fit the spatial map of the noise to                sity. Figs. 4(b,c,d) closely resemble the gradients in
Eqn. (1) to obtain the spatial vibrations X̂, Ŷ , Ẑ and                the (y, z, x) directions respectively as shown in Fig. 3.
electrical noise N̂ at each frequency. We use statistical                This suggests that the vibrations at these frequencies are
                                                                         mostly in a single Cartesian direction. Fig. 4(a) shows
5
(a) (b) based on a dataset in which these vibrations are particu-
larly pronounced. The integrated in-plane (out-of-plane)
vibrations are 31 nm (27 nm) from 0.25 Hz to 450 Hz com-
pared to 106 nm (39 nm) from 0.25 Hz to 1000 Hz. With
8.50 Hz 5 m 241.00 Hz the air springs turned off, we observed integrated in-plane
(out-of-plane) vibrations of 90 nm (32 nm) from 0.25 Hz
0.0 0.03 0.06 0.0 0.1 0.2 to 450 Hz.
m 0/ Hz m 0/ Hz We did not observe a noticeable difference between the
vibrations with and without the circulation of the mix-
(c) (d) ture running. We have recorded motion of the mixing
chamber plate along the vertical direction using a geo-
phone, since we cannot measure the sample-to-SQUID
vibrations with the pulse tube turned off. With the vac-
316.00 Hz 480.00 Hz uum cans closed and the fridge at room temperature, no
noticeable motion is detected with the pulse tube turned
0.0 0.2 0.4 0.0 0.2 0.4 0.6 off, however with the pulse tube turned on, some mo-
tion is clearly present at higher frequencies. However the
m 0/ Hz m 0/ Hz amplitudes and exact positions of peaks are not strongly
correlated with the peaks visible in Fig. 5. We specu-
late that the motion we observe above 200 Hz has contri-
FIG. 4. Spatial maps of the flux noise spectral density (left butions from the pulse tube and that resonances in the
panel) at the indicated frequencies and corresponding fits to microscope shape the spectrum we observe, but that an
the model in Eq. 1 (right panel). additional source of vibrations is intermittently present
in the lab.
an example of motion along both the x and y direction.
Fig. 5 shows the vibration spectral densities for in- IV. CONCLUSIONS
plane and out-of-plane directions obtained by fitting at
each frequency. Error bars estimated from the 95% √ con- We demonstrate the operation of a scanning SQUID
fidence intervals of the fits are less than 1 nm/ Hz at microscope with several imaging modes in a cryogen-free
all frequencies and omitted to improve readability. Sys- DR. We avoid the use of a spring stage and designed
tematic uncertainty comes from uncertainty in the con- a rigid microscope housing to optimize for thermal an-
version of voltage applied to the piezoelectric scanners to choring of the sample. Our microscope allows for a large
the induced displacement in µm. This conversion is only number of wires and coaxial connections and fits in the
used in the final step of the analysis, since all measure- bore of a superconducting magnet. The temperature of
ments, fits and computations are carried out in terms of the sample stage reaches at least 30 mK and does not
voltages applied to the piezoelectric scanners. We de- increase significantly during scanning. In Ref.16 the au-
termine the conversion factors for motion in x and y thors report the relative sensor-to-sample vibrations in
as 175±10 nm/V from imaging lithographically-defined a cryogen-free Bluefors cryostat with a 2.8 K base tem-
samples with known dimensions and features. To obtain perature with and without using a spring stage. Our
the conversion factor for vertical motion we analyze a se- performance falls in between these two benchmarks. We
ries of images of a vortex taken at different heights. Using believe that this is achieved due to a combination of a
the known height dependence of the magnetic field profile more rigid construction of the microscope and lower vi-
of the vortex, we estimate the conversion to be 149 ± 6 brations in the cryostat itself. In the future, we hope to
nm/V. further reduce the vibrations through a combination of
Pressurizing the room-temperature air springs that optimizing the coarse and fine positioning assembly for
float the top plate of the cryostat has the most no- stiffness, the thermal braids that connect the pulse tube
table impact on the sample-to-SQUID vibrations. The and cold plates, and the connection between the motor
air springs significantly suppress vibrations below 200 Hz. valve and the cold head. We plan to use this micro-
However, we find a surprising amount of motion in a fre- scope to study novel superconductors, topological phases
quency band between 450 Hz and 490 Hz. The amplitude of matter, and frustrated magnetic systems down to mil-
of the vibrations in this range vary significantly in ampli- likelvin temperatures.
tude over long time scales. However, we could not corre-
late their behavior with any changes in the cryostat or the
lab environment. From the structure of the noise spec- V. ACKNOWLEDGEMENTS
tral density maps, we can determine that the most pro-
nounced peak at ∼ 480 Hz corresponds to motion along We thank Eric Smith, Jihoon Kim and Kevin Nan-
the x-direction (see for example Fig. 4(d)). Fig. 5 is goi for help with the construction of the microscope,6
in-plane 63 nm/ Hz
20 out-of-plane
nm/ Hz
10
0
100 101 102 103
Frequency (Hz)
FIG. 5. Vibration spectral densities for in-plane (blue) and out-of-plane (orange) relative motion of the SQUID and sample.
3 4
Measurements were taken with the air spring pressurized√ and the mixing chamber temperature at 80 mK with √ the He/ He
mixture circulating. The vertical axis ranges to 25 nm/ Hz cutting off the highest peak that reaches 63 nm/ Hz at ∼ 480 Hz
in the in-plane vibration spectrum.
Bluefors for technical support and discussions, and Eric G. Pfanzelt, R. Jany, C. Richter, H. Y. Hwang, J. Mannhart, and
D. Bauer, Filip Ronning, Naoki Kikugawa, Andrew P. K. A. Moler, “Locally enhanced conductivity due to the tetrag-
Mackenzie for growing and providing the crystals for onal domain structure in LaAlO3 /SrTiO3 heterointerfaces,” Na-
ture Materials 12, 1091–1095 (2013).
the microstructures. This work was supported by the 6 X. R. Wang, C. J. Li, W. M. Lu, T. R. Paudel, D. P. Leusink,
U.S. Department of Energy, Office of Basic Energy Sci- M. Hoek, N. Poccia, A. Vailionis, T. Venkatesan, J. M. D. Coey,
ences, Division of Materials Sciences and Engineering, E. Y. Tsymbal, Ariando, and H. Hilgenkamp, “Imaging and
under award DE-SC0015947 (scanning SQUID imaging, control of ferromagnetism in LaMnO3/SrTiO3 heterostructures,”
Science 349, 716–719 (2015).
implementation of millikelvin microscope) and the Cor- 7 J. R. Kirtley, C. C. Tsuei, Ariando, C. J. M. Verwijs, S. Harkema,
nell Center of Materials Research with funding from and H. Hilgenkamp, “Angle-resolved phase-sensitive determina-
the NSF MRSEC program under award DMR-1719875 tion of the in-plane gap symmetry in YBa2 Cu3 O7−δ ,” Nature
(SQUID and microscope design). Fabrication of the mi- Physics 2, 190–194 (2006).
8 N. C. Koshnick, H. Bluhm, M. E. Huber, and K. A. Moler, “Fluc-
crostructures was supported by the Max Planck Soci-
tuation Superconductivity in Mesoscopic Aluminum Rings,” Sci-
ety and by the Deutsche Forschungsgemeinschaft (DFG, ence 318, 1440–1443 (2007).
German Research Foundation) – MO 3077/1-1 and the 9 S. M. Frolov, M. J. A. Stoutimore, T. A. Crane, D. J. Van Har-
European Research Council (ERC) under the European lingen, V. A. Oboznov, V. V. Ryazanov, A. Ruosi, C. Granata,
Union’s Horizon 2020 research and innovation program and M. Russo, “Imaging spontaneous currents in superconduct-
(GA 715730). ing arrays of π-junctions,” Nature Physics 4, 32–36 (2008).
10 H. Bluhm, N. C. Koshnick, J. A. Bert, M. E. Huber, and K. A.
Moler, “Persistent Currents in Normal Metal Rings,” Physical
Review Letters 102, 136802 (2009).
11 I. Sochnikov, A. J. Bestwick, J. R. Williams, T. M. Lippman, I. R.
VI. DATA AVAILABILITY
Fisher, D. Goldhaber-Gordon, J. R. Kirtley, and K. A. Moler,
“Direct measurement of current-phase relations in superconduc-
The data that support the findings of this study are tor/ topological insulator/ superconductor junctions.” Nano let-
available from the corresponding author upon reasonable ters , 149–150 (2013).
12 E. M. Spanton, M. Deng, S. Vaitiekenas, P. Krogstrup, J. Nygård,
request. The drawings of the microscope are available
at21 . C. M. Marcus, and K. A. Moler, “Current-phase relations of few-
mode InAs nanowire Josephson junctions,” Nature Physics 13,
1 J. 1177–1181 (2017).
R. Kirtley, “Fundamental studies of superconductors using 13 M. Pelliccione, A. Sciambi, J. Bartel, A. J. Keller, and
scanning magnetic imaging,” Reports on Progress in Physics 73,
D. Goldhaber-Gordon, “Design of a scanning gate microscope
126501 (2010).
2 K. C. Nowack, E. M. Spanton, M. Baenninger, M. König, J. R. for mesoscopic electron systems in a cryogen-free dilution re-
frigerator,” Review of Scientific Instruments 84, 033703 (2013),
Kirtley, B. Kalisky, C. Ames, P. Leubner, C. Brüne, H. Buhmann,
https://doi.org/10.1063/1.4794767.
L. W. Molenkamp, D. Goldhaber-Gordon, and K. A. Moler, 14 A. M. J. den Haan, G. H. C. J. Wijts, F. Galli, O. Usenko, G. J. C.
“Imaging currents in HgTe quantum wells in the quantum spin
van Baarle, D. J. van der Zalm, and T. H. Oosterkamp, “Atomic
Hall regime,” Nature Materials 12, 787–791 (2013).
3 E. M. Spanton, K. C. Nowack, L. Du, G. Sullivan, R.-R. Du, and resolution scanning tunneling microscopy in a cryogen free dilu-
tion refrigerator at 15 mk,” Review of Scientific Instruments 85,
K. A. Moler, “Images of Edge Current in InAs/GaSb Quantum
035112 (2014), https://doi.org/10.1063/1.4868684.
Wells,” Physical Review Letters 113, 026804 (2014). 15 Y. Shperber, N. Vardi, E. Persky, S. Wissberg, M. E. Huber,
4 J. A. Bert, B. Kalisky, C. Bell, M. Kim, Y. Hikita, H. Y. Hwang,
and B. Kalisky, “Scanning squid microscopy in a cryogen-free
and K. a. Moler, “Direct imaging of the coexistence of ferromag-
cooler,” Review of Scientific Instruments 90, 053702 (2019),
netism and superconductivity at the LaAlO3 /SrTiO3 interface,”
https://doi.org/10.1063/1.5087060.
Nature Physics 7, 767–771 (2011). 16 L. Bishop-Van Horn, Z. Cui, J. R. Kirtley,
5 B. Kalisky, E. M. Spanton, H. Noad, J. R. Kirtley, K. C. Nowack, and K. A.
Moler, “Cryogen-free variable temperature scanning squid mi-
C. Bell, H. K. Sato, M. Hosoda, Y. Xie, Y. Hikita, C. Woltmann,7 croscope,” Review of Scientific Instruments 90, 063705 (2019), 72, 4153–4158 (2001). https://doi.org/10.1063/1.5085008. 24 M. D. Bachmann, G. M. Ferguson, F. Theuss, T. Meng, 17 M. Hatridge, R. Vijay, D. H. Slichter, J. Clarke, and I. Sid- C. Putzke, T. Helm, K. R. Shirer, Y.-S. Li, K. A. Modic, M. Nick- diqi, “Dispersive magnetometry with a quantum limited squid las, M. König, D. Low, S. Ghosh, A. P. Mackenzie, F. Arnold, parametric amplifier,” Phys. Rev. B 83, 134501 (2011). E. Hassinger, R. D. McDonald, L. E. Winter, E. D. Bauer, 18 F. Foroughi, J.-M. Mol, T. Müller, J. R. Kirtley, K. A. Moler, F. Ronning, B. J. Ramshaw, K. C. Nowack, and P. J. W. Moll, and H. Bluhm, “A micro-squid with dispersive readout for mag- “Spatial control of heavy-fermion superconductivity in CeIrIn 5,” netic scanning microscopy,” Applied Physics Letters 112, 252601 Science 366, 221–226 (2019). (2018), https://doi.org/10.1063/1.5030489. 25 M. E. Huber, N. C. Koshnick, H. Bluhm, L. J. Archuleta, 19 E. M. Levenson-Falk, N. Antler, and I. Siddiqi, “Dispersive T. Azua, P. G. Björnsson, B. W. Gardner, S. T. Halloran, E. A. nanoSQUID magnetometry,” Superconductor Science and Tech- Lucero, and K. A. Moler, “Gradiometric micro-SQUID suscep- nology 29, 113003 (2016). tometer for scanning measurements of mesoscopic samples,” Re- 20 M. Pelliccione, A. Sciambi, J. Bartel, A. J. Keller, and view of Scientific Instruments 79, 053704 (2008). D. Goldhaber-Gordon, “Design of a scanning gate micro- 26 D. Schiessl, J. R. Kirtley, L. Paulius, A. J. Rosenberg, scope for mesoscopic electron systems in a cryogen-free dilu- J. C. Palmstrom, R. R. Ullah, C. M. Holland, Y.-K.-K. tion refrigerator,” Review of Scientific Instruments 84 (2013), Fung, M. B. Ketchen, G. W. Gibson, and K. A. Moler, 10.1063/1.4794767. “Determining the vibrations between sensor and sample in 21 http://nowack.lassp.cornell.edu/publications. squid microscopy,” Applied Physics Letters 109, 232601 (2016), 22 J. Siegel, J. Witt, N. Venturi, and S. Field, “Compact large- https://doi.org/10.1063/1.4971201. range cryogenic scanner,” Review of Scientific Instruments 66, 27 B. Efron and R. Tibshirani, “Bootstrap methods for standard 2520–2523 (1995). errors, confidence intervals, and other measures of statistical ac- 23 P. G. Björnsson, B. W. Gardner, J. R. Kirtley, and K. A. Moler, curacy,” Statist. Sci. 1, 77 (1986). “Scanning superconducting quantum interference device micro- scope in a dilution refrigerator,” Review of Scientific Instruments
You can also read