Measuring the velocity field of a shear-coaxial, cryogenic flame in a high-pressure rocket thrust chamber
←
→
Page content transcription
If your browser does not render page correctly, please read the page content below
Available online at www.sciencedirect.com

                               Proceedings of the Combustion Institute 38 (2021) 3389–3397
                                                                                         www.elsevier.com/locate/proci

    Measuring the velocity field of a shear-coaxial,
cryogenic flame in a high-pressure rocket thrust chamber
                    Min Son a,∗, Wolfgang Armbruster a, Justin S. Hardi a,
                                   Michael Oschwald a,b
                      a DLR Institute of Space Propulsion, Im Langen Grund, 74239 Hardthausen, Germany
 b Institute   of Jet Propulsion and Turbomachinery, RWTH Aachen University, Templergraben 55, 52062 Aachen, Germany
                                     Received 7 November 2019; accepted 19 July 2020
                                            Available online 19 September 2020

Abstract

High-speed imaging was used to visualize one of the transcritical flames in a multi-injector, sub-scale rocket
thrust chamber at pressures up to 80 bar. Image correlation velocimetry (ICV) was applied to the imaging
to obtain quantitative information on the flow field from the shear-coaxial injectors. ICV was used to track
surface irregularities on the liquid oxygen (LOX) jet in imaging filtered to blue wavelengths. By choosing the
interrogation area carefully, only the LOX jet was effectively tracked, excluding the coaxial H2 flow, and the
time-averaged velocity field was reconstructed. Due to the transient nature of the tracked features, which
frequently change shape or disappear, the averaged ICV result underestimates the absolute values of velocity.
Therefore, the averaged values were scaled by the mean of the instantaneous velocity maxima. A second,
reference measurement of LOX jet propagation speed was calculated using dynamic mode decomposition
(DMD). The results were consistent following the aforementioned correction of the ICV values. Comparing
the ICV fields for two different operating conditions showed a marked difference in the axial velocity distri-
bution and lateral expansion of the LOX jet, demonstrating the potential of the method in studying injection
in rocket combustion chambers.
© 2020 The Authors. Published by Elsevier Inc. on behalf of The Combustion Institute.
This is an open access article under the CC BY-NC-ND license
(http://creativecommons.org/licenses/by-nc-nd/4.0/)

Keywords: Liquid rocket engine; Transcritical injection; Flame visualization; Image correlation velocimetry

1. Introduction                                                 or non-reacting fluid dynamic experiments [1]. The
                                                                consequence is that dynamic characteristics of a
   The design of injectors for cryogenic rocket en-             thrust chamber can be poorly predicted, and other
gines is commonly based on empirical rules derived              problems like combustion instabilities are persis-
from full-scale engine performance measurements                 tently faced by developers of new engines, even in
                                                                those using mature injector technology such as the
                                                                classical shear-coaxial type for cryogenic propel-
 ∗   Corresponding author.                                      lant combinations such as LOX/H2 or LOX/CH4 .
     E-mail address: min.son@dlr.de (M. Son).                   Experimentally derived contributions to under-

https://doi.org/10.1016/j.proci.2020.07.076
1540-7489 © 2020 The Authors. Published by Elsevier Inc. on behalf of The Combustion Institute. This is an open access
article under the CC BY-NC-ND license (http://creativecommons.org/licenses/by-nc-nd/4.0/)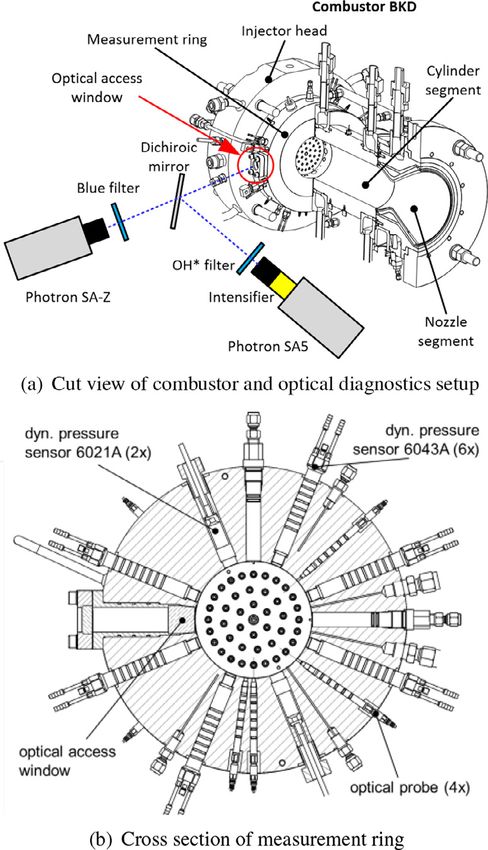
3390 M. Son, W. Armbruster, J.S. Hardi et al. / Proceedings of the Combustion Institute 38 (2021) 3389–3397
standing injection phenomenology or flame dy- In the present study, an image correlation ve-
namics under conditions representative of rocket locimetry (ICV) technique was used to extract the
engines are rare. While contributions from numeri- velocity distribution of the LOX jet from a sub-
cal modelling are continuously improving in fidelity scale LOX/H2 rocket thrust chamber operating up
and accuracy [2,3], CFD methods are yet to reach to 80 bar. Filtered blue radiation imaging from
the status of a definitive design tool. Since exper- the 42-injector combustor by Armbruster et al.
iments under realistic, rocket-like conditions are [18] showed good resolution of periodic modula-
rare, the availability of data suitable for validation tion of the LOX jet, and so they isolated and stud-
purposes is likewise rare. ied it with dynamic mode decomposition (DMD).
Optical diagnostics generate highly valued data In this work, ICV was applied to the same blue radi-
for comparison with numerical results. However, ation imaging to track the periodic features on the
the very high temperatures and pressures in rocket LOX jet.
combustion chambers make their application very In this paper, the application of the ICV method
challenging. Techniques commonly achievable in is described, including a sensitivity study lead-
rocket combustion fields are shadowgraph and fil- ing to optimized parameter selection. A correc-
tered flame radiation imaging. Some early examples tion method is introduced to improve the accuracy
from experiments with shear coaxial injectors and of absolute velocity values, and the corrected val-
LOX/H2 or LOX/CH4 are from Mayer and Tamura ues are validated against a second measurement
[4], Kendrick et al. [5], Juniper et al. [6], and Can- method based on the analysis of DMD modes.
del et al. [7]. They were able to characterize the Then, velocity field results are compared between
LOX jet disintegration, shear layer, and extent of two operating conditions, one with stable combus-
the flame, under pressures reaching into the super- tion, and one with coupled resonance of the com-
critical regime for O2 . bustion chamber and injector acoustic modes.
The application of quantitative techniques is
scarce indeed. Singla et al. applied PLIF to super-
critical [8] and subcritical [9] flames, but faced dif- 2. Experimental setup
ficulties due to the high temperatures and density
gradients in these types of flames. The same prob- The research combustor model ’D’ (abbr.
lem complicates temperature and H2 O concentra- BKD), as shown in Fig. 1a, is a sub-scale thrust
tion measurements with CARS [10,11]. At lower chamber used by Armbruster et al. [18] to study
pressures of around 10 bar, Fdida et al. [12] at- self-excited combustion instabilities with flame vi-
tained velocity field measurements using particle sualization. BKD has 42 shear-coaxial injectors,
tracking velocimetry on LOX droplets in shadow- which have a 3.6 mm LOX post inner diameter
graph imaging of a spray flame. At higher pres- and 0.2 mm post thickness with 2 mm recess, and
sures there are no droplets to track and no method 4.5 mm outer diameter H2 sleeve.
to seed a reacting cryogenic flow with particles for BKD has an instrumented measurement ring
PIV. to obtain optical and acoustical data as shown in
In rocket combustion instability experiments, Fig. 1b. Filtered OH∗ and blue radiation were cap-
the dynamic response of flames to acoustic fields tured through the optical access window by high-
has also been visualized, with some attempts speed cameras with filters; 310 ± 5 nm for OH∗ and
to extract quantitative measurements. For exam- 436 ± 5 nm for blue radiation as shown in Fig. 1a.
ple, Richecoeur et al. [13] reconstructed artificial They were afforded a view of the first 18 mm of
streamlines from a motion tracking method and one of the flames in the outer row of injectors as
showed the flame movement was affected by forced illustrated in Fig. 2. Only the blue imaging was an-
transverse acoustic excitation. Hardi et al. [14] mea- alyzed in this study due to the resolution of the
sured the intact LOX core length relative to the am- LOX jet. It was captured with 60,000 frames per
plitude of forced transverse acoustic resonance at second and the image resolution was approximately
supercritical pressure. Roa and Talley [15] tracked 0.15 mm/pixel. More detail on the optical setup is
local peaks of OH∗ radiation in the shear layer and given by Armbruster et al. [18].
derived the mean velocity of the flame front. Foust Armbruster et al. considered the two operating
et al. [16] used a PIV method with Al2 O3 parti- conditions, or ’load points’ (LPs), given in Table 1.
cles to measure the velocity field of a rocket-like LP1 is the lower chamber pressure (Pcc ) condi-
GH2 /GO2 flame under 1.29 MPa chamber pres- tion and is considered stable because it has only
sure. However, to the authors’ knowledge, there weak coupling between injector resonances and
have been no attempts to measure velocities of the the transverse acoustic mode in the chamber, and
LOX jet. LOX jet dynamics are known to play an correspondingly low unsteady pressure amplitude.
important role in combustion instabilities [17,18], LP2 is a high-pressure LP with stronger resonant
and so a database of velocity measurements would coupling. Both LPs have a similar ratio of oxi-
be of particular value to phenomenological under- dizer to fuel mass flow rate (ROF). As shown in
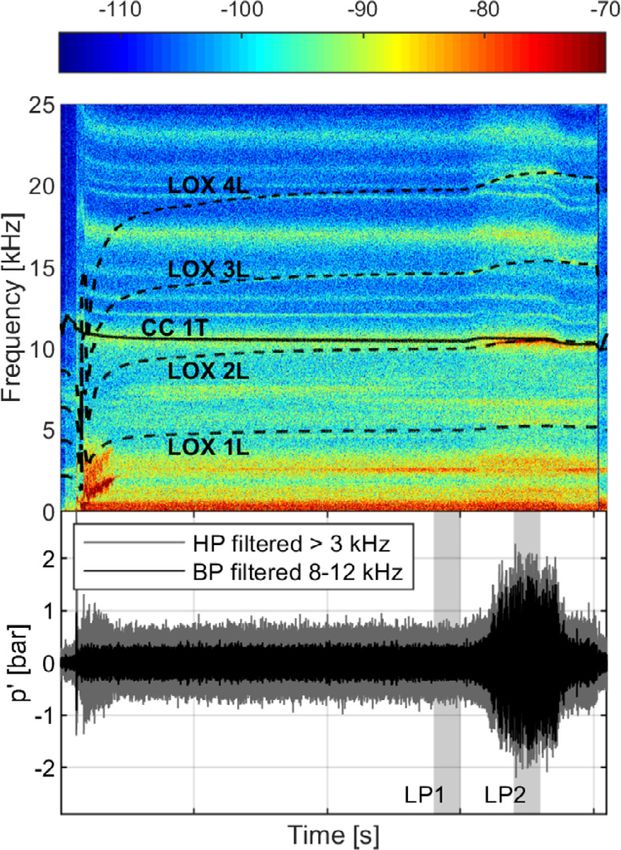
standing and for validating models. the spectrogram in Fig. 3, while the second longi-
tudinal mode of the LOX post (LOX 2L) was de-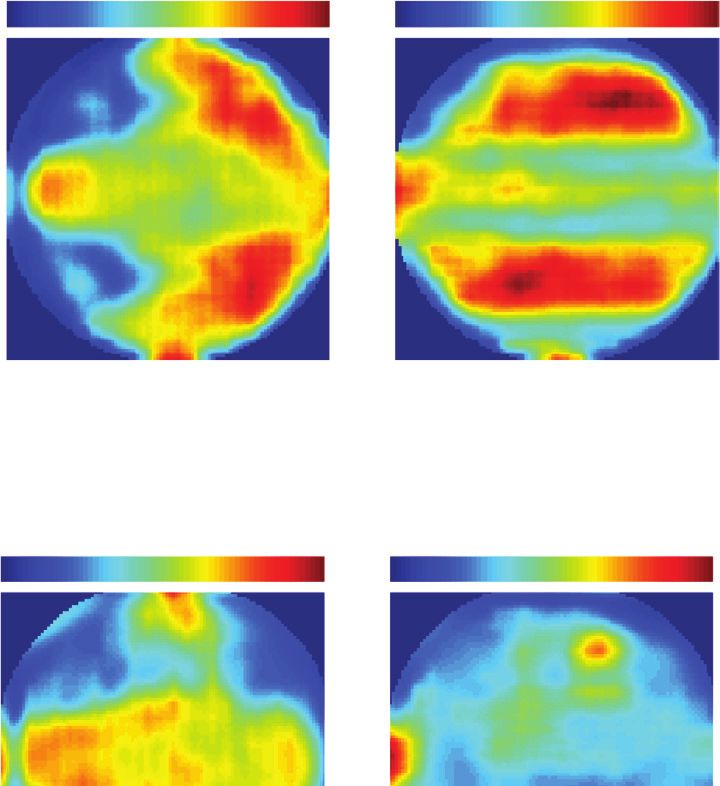
M. Son, W. Armbruster, J.S. Hardi et al. / Proceedings of the Combustion Institute 38 (2021) 3389–3397       3391

                                                                    Fig. 2. Visualized region near injector plate.

  Fig. 1. Research combustor model ’D’ (BKD) [18].

coupled from the first transverse mode of combus-
tion chamber (CC 1T) for LP1, both were coupled
at around 10 kHz for LP2. This coupling raises
the chamber pressure fluctuations (p ) to around
± 2.5% of Pcc , evident in Fig. 3, which is close to
the conventional classification for combustion in-
stability.
    The injection velocity of propellants is usually
estimated simply as the volumetric flow rate di-
vided by the injector area, where the fluid state
                                                              Fig. 3. Spectrogram (upper) and chamber pressure fluc-
                                                              tuation p’ (lower) for two load points [18].

Table 1
Load points and conditions.
                                                              is taken at Pcc and the temperature measured up-
 Load point          LP1                 LP2                  stream in the injector distribution manifold (Tinj ).
 Pcc (bar)           51.8 ± 0.67         81.7 ± 1.06          The LOX injection velocity (u0,LOX ) was around
 ROF                 5.0 ± 0.2           4.9 ± 0.2            10 m/s, while for H2 (u0,H2 ) it was around 400 m/s.
 Tinj,LOX (K)        114 ± 3.43          113 ± 3.38           This results in values of momentum flux ratio (J =
 Tin j,H2 (K)        103 ± 3.08          103 ± 3.10           ρH2 u20,H2 /ρLOX u20,LOX ) for the LPs in the upper end
 u0,LOX (m/s)        7.4 ± 0.22          11.5 ± 0.36
                                                              of the range common for LOX/H2 rocket engines.
 u0,H2 (m/s)         400 ± 17.8          417 ± 18.8
 J                   35 ± 3.4            23 ± 2.3
                                                              The main contributions to measurement uncertain-
                                                              ties are from the mass flow meters with ± 3%, static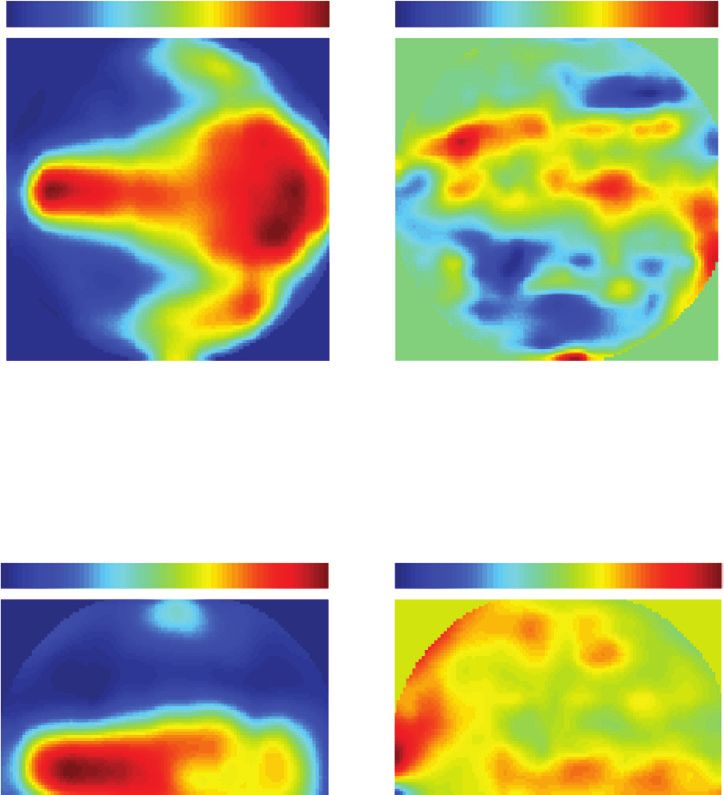
3392    M. Son, W. Armbruster, J.S. Hardi et al. / Proceedings of the Combustion Institute 38 (2021) 3389–3397

pressure sensors with ± 1-1.3%, and ± 2.5-3% for              3.2. Velocity measurement from ICV
thermocouples at cryogenic temperature.
                                                                  Usually, PIV methods are used in combustion
                                                              research to measure flow velocity fields using seed-
                                                              ing particles such as silicon dioxide [20]. However,
                                                              seeding particles do not survive the conditions of
                                                              LOX/H2 combustion under high pressure. Owing
3. Analysis methods and results                               to the low self-absorption characteristic of blue ra-
                                                              diation, the LOX jet structure at the core of the
3.1. Velocity measurement from DMD mode                       flame is revealed by the shadow it casts from block-
                                                              ing illumination from its own far side, and from the
    In previous work, Armbruster et al. [18] iden-            multitude of flames behind it as shown in Fig. 6.
tified and isolated LOX jet dynamics in the blue              Larger accumulations of LOX appear darker and
imaging using DMD. Here, a LOX propagation ve-                their peripheries are well highlighted by the radiat-
locity distribution will be extracted from the DMD            ing mixing layer surrounding them. Thus, the visu-
mode and used as a reference measurement.                     alized jet lumps in the blue radiation images could
    In BKD, the flame is known to oscillate at fre-           be used as tracers.
quencies corresponding to the resonance modes                     In principle, PIV algorithms can track any
of the LOX injection tubes, or LOX posts [17].                movement of structures in an image series based
Armbruster et al. visualized this effect and found            on cross correlation, known as image correlation
that, in the blue imaging, it manifests as a pulsat-          velocimetry (ICV). In this work, ICV was used to
ing LOX injection stream, and that the convection             track LOX jet movement in the blue radiation im-
of periodically injected LOX ’lumps’ with the bulk
of the jet could be described in a strongly coherent
DMD mode.
    The mode capturing the LOX 1L response at
around 5 kHz (indicated in Fig. 3), is shown in
Fig. 4, with a wavy horizontal structure. The prop-
agation of these waves in the reconstructed DMD
mode is taken to represent the bulk convection ve-
locity, filtered at the LOX post resonance frequency.
The distance between intensity peaks, x (right
side of Fig. 4) was measured at regular axial po-
sitions along the centreline and transformed to a
local value of axial velocity (uDMD ) with the known
image size, mode frequency and phase difference.
    The uDMD profile for LP2 is shown in Fig. 5.              Fig. 5. Axial velocity profiles from DMD and ICV (LP2).
It can be considered as a distribution of averaged
axial velocity, since the DMD mode describes the
mean spatial dynamics. The error bars are calcu-
lated assuming that the uncertainty has a rectangu-
lar distribution [19]. The maximum value, uDMD,max ,
was approximately 35.7 ± 2.4 m/s and appeared at
1.15 and 1.54 normalized axial distances from the
injector plate, x/DO , where DO is the LOX post in-
ner diameter.

Fig. 4. Measurement of LOX jet velocity from DMD              Fig. 6. Tracking parcels of LOX jet from blue radiation
mode.                                                         by ICV.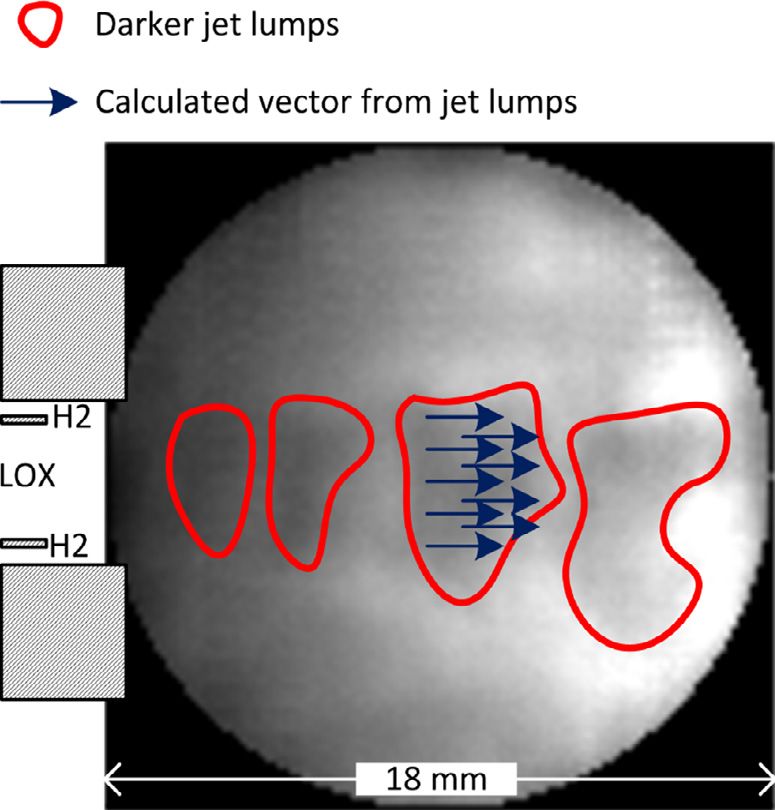
M. Son, W. Armbruster, J.S. Hardi et al. / Proceedings of the Combustion Institute 38 (2021) 3389–3397   3393

ages by cross correlation. The LOX jet itself is
longer than the extent of the optical access. Ac-
cording to measurements by Hardi et al. from an-
other combustor of similar scale and operating
conditions, the intact LOX jet length is inversely
proportional to chamber pressure fluctuations (p )
normalized by Pcc [14]. When p /Pcc is 2.5% for LP2,
the average jet length in BKD is expected to be ap-
proximately 72 mm. This is much longer than the
optical window size of 18 mm, and so it is struc-
tures on the surface of, or shed from, the LOX jet
which can serve as tracers within the window re-
gion.
    With the very high frame rate of 60,000 fps, the
bulky LOX structures survive long enough to be
tracked by ICV with certainty before they deform
beyond recognition or are consumed by the flame.
An impression of the tracers’ form and consistency
can be obtained from the DMD result in Fig. 4.
In the spatial mode, vertical columns of fluctuat-
ing intensity arranged near the centerline are ob-
served. Since LOX lumps appear in the blue image
as darker regions as shown in Fig. 6, their form cor-
responds to regions of negative intensity fluctua-
tion (blue) in the DMD spatial mode. Their promi-
nence in the DMD mode indicates statistical con-
sistency in the behavior of these shapes, and that
                                                                            Fig. 7. ICV results for LP2.
they maintain their form from the injection plane
to around 12 mm downstream, which is around 2/3
of the window size. Based on the DMD velocity,                cle displacement should not exceed 25% of IA [22].
the tracer lifetime can be estimated to be around             Thus if the IAs were chosen between approximately
0.5 ms. With a 0.017-ms delay between frames at               4x4 which is about 4 times larger than the LOX
60 kfps, this lifetime is sufficient for tracers to be        pixel velocity and 32x32 which is less than the H2
tracked for many sequential frames by ICV.                    pixel velocity, the LOX jet could be tracked while
    The algorithm used in this study was proposed             excluding any influence of the faster H2 flow.
by Thielicke and Stamhuis [21], and uses advanced                 While the injected LOX jet is ideally envisaged
discrete Fourier transform to increase the accuracy           as a continuous, smooth jet, the real combustion
of the cross-correlation. Additionally, to improve            field in the experiment is unsteady and turbulent.
the accuracy in non-uniform particle motion, mul-             Therefore, periodic and lumpy structures on the
tiple passes of interrogation areas (IAs) with dif-           LOX jet are visible in the raw imaging, for exam-
ferent sizes are used and the velocity vector is se-          ple in the instantaneous blue radiation image from
quentially corrected for decreasing IAs. A rule to            LP2 in Fig. 7a. The jet is not interrupted, but struc-
ensure vector accuracy is that particle displacement          tures have a somewhat isolated appearance because
between snapshots should be less than one quar-               heightened radiation intensity separates the regions
ter of the smallest IA. A smoothing method and                of accumulated LOX. Regardless, these structures
rejection of erroneous detections were applied af-            could be tracked by ICV, as shown in the instan-
ter constructing the vector fields. Rejected vectors          taneous axial (x-component) velocity field result in
had velocity values exceeding the standard devia-             Fig. 7b. However, due to the lack of a uniform seed-
tion of the mean for the instantaneous vector field           ing field to track and fragmentation of the LOX
by a factor of seven [21], and amounted to less than          jet as shown in Fig. 7a, the resulting velocity field
1% of total vectors. This reduces systematic errors           is modulated by the interruption of tracked struc-
but retains dynamical characteristics interesting for         tures. This is evident in the instantaneous veloc-
future study.                                                 ity profile extracted from the image center line of
    The LOX jet displacement in BKD imaging was               Fig. 7b, ux,c , and plotted in Fig. 5. The error bars
estimated from u0,LOX and the imaging frame rate.             in instantaneous velocity were calculated based on
As shown in Table 1, u0,LOX was around 10 m/s and             the interrogation window settings used for ICV de-
u0,H2 around 400 m/s. These were taken as reference           scribed in Section 3.6. In some regions the values
velocities, and expressed as pixel per frame (px/fr)          agree well with uDMD , while in others there are sud-
values with 1.1 px/fr for LOX and 44.4 px/fr for H2 .         den troughs.
To determine an appropriate size of the search area,              This discontinuous tracking complicates the
IA, Keane and Adrian recommended that a parti-                derivation of a time-averaged field. Time-averaged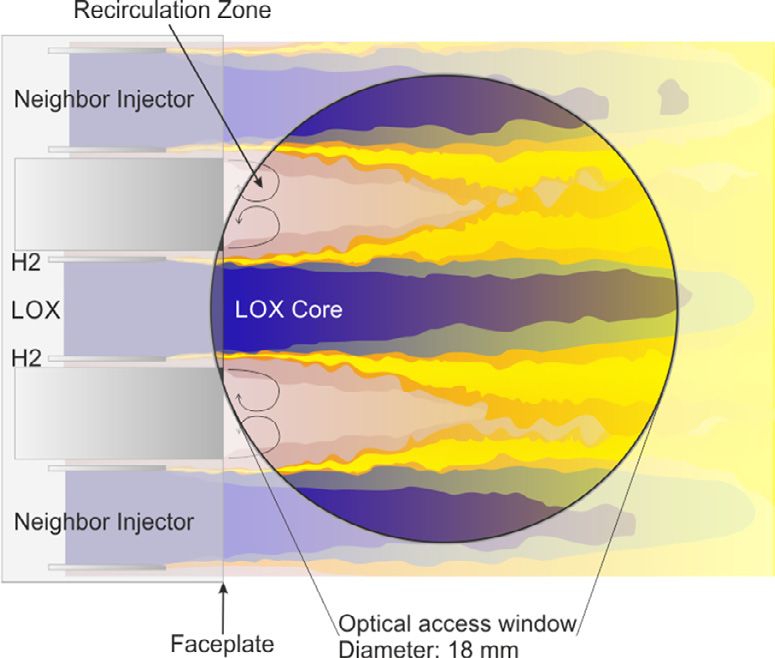
3394     M. Son, W. Armbruster, J.S. Hardi et al. / Proceedings of the Combustion Institute 38 (2021) 3389–3397

                                                               Table 2
                                                               Optimal IA parameter cases.
                                                                   Case         Multi-pass IAs          ue          λIA
                                                                   A            32-16-12                0.314        12
                                                                   B            32-16-12-10             0.326        10
                                                                   C            32-16-12-8              0.336        8
                                                                   D            32-16-12-6              0.374        6
                                                                   E            16-10-4                 0.405        4

       Fig. 8. Sensitivity of results on IA (LP2).

velocity values were around 1/3 lower than in the
instantaneous fields and uDMD , as illustrated by the
center-line profile from the time-averaged field, ux ,c ,
shown in Fig. 5. In the case of LP2, the maxi-
mum velocity in the time-averaged field, ux ,max , was
around 25 m/s, whereas the average of the max-
imum velocity in each instantaneous field, ux,max ,
                                                                           Fig. 9. uc for the optimal cases (LP2).
was around 40 m/s as shown in Fig. 7c. In a later
section, ux,max will be used as the correction fac-
tor to compensate the non-homogeneous tracking
                                                               ICV and DMD points, ue , calculated as
problem.
                                                                                                            2 0.5
                                                                   (uDMD,max − ux,max )2 + uDMD,max − ux ,max         .
3.3. Sensitivity of ICV parameters                                                                                    (1)
    The combination of IA values in the multi-pass                The two objectives for all cases in Fig. 8a were
ICV algorithm was varied to study the sensitivity              plotted in Fig. 8b, and the Pareto optimal front was
of the results on the choice of parameters and to              also derived. In multi-objective problems, multiple
seek an optimum setting. The sizing of IA was var-             optimal cases can exist [23]. In the trade-off prob-
ied between 32 and 4 pixels, with the IA decreasing            lem between the two objectives considered here, five
between passes. The minimum IA of 4 resulted in                optimal cases were obtained as listed in Table 2.
the highest vector field resolution.                              The averaged ICV center-line distributions (ux ,c )
    The difference between ux ,max and ux,max were             for these cases were compared as shown in Fig. 9a.
affected by the IA parameters, as can be seen in               Globally, they lie below uDMD . The profiles of cases
Fig. 8a. Considering the DMD result as the refer-              A, B, and C are most similar to each other and have
ence value, the ICV results closest to the reference           the highest resolution. They also follow the uDMD
were taken to be the best choice of IAs. Hence, a              profile most closely, as shown by the overlay of nor-
multi-objective optimization problem was formu-                malized profiles in Fig. 9b. Of these, case C had
lated with the following two objectives; minimiz-              the lowest mean difference to the DMD profile, and
ing the IA for the last pass, λIA , for best resolution,       also the lowest calculation overhead, and is there-
and minimizing the Euclidean distance between the              fore declared the best choice.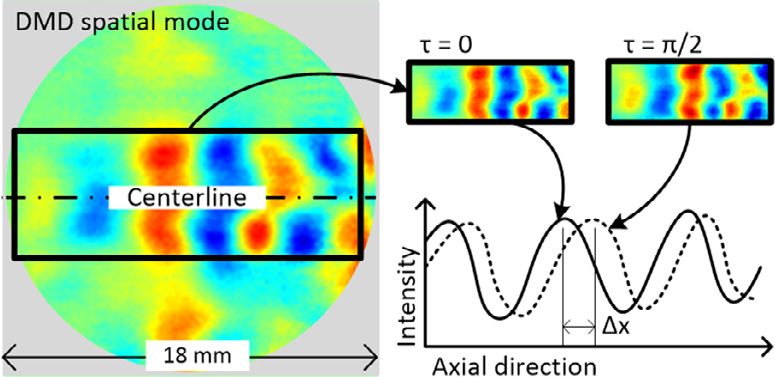
M. Son, W. Armbruster, J.S. Hardi et al. / Proceedings of the Combustion Institute 38 (2021) 3389–3397        3395

                                                                Fig. 11. Uncertainty contours of axial velocity (ux , left)
Fig. 10. Time-averaged contours of axial velocity (ux ,         and radial velocity (ur , right) (m/s) at two different load
left) and radial velocity (ur , right) (m/s) at two different   points.
load points.

3.4. ICV results

     With the optimal choice of IA parameters
from case C, the ICV analysis was performed with
a series of 500 images from LP1 and LP2. The
results are shown as averaged axial (ux ) and radial
(ur ) velocity component distributions in Fig. 10.
For both LPs, the ux distributions are symmetric
about the axis and appear to depict the progression
of the LOX jet, whereas the H2 flow is excluded.
The ur is comparatively small everywhere, meaning
that the axial velocities are strongly dominant for
the LOX jet. Uncertainty value distributions for u                 Fig. 12. Corrected axial velocity at the center line.
were estimated as shown in Fig. 11 by using
u = u ± (tN−1,95% )δ/N 0.5 ,                             (2)
where δ is the standard deviation, N is total number            Therefore, a simple scaling of ux,max /ux ,max was per-
of images, and tN−1,95% is the student-t distribution           formed to correct the absolute values from ICV.
for a 95% confidence interval with N − 1 degrees                The corrected profiles of the LOX jet, uc,cor , are
of freedom. Even though there were strong fluc-                 shown for LP1 and LP2 in Fig. 12. The uncertainty
tuations in the unsteady field, the time-averaged               values for uc,cor were also estimated by Eq. (2) and
fields have less than ± 1.34 m/s uncertainty.                   are presented in Fig. 12 as vertical error bars. After
                                                                the correction, ICV results showed good agreement
3.5. Correction of ICV velocity                                 with DMD results.

    The center-line profile of ux (ux ,c ) for LP2 from         3.6. Discussion of results
Fig. 10b was already depicted in Fig. 5, where it
was seen to lie at much lower absolute values than                 Following correction of the ux values, the
ux,c and uDMD , while following a consistent profile.           results from LP1 and LP2 can now be compared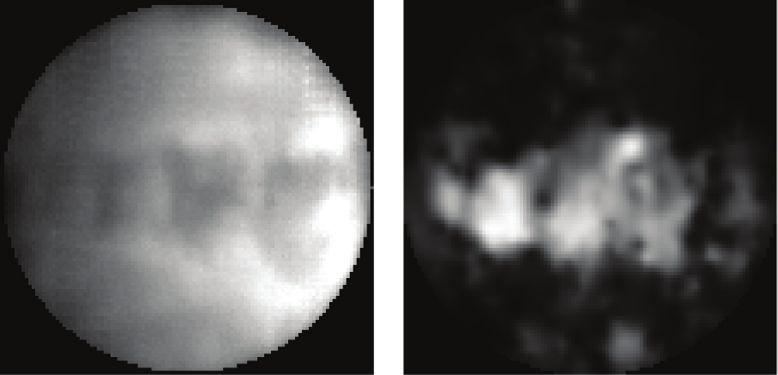
3396    M. Son, W. Armbruster, J.S. Hardi et al. / Proceedings of the Combustion Institute 38 (2021) 3389–3397

and contrasted. It should be noted that velocity                  Since these are the only velocity measurements
field results suffer from some optical distortion             in a transcritical, reacting flow known to the au-
near the window edges. Feature tracking in these              thors, an explanation of these flow field differences
areas is also affected most strongly by the choice of         will be reserved for future work where it is hoped
IA parameters. This is particularly evident in the            that comparison with CFD modeling can inform
variation between optimal case profiles in Fig. 9b            their physical interpretation.
in the region from x/DO = 0.0 to 0.5. In general, the             At this point, the authors can only speculate on
results between roughly 0.8 and 4.5 are considered            the contribution of injection parameters, fluid ther-
to be most reliable.                                          modynamic state, and LOX jet inflow modulation
    The first observation from Fig. 12 is that LP2            on the differences in ICV field structure. However, it
has higher absolute ux values than LP1. This is con-          is promising to see that the ICV analysis produced
sistent with the higher injected mass flow rate for           two markedly different results for the different LPs,
LP2 and the initial estimates of u0,LOX .                     which suggests that the approach can contribute
    The peak values of ux from both the ICV and               valuable information to the study of injection and
DMD methods are about three times greater than                flame dynamics.
u0,LOX , suggesting that the common, simple way to
evaluate u0,LOX significantly underestimates jet ve-
locity values reached in the near injector region.
This should be taken into consideration in low-               4. Conclusion
order modelling or when analyzing LOX jet and
                                                                  In this study, image correlation velocimetry
flame dynamics.
                                                              (ICV) was used to extract quantitative estimates of
    Two main factors are hypothesized to contribute
                                                              the LOX jet velocity distribution in a high-pressure
to this discrepancy. The first is the LOX density.
                                                              LOX/H2 flame in a rocket combustion chamber.
The LOX is in fact in a supercritical state and is
                                                              To the authors’ knowledge, these are the first two-
therefore not an incompressible fluid (Z approx.
                                                              dimensional velocity field measurements from a
0.3). Its temperature at the exit of injector is un-
                                                              shear-coaxial flame at supercritical pressure.
known, and could be raised by heat transfer along
                                                                  The ICV routine was applied to high-speed
the narrow injector flow path. Therefore, the den-
                                                              imaging filtered to blue wavelengths without any
sity at the injection plane could be lower than the
                                                              kind of PIV seeding. The results showed that
usual estimate based on the last point of measure-
                                                              LOX jet surface irregularities could successfully
ment in the upstream manifold. In addition, rapid
                                                              be tracked and used as a measure of jet veloc-
heating of the LOX stream from combustion imme-
                                                              ity. However, time-averaged velocity was underes-
diately after injection can also decrease the density
                                                              timated due to the transient nature of the tracked
in the combustion field. Thus, the factors increas-
                                                              features. Correcting the absolute values with the
ing the LOX density can cause underestimation of
                                                              mean of the instantaneous velocity field maxima
the LOX injection velocity.
                                                              produced results consistent with reference measure-
    The second factor is acceleration of the LOX jet.
                                                              ments produced using dynamic mode decompo-
The surface layers of the jet can be accelerated by
                                                              sition (DMD). Due to the nature of the discon-
the shear flow of the high-speed, coaxial H2 stream,
                                                              tinuous field of the unsteady LOX jet, additional
particularly in the recess region of the injector. Ad-
                                                              correction should be applied comparing the time-
ditionally, the LOX injector of BKD is recessed,
                                                              averaged velocity with the maximum velocity from
and so the expanding H2 flow can pinch the LOX
                                                              instantaneous images. Nevertheless, the ICV can
jet, decreasing its effective injection area and in-
                                                              provide instantaneous and dynamic velocity infor-
creasing the jet speed. A detailed comparison with
                                                              mation, while DMD is temporally filtered. While
CFD simulation could help consolidate the contri-
                                                              a demonstration of this capability is outside the
butions of such effects to the deficiency in u0,LOX
                                                              scope of the current paper, we see great potential
values.
                                                              for its use in the dynamical analysis of imaging
    The uc,cor profiles for LP1 and LP2 in Fig. 12 dif-
                                                              from such challenging experimental conditions.
fer from each other. For LP1, the LOX jet experi-
                                                                  A common, simplified way to estimate the in-
enced slight deceleration up to x/DO around 2.5 and
                                                              jection velocity from rocket injectors is calculated
then acceleration to values higher than at the start.
                                                              from volumetric flow rate and fluid density esti-
In Fig. 10a, the phase of acceleration is accompa-
                                                              mated from an upstream temperature measurement
nied by radial expansion of the LOX jet, to the ex-
                                                              and the downstream combustion chamber pres-
tent that it begins to meet the LOX jets of the neigh-
                                                              sure. The LOX jet velocity measured with the image
boring injection elements by about x/DO = 3.5. On
                                                              processing techniques in this study was higher than
the other hand, the LP2 profile is characterised
                                                              the simple estimate by around a factor of three.
by two plateaus, separated by deceleration around
                                                              While further study is required to explain why, this
x/DO = 2.5. In Fig. 10b, the LOX jet appears to ra-
                                                              is a significant finding which should be considered
dially contract after this point, in contrast to the
                                                              in all design, analysis or modeling activities involv-
LP1 distribution.
                                                              ing an estimate of LOX injection velocity.
M. Son, W. Armbruster, J.S. Hardi et al. / Proceedings of the Combustion Institute 38 (2021) 3389–3397    3397

    The velocity profiles were analyzed from two                [7] S. Candel, M. Juniper, G. Singla, P. Scouflaire,
different operating conditions; one stable at near-                 C. Rolon, Combust. Sci. Technol. 178 (1–3) (2006)
critical combustion chamber pressure, and one with                  161–192, doi:10.1080/00102200500292530.
heightened injection dynamics at supercritical pres-            [8] G. Singla, P. Scouflaire, C. Rolon, S. Candel, Com-
                                                                    bust. Flame 144 (1) (2006) 151–169.
sure. The resulting profiles indicate significantly
                                                                [9] G. Singla, P. Scouflaire, C. Rolon, S. Candel,
different LOX jet structures and acceleration pro-                  L. Vingert, J. Propuls. Power 23 (3) (2007) 593–602.
files between the two conditions. CFD modeling is              [10] F. Grisch, P. Bouchardy, L. Vingert, W. Clauss,
needed to support interpretation of the results, but                M. Oschwald, V.V. Smirnov, Cars measurements at
the fact of the clear contrast in velocity fields is                high pressure in cryogenic lox-gh2 jet flames, in:
promising. It suggests the ICV method can make                      J. Hulka, M. Habiballah, V. Yang, M. Popp (Eds.),
valuable contributions to the further study of flame                Liquid Rocket Thrust Chambers: Aspects of Mod-
dynamics, and to the establishment of an experi-                    eling, Analysis, and Design, Progress in Astronau-
mental database for CFD validation.                                 tics and Aeronautics, 200, AIAA, Washington, DC,
                                                                    2004.
                                                               [11] W. Clauss, C. Manfletti, J. Sender, M. Os-
                                                                    chwald, V. Fabelinsky, V. Smirnov, O. Stel’makh,
Declaration of Competing Interest                                   K. Vereschagin, in: 46th AIAA/ASME/SAE/ASEE
                                                                    Joint Propulsion Conference & Exhibit, AIAA
   The authors declare that they have no known                      2010–7054, DLR, 2010, doi:10.2514/6.2010-7054.
competing financial interests or personal relation-                 AIAA
ships that could have appeared to influence the                [12] N. Fdida, L. Vingert, A. Ristori, Y. Le Sant, Atom.
work reported in this paper.                                        Sprays 26 (5) (2016) 411–438.
                                                               [13] F. Richecoeur, S. Ducruix, P. Scouflaire, S. Candel,
                                                                    Acta Astronaut. 62 (1) (2008) 18–27.
Acknowledgments                                                [14] J.S. Hardi, H.C.G. Martinez, M. Oschwald,
                                                                    B.B. Dally, J. Propuls. Power 30 (2) (2014) 337–349.
                                                               [15] M. Roa, D.G. Talley, J. Propuls. Power 35 (2) (2018)
   Financial support has been provided by the
                                                                    369–381.
German Research Foundation (DFG) in the                        [16] M. Foust, M. Deshpande, S. Pal, T. Ni, C. Merkle,
framework of the SFB TRR40 cooperative re-                          R. Santoro, in: 34th Aerospace Sciences Meeting and
search center. The work is also associated with the                 Exhibit, 1996, p. 646.
French-German Rocket Engine Stability iniTiative               [17] S. Gröning, J.S. Hardi, D. Suslov, M. Oschwald,
(REST). The authors would like to thank the                         Journal of Propulsion and Power (0) (2016) 560–573.
crew of the P8 test facility for test operations as            [18] W. Armbruster, J.S. Hardi, D. Suslov, M. Oschwald,
well as Robert Stützer for setting up the optical                   J. Propuls. Power 35 (3) (2019) 632–644.
diagnostics.                                                   [19] I. BIPM, I. IFCC, I. IUPAC, O. ISO, Citado en las
                                                                    167 (2008).
                                                               [20] C. Willert, M. Jarius, Experiments in fluids 33 (6)
                                                                    (2002) 931–939.
References                                                     [21] W. Thielicke, E. Stamhuis, J. Open Res. Softw. 2 (1)
                                                                    (2014).
 [1] D. Huzel, D. Huang, Modern Engineering For De-            [22] R.D. Keane, R.J. Adrian, Meas. Sci. Technol. 1 (11)
     sign of Liquid-Propellant Rocket Engines, Progress             (1990) 1202.
     in Astronautics and Aeronautics, 147, AIAA, 1992.         [23] M.K. Lotov A.V., in: J. Branke, J. Branke, K. Deb,
 [2] D.T. Banuti, P.C. Ma, J.-P. Hickey, M. Ihme, Com-              K. Miettinen, R. Slowiński (Eds.), Multiobjective
     bust. Flame 196 (2018) 364–376.                                Optimization: Interactive and Evolutionary Ap-
 [3] G. Lacaze, J.C. Oefelein, Combust. Flame 159 (6)               proaches, 5252, Springer Science & Business Media,
     (2012) 2087–2103, doi:10.1016/j.combustflame.2012.             2008, pp. 213–243.
     02.003.
 [4] W. Mayer, H. Tamura, J. Propuls. Power 12 (6) (1996)
     1137–1147.
 [5] D. Kendrick, G. Herding, P. Scouflaire, C. Rolon,
     S. Candel, Combust. Flame 118 (3) (1999) 327–339.
 [6] M. Juniper, A. Tripathi, P. Scouflaire, J.-C. Rolon,
     S. Candel, Proc. Combust. Inst. 28 (1) (2000)
     1103–1109.
You can also read