Development of a Wide Dynamic Range Neutron Flux Measurement Instrument Having Fast Time Response for Fusion Experiments
←
→
Page content transcription
If your browser does not render page correctly, please read the page content below
Plasma and Fusion Research: Regular Articles                                                              Volume 16, 1405018 (2021)

      Development of a Wide Dynamic Range Neutron Flux
  Measurement Instrument Having Fast Time Response for Fusion
                         Experiments
 Daijiro ITO, Hiroyuki YAZAWA, Makoto TOMITAKA, Tsuyoshi KUMAGAI, Shigehiro KONO,
    Michinori YAMAUCHI, Tsuyoshi MISAWA1) , Takashi KOBUCHI2) , Hiroshi HAYASHI2) ,
      Hitoshi MIYAKE2) , Kunihiro OGAWA2,3) , Takeo NISHITANI2) and Mitsutaka ISOBE2,3)
                                Toshiba Energy Systems & Solutions Corporation, Fuchu 183-8511, Japan
       1)
            Institute for Integrated Radiation and Nuclear Science, Kyoto University, Sennan-gun, Osaka 590-0494, Japan
                2)
                   National Institute for Fusion Science, National Institutes of Natural Sciences, Toki 509-5292, Japan
                          3)
                             The Graduate University for Advanced Studies, SOKENDAI, Toki 509-5292, Japan
                                         (Received 7 October 2020 / Accepted 15 December 2020)

            A wide-range neutron flux measurement instrument is developed herein for monitoring the total neutron
       emission rate and yield of the Large Helical Device (LHD) during deuterium experiments implemented from
       March 2017 in the National Institute for Fusion Science (NIFS), Japan. The instrument is designed for and
       installed on the Neutron Flux Monitoring (NFM) system, which measures the counting rate using a 235 U Fission
       Chamber. By combining the pulse counting and Campbell methods, the Digital Signal Processing Unit (DSPU)
       realized a wide dynamic range of over six orders of magnitude from 1 × 10³ counts/s (cps) to 5 × 10⁹ cps. This
       study explains and discusses how the instrument is developed, including topics from the predevelopment activities
       to the verification test at the Kyoto University Critical Assembly (KUCA). Experimental results in the LHD using
       the finished products suggest that the NFM system works well during deuterium experiments.

       c 2021 The Japan Society of Plasma Science and Nuclear Fusion Research
       Keywords: neutron flux measurement, fission chamber, wide dynamic range, fast time response, Campbell
                 method, Kyoto University Critical Assembly, Large Helical Device
       DOI: 10.1585/pfr.16.1405018

1. Introduction                                                            signed for the fusion experiment considering the fast time
     Generally a method using the fission chamber and                      response was easily affected by electromagnetic noises [2].
combining the pulse counting and the Campbell meth-                             The LHD is one of the large experimental devices de-
ods (hereinafter referred to as “Pulse/Campbell method”)                   veloped for research on helical fusion reactors. An impor-
is used to measure neutron flux over a wide range. This                    tant objective of the LHD is to improve the technology of
method has been conventionally applied to in-core nuclear                  high energy ion confinement [3]. Measurement of Sn is in-
reactor instrumentation for nuclear power plants and neu-                  dispensable for this object. For contributing to the success
tron monitoring systems in nuclear facilities [1].                         of LHD experiments, we have applied digital signal pro-
     In fusion experimental facilities, such as the LHD,                   cessing technology and have developed the new instrument
measuring temporal changes in the total neutron emission                   with an improved noise tolerance function.
rate (Sn ) is necessary when studying the physics of plasma
and controlling of fusion power. Particularly, when a wide
range measurement is required, it is appropriate to apply                  2. Requirements and Basic Design
the Pulse/Campbell method.                                                    Policies
     When the Pulse Campbell method is applied to fu-
                                                                                During the deuterium experiment in the LHD, the Sn
sion experiments, fast time responsiveness that is several
                                                                           is an index that provides important information for the
orders of magnitude higher than in-core instrumentation is
                                                                           study of high-energy ion confinement. In this experi-
required. In developing an instrument with fast time re-
                                                                           ment, Sn changes widely and rapidly depending on the
sponses, the following two points should be focused on:
                                                                           plasma heating pattern. The maximum Sn in the experi-
statistical accuracy of measured values and electromag-
                                                                           ment is predicted to be 1.9 × 10¹⁶ neutrons/s upon attain-
netic noise sensitivity. Referring to the experimental re-
                                                                           ing the full power [4]. Moreover, the Sn during the experi-
sults of JT-60 to which an equipment of this measuring
                                                                           ment changes on a fast time scale of approximately several
method was applied, it was found that the equipment de-
                                                                           10 ms [5].
author’s e-mail: daijiro.ito@toshiba.co.jp                                      Therefore, the NFM system must realize high-
                                                                 1405018-1
                                                                                                     c 2021 The Japan Society of Plasma
                                                                                                       Science and Nuclear Fusion Research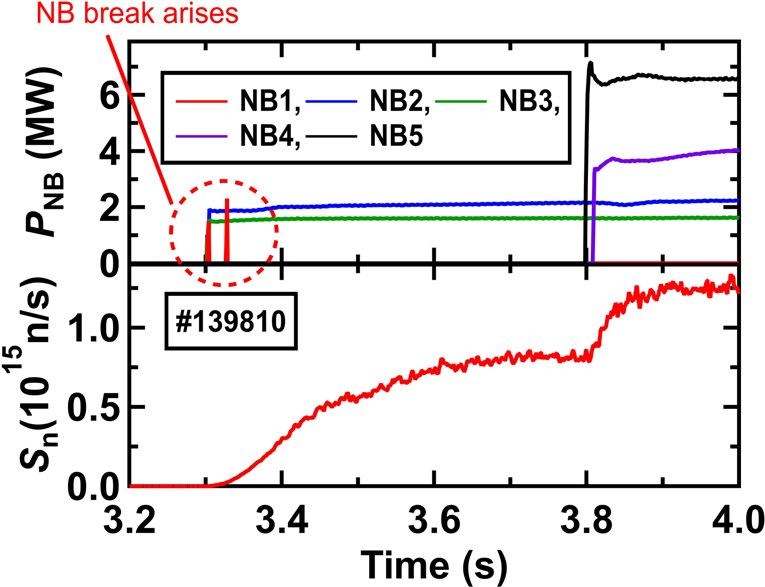
Plasma and Fusion Research: Regular Articles                                                       Volume 16, 1405018 (2021)

                                                                             Table 1 Expected maximum counting rate.

                                                                                Fig. 3 Single channel block diagram.

                                                                   pulse counting, the 109 cps is an extremely high counting
                Fig. 1 NFM system overview.
                                                                   rate and simply counting pulse signals coming from the
                                                                   detector cannot help the measurements owing to pileup. In
                                                                   such a case, the Campbell method, which is based on a
                                                                   simple equation expressed as Eq. (1) [6], should be used.
                                                                   This equation implies that the mean square value (MSV)
                                                                   of signal fluctuation is proportional to the number of neu-
                                                                   trons.
                                                                                              ∞
                                                                          I  − I = N
                                                                            2       2
                                                                                                 [i(t)]2 dt,               (1)
         Fig. 2 Measurement range of each detector.                                           0

                                                                        I  − I : Variance in the current from a source of
                                                                         2       2

                                                                                     random current pulses
precision neutron measurements with a fast time constant
                                                                        N        : Average pulse rate
and wide dynamic range. Figure 1 shows a schematic
                                                                        [i(t)]     : Pulse height
overview of the NFM system. This system comprises sev-
                                                                        t          : Time
eral types of neutron detectors covered with neutron mod-
erators, and each type of detector has a different neutron               However, the Campbell method has a large fluctuation
sensitive material to yield different sensitivities. In the area    at a low count rate and is not suitable for measurements
wherein the emission rate of neutrons is relatively small,         of a low count rate as opposed to pulse counting. Con-
3
  He and 10 B neutron detectors are used in combination            sequently, with the aim of realizing a wide dynamic range,
with counters that have a dynamic range of approximately           the signal of one detector must be processed by a combina-
two orders of magnitude. Furthermore, in other area with           tion of the pulse counting and the Campbell methods. Fig-
a relatively high emission rate, a 235 U fission chamber hav-      ure 3 shows a simple system block diagram for a channel.
ing a neutron sensitivity lower than that of the above detec-      The preamplifier amplifies the detector signal. The Digital
tor is used to realize a comprehensive high-dynamic-range          Signal Processing Unit (DSPU), which has the processing
measurement, as shown in Fig. 2. Primary requirements              circuits for the pulse counting and the Campbell methods,
and basic design policies for the 235 U system are shown in        processes the signal from the preamplifier.
Secs. 2.1-2.3.                                                          Furthermore, as the upper limit of the counting rate
                                                                   that can be actually measured using the pulse counting
2.1    Wide dynamic range                                          method is of the order of 106 cps, it is necessary to mea-
      The maximum neutron flux at the detector position            sure the range of 106 cps to 5 × 10⁹ cps using the Camp-
is estimated as 1010 nv [5]. Moreover, the detector sen-           bell method, as shown in Table 2. Normally, the dynamic
sitivity specification is 0.1 cps/nv [5]. From these val-          range of a single measurement circuit is at the most ap-
ues, the predicted value of the maximum counting rate is           proximately two orders of magnitude owing to constraints
1010 × 0.1 = 109 cps [5] (Table 1). In the case of normal          such as A/D converters and circuit noise. Accordingly, as
                                                            1405018-2
Plasma and Fusion Research: Regular Articles                                                         Volume 16, 1405018 (2021)

                Table 2 Measurement modes.

   Fig. 4 Basic circuit schematic for the Campbell method.
                                                                    Fig. 6 Comparison of the 1st order lag and moving average re-
                                                                           sponse.

                                                                    processor. Then it transforms into a dull waveform that is
                                                                    different from the change in the actual Sn . To avoid this,
                                                                    the signal processing system requires a fast time response
                                                                    of approximately 10 times or more with respect to the time
                                                                    scale in which the signal source to be measured fluctua-
                                                                    tions. Based on this point of view, the NFM system re-
                                                                    quired a time response equivalent to a 1st order lag time
                                                                    constant of 2 ms.
                                                                         In general, in control engineering, an appropriate and
                                                                    simple input is assumed to understand the response char-
                                                                    acteristics of a signal processing process. When consider-
                                                                    ing the response characteristics of a neutron measurement
                                                                    instrument, it is appropriate to consider the response to a
Fig. 5 Total neutron emission rate in the NB-blip experiment.
       Reproduced with permission from K. Tobita et al., Nucl.      ramp-like input in which the signal changes at a constant
       Fusion 34, No. 8, 1097 (1994) [3]. PNB is a short pulse      rate, called ramp response because the temporal change in
       neutral beam injection. Sn is neutron emission rate as a     the signal source itself is slower than the signal processing
       response of the injected beam.                               time scale. The unit ramp response of the first-order lag
                                                                    can be expressed as Eq. (2). Equation (2) shows that when
                                                                    sufficient time has elapsed, a waveform delayed by a time
shown in Fig. 4, the signal is branched into three systems,         constant τ from the input waveform can be obtained as the
and the measurement ranges of the respective systems are            output.
shifted so that a wide measurement range is obtained.                                           t
                                                                            f (t) = t − τ 1 − e− τ ,                          (2)
2.2    Fast time response                                                f (t) : Response of 1st order lag
     The NFM system requires a fast time response to ac-                 τ : Time constant
curately capture the behavior of neutron flux that changes
rapidly and dynamically. One approach to evaluate fast                   Conversely, the delay time of the moving average with
ion confinement in deuterium experiments is to irradiate a          respect to the ramp-shaped input is Tm /2 if the moving av-
pulsed neutral particle beam and then measure the response          erage time is Tm . That is, if the moving average time is set
of the Sn (referred to as “NB-blip”). In this NB-blip exper-        such that Tm /2 = τ, the first-order lag and the moving aver-
iment, the Sn changes on a time scale of approximately              age response can be regarded as equivalent. Therefore, the
several tens of ms. Figure 5 shows an example of a past             signal processing parameter is designed to calculate one
NB-blip experiment performed in JT-60U [3].                         measurement result in every 0.5 ms processing period and
     If the time response of the measurement is not suffi-            output the measurement result averaged over a moving av-
ciently fast for the above time scale, the response of the          erage time of Tm = 4 ms. Figure 6 shows a comparison
measured Sn is affected by the characteristics of the signal         of the first-order lag when τ = 2 ms and the moving aver-
                                                             1405018-3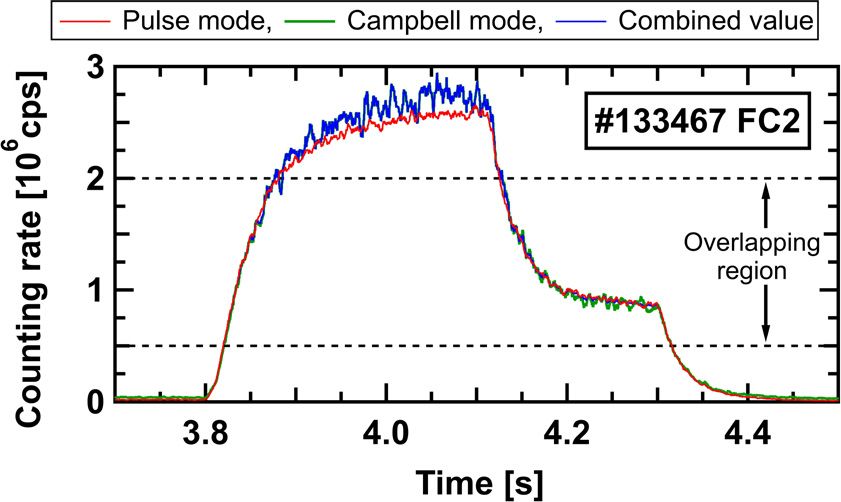
Plasma and Fusion Research: Regular Articles                                                      Volume 16, 1405018 (2021)

                Fig. 7 Preinvestigation setup.

age response when Tm = 4 ms. The moving average is a                       Fig. 8 Noise waveform (preamplifier output).
response equivalent to the first order lag.

2.3    Sufficient noise tolerance
      The plasma experimental device uses many high-
power and control systems in combination for plasma heat-
ing and confinement and is driven using a large amount
of energy. As a result, there are always sources of noise
around the measurement system that often interfere with
the measurement. Therefore, the neutron measurement
equipment requires a noise tolerance function that is suf-
ficiently robust not to cause fluctuations in measured val-
ues owing to noise superposition. In particular, in the case
of an equipment with a high-speed response as described
in Sec. 2.2, a slightly superimposed noise on the measured
value can cause large influence.
      In general, in the development of measurement equip-
ment, it is desirable to investigate in advance what type
of electromagnetic noise is superimposed in the measure-                  Fig. 9 Distribution of PSD of noise waveform.
ment environment prior to starting the design. By conduct-
ing a preliminary survey, it is possible to construct a signal
processing function that meets the requirements of neutron         noise was higher than 10 mV. Thus, the investigation con-
measurement and avoids the electromagnetic noise occur-            firmed that noise was larger than the threshold for pulse
ring in the installation environment.                              signal detection and thus affected the measurement result
      With respect to the NFM system, prior to its develop-        of the count rate obtained through the pulse mode mea-
ment, a noise investigation was conducted. We set a tem-           surement. For example, if an incorrect count was provided
porary measurement system shown in Fig. 7 at the location          10 times before the noise waveform decayed, a count rate
where the permanent equipment was to be installed at, and          of 10/0.5 ms × 1/8 = 2.5 kcps could be instantaneously
we then measured the waveform and frequency spectrum               measured. This effect was not negligible.
of noise caught by the system.                                          Furthermore, the frequency spectrum is as shown in
      From this investigation, it was found that when the          Fig. 9, and the power spectral density (PSD) in the fre-
neutral particle beam (NB) broke down, a single large elec-        quency range from 1 to 10 MHz is relatively large. If
tromagnetic noise occurred. Figure 8 shows an exam-                the filter circuit for measurement in the Campbell mode
ple of actual waveform measured when this electromag-              included this frequency band, the measurement value ob-
netic noise is superimposed on the signal waveform. It             tained using the Campbell mode measurement ought to be
was found that the noise exhibited a shape that lasted for         affected by the noise.
10 µs while swinging between positive and negative polar-               In response to the above mentioned result of the field
ities. This waveform was the output signal of the preampli-        survey, special signal processing methods for suppressing
fier. In this system, the typical amplitude of a pulse wave        the influence of noise were prepared for both the pulse
by ordinary neutron detection was approximately 7.5 mV             counting and Campbell methods.
and the time width was approximately 100 ns, whereas the                One of these special signal processes is to perform a
                                                            1405018-4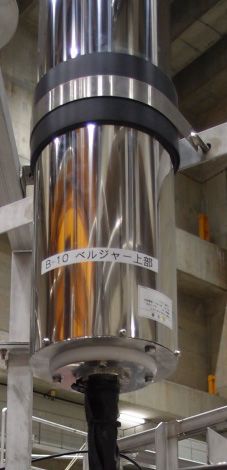
Plasma and Fusion Research: Regular Articles                                                          Volume 16, 1405018 (2021)

   Fig. 10 Schematic diagram of the bipolar discrimination.

                                                                     Fig. 12 Frequency characteristics of the band pass filter for the
                                                                             Campbell method.

                                                                     noise power increased when the frequency exceeded ap-
                                                                     proximately 1 MHz. Therefore, the filter coefficient was
                                                                     designed to create a low-pass filter with a sufficiently large
                                                                     attenuation factor of or greater than 60 dB in the region of
     Fig. 11 Noise tolerance function for pulse counting.            MHz or higher. Furthermore, as a low-frequency signal is
                                                                     necessary to calculate the MSV voltage, a high-order filter
                                                                     is applied to create a steep characteristic. Figure 12 shows
short time counting rate correction for the pulse counting           the frequency characteristics of the designed filter circuit.
method. This method utilizes the fact that the noise is a            Actually, the attenuation factor is 60 dB at approximately
bipolar waveform and that the duration of the noise is ap-           500 kHz.
proximately 10 µs, whereas the normal neutron signal is a
unipolar pulse.
     First, the counting duration for the process to ob-             3. Equipment Design of DSPU
tain one count rate measurement value is 0.5 ms. How-                3.1 Structure
ever, rather than simply continuing counting for 0.5 ms,                  In accordance with the basic development policy for
the count value of a minute time interval which length               a wide dynamic range, fast time response, and noise toler-
is on the order of microseconds is repeatedly measured               ance function as described in Sec. 2, the DSPU was specif-
and the count value of that minute time is integrated until          ically designed. It was designed to be mounted and op-
0.5 ms elapses. Subsequently, as the normal pulse signal             erated in a standard rack; therefore, it was designed as a
is negative and the noise waveform is bipolar, a positive            19-inch rack-mount unit at 4U high. Figure 13 shows the
discrimination circuit for noise detection is provided, as           appearance of the DSPU. Interfaces such as displays and
shown in Fig. 10. When the positive discrimination thresh-           buttons are arranged on the front side and terminals for
old is exceeded, it is determined that noise is superimposed         power supply and signals are arranged on the back side.
on a normal signal. When it is determined, the minute
time count values around the noise, which are potentially            3.2 Signal processing function
affected by the noise, are excluded from the integration                   Figure 14 represents the block diagram showing signal
and replaced with values obtained through linear interpo-            processing of the DSPU. As shown in Sec. 2.1, the DSPU
lation with the preceding and succeeding values, thereby             has the functions of pulse counting and MSV measuring of
suppressing the noise from affecting the count rate. An               neutrons over a wide range. The signal processing circuit
overview of this process is shown in Fig. 11.                        of the DSPU calculates the pulse count rate and the MSV
     Meanwhile, the noise tolerance function for the                 voltage from the input signal, respectively, and obtains the
Campbell method is to create a low-pass filter having                Sn and yield by combining these two results. This signal
a high-order multistage configuration and a steep high-              processing has the operation period shown in Sec. 2.2. The
frequency cutoff characteristic. As shown in Fig. 9, the              DSPU is designed to have fast response. Furthermore, the
                                                              1405018-5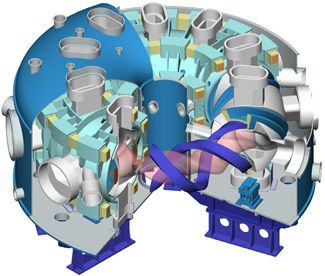
Plasma and Fusion Research: Regular Articles                                                       Volume 16, 1405018 (2021)

DSPU has two functions for noise removal, as described in           being obtained by combining the pulse and the Campbell
Sec. 2.3.                                                           modes, it is referred to when confirming the linearity be-
     The measurement values thus obtained are converted             tween these two modes or when performing the Campbell
into analog signals and digital data, which are outputs to          mode gain calibration. As the Campbell mode value is the
external data acquisition systems. The analog signals are           MSV voltage, comparing it with the pulse mode data and
reference outputs for verifying digital data and are volt-          setting the conversion coefficient to convert the MSV volt-
age signals proportional to the count rates. They comprise          age into the counting rate (cps) is necessary. In addition to
the pulse mode count rates divided into two ranges and              the Sn , the digital data includes the total neutron emission
Campbell mode count rates divided into three ranges, for            yield obtained by summing instantaneous value. This is
a total of five outputs. On the other hand, digital data is         the value to be referred to when making a comparison with
a data packet that contains Sn value obtained by multiply-          a neutron activation foil or the like. Moreover, this value
ing the counting rate by a conversion coefficient, a time             can be reset to zero using the clear button on the DSPU
synchronization flag, and so on. the data is transmitted by         control panel.
the UDP/IP protocol. Owing to the total emission rate                     The other output signal is a pulse output. This is a
                                                                    TTL level logic pulse that is output each time a pulse sig-
                                                                    nal is detected in a pulse mode circuit. The measured value
                                                                    in pulse mode is calculated from the number of pulses
                                                                    counted in a counting time of 0.5 ms (i.e., one pulse in
                                                                    0.5 ms corresponds to 2000 cps); therefore, sufficient sta-
                                                                    tistical accuracy cannot be obtained without above a cer-
                                                                    tain number of pulses. Hence, it is necessary to refer to
                                                                    this pulse output when confirming a low count rate of less
                                                                    than 1 cps to several hundred of cps, for example, when
                                                                    performing sensitivity calibration using a radiation source.

                                                                    4. Verification
                                                                    4.1 Concerns about the measurement char-
                                                                        acteristics
                                                                         In the design of the equipment described in Sec. 3, we
                                                                    focused on the two important characteristics of the measur-
                                                                    ing instrument and considered it during the design phase.
                                                                         The first characteristic is the overlap of the two mea-
                                                                    surement modes. As previously mentioned, DSPU mea-
                                                                    sures the neutron count rate over a wide range using the
                                                                    pulse count method that measures lower count rate and
               Fig. 13 DSPU external form.                          the Campbell method that measures higher count rate to-

                                 Fig. 14 Block diagram of the fission chamber signal processing.

                                                          1405018-6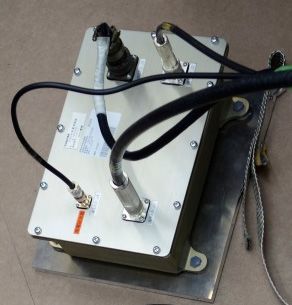
Plasma and Fusion Research: Regular Articles                                                        Volume 16, 1405018 (2021)

gether. As these two are completely different methods,                     In this equation, the first term on the right side is the
as described in Sec. 2.1, there is no guarantee that both           statistical error that depends on the filter circuit. The sec-
measurement ranges will overlap. When the measurement               ond term is the error of Poisson process. From this equa-
ranges do not overlap, there is a problem in that not only          tion, we infer that the shorter the time constant τ, the larger
is there a missing value in the measurement range but also          the first and second terms. Moreover, the higher the filter
the measurement value of the Campbell method cannot be              performance, the narrower the noise bandwidth, and the
calibrated. The relationship between the counting rate and          first term increases. In other words, the statistical error in-
the MSV voltage in the Campbell method is proportional,             creases in both the cases. The DSPU is designed with a
as shown in Eq. (1); however, it is difficult to obtain the           short time constant because high-speed response of mea-
proportional coefficient accurately by analyzing the math-            sured values is required, as described in Sec. 2.2. Further-
ematical expression.                                                more, as mentioned in Sec. 2.3, the cutoff performance of
     Hence, when calibrating DSPU, it is necessary to               the filter is improved. Although this equation relates to the
perform experimental measurement and obtain the in-                 1st order filter, the relationship between the time constant,
put/output characteristics, as shown in Fig. 15. In this in-        filter characteristics, and the statistical error is considered
put/output characteristic, it is necessary to determine a lo-       to be similar regardless of the order. In other words, the
cation wherein the regions where the pulse counting and             DSPU signal processing parameter settings may be set in a
Campbell methods respond linearly overlap and to deter-             manner such that the statistical error increases. Therefore,
mine the conversion coefficient of the Campbell method so             it is necessary to ensure that the statistical error does not
that the slopes are equal. By determining this conversion           increase drastically.
factor, DSPU can be used as a wide-range-measuring de-
vice.                                                               4.2 Desktop calculation during the design
     The second characteristic is the statistical error. As             stage
a high-order filter is applied to the measurement circuit of             To confirm the overlap between the two types of mea-
the Campbell method, it is difficult to obtain the fluctuation        surement methods and the statistical error of the Campbell
(statistical error) of the measured value from the character-       method at the design stage and to set the appropriate signal
istics of the bandpass filter.                                      processing, a simulation model was constructed and desk-
     This will be explained by considering the case of              top calculation was performed. The image of this simula-
the 1st order filter as an example. The statistical error           tion is shown in Fig. 16. In this simulation, similar to the
in the case of the 1st order filter can be expressed using          actual measurement, a simulated signal that randomly gen-
Eq. (3) [6].                                                        erates pulse signals is prepared and input to a calculation
                                     12                           model that simulates the DSPU signal processing function.
        σs             1          1                                 The processing of this calculation model is similar to the
             =                 +          ,                 (3)
        s(t)     2πτ( fH + fL ) 2kΦτ                                signal processing circuit inside DSPU based on the input
  σs :      Statistical error                                       signal, and it derives the measurement result measured by
  S (t) :   Signal                                                  DSPU through calculation. The linearity of input/output
  τ :       Time constant (s)                                       characteristics and statistical error are confirmed from the
  fH :      High cut-off frequency (Hz)                              calculation results thus obtained.
  fL :      Low cut-off frequency (Hz)                                    For executing this method, it is necessary to create a
  k :       Counting efficiency (cps/nv)                              simulated signal waveform and a calculation model that re-
  Φ :       Neutron flux (nv)

Fig. 15 Schematic diagram of the characteristics of Pulse count-
        ing and Campbell methods [2].                               Fig. 16 Conceptual diagram of the signal processing simulation.

                                                             1405018-7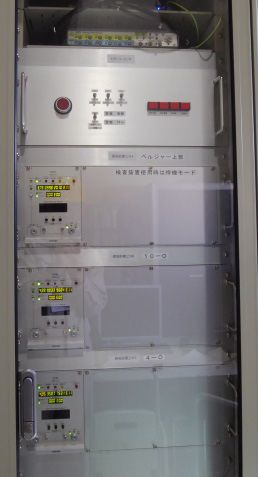
Plasma and Fusion Research: Regular Articles                                                       Volume 16, 1405018 (2021)

                                                                          Fig. 18 Modeling the signal processing circuit.

         Fig. 17 Creating a dummy signal waveform.

semble the actual one. Regarding the creation of the signal
waveform, as shown in Fig. 17, a lot of single-shot pulse
signal waveforms are collected in an experimental system
using a neutron detector and a preamplifier, and it is scat-
tered using a software program at random times. This sim-
ulates an input signal close to the actual one, in which a
pulse signal is randomly generated. Moreover, by chang-
                                                                       Fig. 19 Simulation result of the pulse and MSV modes.
ing the number of pulse signals to be superposed, a signal
having an arbitrary intensity can be simulated. In addition,
in the system of Fig. 17, approximately 40 samples were
measured for a single pulse waveform.
     Regarding the creation of the DSPU calculation
model, a model that expresses the signal processing by
the analog circuit and the digital signal processing of the
FPGA in the code of GNU Octave was built, and it cal-
culates the output value that is close to the actual mea-
surement from the input signal waveform data. For ana-
log circuits, a digital filter code close to it was generated
based on the filter characteristics calculated using SPICE.
For the FPGA, the digital filter and the mean square value
calculation process described in the hardware description
language (HDL) were converted to the equivalent Octave            Fig. 20 Simulation result of the statistical error. Campbell mode
code (Fig. 18).                                                           error is twice the value of the 1st order filter.
     Using the dummy signal created in this manner and
the calculation model, the linearity and statistical error
were calculated on the desk and these results confirmed                Furthermore, the calculation result of the statistical er-
that there was no problem in the circuit design. Figure 19        ror is shown in Fig. 20. The blue solid line shows the cal-
shows the calculation results for the overlap of the two          culated value of the pulse method, and the red solid line
measurement methods. The blue line shows the result of            shows the calculated value of the Campbell method. For
calculating the output value of the pulse counting method,        comparison, the first-order lag response is shown by the
and the red line shows the result of the output value of the      dotted line of the same color. The statistical error of the
Campbell method. It shows that there was sufficient over-           Campbell method was difficult to predict in advance; how-
lap in both measurement ranges.                                   ever, it was found to be approximately 2.5 times worse than
                                                           1405018-8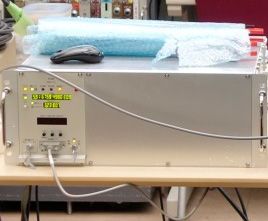
Plasma and Fusion Research: Regular Articles                                                          Volume 16, 1405018 (2021)

                                                                    Fig. 22 Simulation and experimental result of I/O characteris-
                                                                            tics.

            Fig. 21 Experiment system at KUCA.

that of the first-order filter. At this level, there is no prob-
lem observed in measurement.

4.3    Verification experiment at Kyoto Univer-
       sity Critical Assembly
     After manufacturing the DSPU prototype and assess-
ing the basic functions, a verification experiment was con-
ducted to confirm the actual neutron measurement func-
tion at the Kyoto University Critical Assembly (KUCA)
                                                                    Fig. 23 Simulation and experimental results of the statistical er-
experimental facility. Figure 21 shows the experimental                     ror.
system at KUCA. The thermal neutrons generated from
the critical assembly were detected by the FC placed near
the assembly and the detector signal was amplified by the           shown by the black dots in Fig. 23. This is also in good
preamplifier, and then the output signal of the preamplifier        agreement with the simulation. The above-mentioned two
was measured using the DSPU prototype. The DSPU out-                results confirmed that the prototype of the DSPU had suf-
put the measurement data via UDP/IP transmission from               ficient performance as a neutron measuring instrument in
the Ethernet port and the data acquisition device recorded          the actual neutron measurement and the calculation result
this. In parallel with this, data from other detectors (i.e.,       through simulation.
FC and UIC) for the operation control of the KUCA were                   Although not described in herein, the dynamic range
used as references for linearity evaluation.                        of the MSV mode signal processing circuit that covered
     As a result of this experiment, a good overlap be-             four orders of magnitude was verified via a verification test
tween the two measurement methods and the statistical er-           using a function generator. Consequently, it was concluded
ror of the measured values of the Campbell method were              that there were no problems in the amplification character-
obtained. Furthermore, this result agreed with the values           istics of the electrical signal.
simulated in Sec. 4.2. The experimental results regarding
overlap are shown by the black dots in Fig. 22. The hori-
zontal axis of the figure is the count rate of signals input        5. Installation and Operation
to the DSPU. This is obtained by multiplying the count              5.1 Entire data acquisition and monitoring
rate value measured by the reference detector by the ratio              system of the fission chamber
of the count rate of FC to that of the reference detector and            Subsequent to designing the whole measurement sys-
converting it to a value equivalent to the count rate of the        tem for application to the fusion experiment, the produc-
DSPU. As the correlation between FC and the reference               tion version of the DSPU and other equipment were manu-
detector showed a good first-order correlation in the low           factured and installed in the torus hall, basement, and mea-
count rate region of the pulse mode, the above-mentioned            surement room of the LHD. To increase electromagnetic
ratio was determined based on this result.                          noise tolerance, the NFM system took every possible coun-
     Next, the experimental results of statistical error are        termeasure during installation, including full-length cable
                                                             1405018-9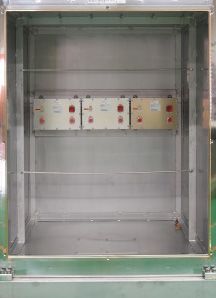
Plasma and Fusion Research: Regular Articles                                                           Volume 16, 1405018 (2021)

                              Fig. 24 Data acquisition and monitoring system of the fission chamber.

                                                                    tion of the DAQ device, respectively. Digital data is re-
                                                                    ceived by a local PC for collection. All collected data
                                                                    are sent to the experiment/analysis database in the control
                                                                    room and are used by each experiment group. An experi-
                                                                    ment start signal transmitted from the control room is used
                                                                    for time coincidence of the data. The experiment start sig-
                                                                    nal sent via the timing demodulator is divided and con-
                                                                    verted to the logic level for the DSPU and is set as a flag to
                                                                    the measured value of the DSPU every 0.5 ms. As the gen-
                                                                    eration time of the experiment start signal is managed as a
                                                                    synchronization signal, the time axis of the measurement
                                                                    data can be determined by reading the flagged data.
                                                                          As a monitoring function, the Sn and total neutron
                                                                    emission yield are monitored. Each DSPU has an alarm
Fig. 25 Photographs of detector and signal processing equip-        assessment function and constantly monitors the rate and
        ment.
                                                                    yield. If an alarm is activated in any one of the three chan-
                                                                    nels, it is immediately transmitted to the control room.
sheath, earthing, noise-cut transformer, ferrite-core, sig-
nal/grounding cable separation from power cable, EMC                5.2 Assessing neutron detection function
gaskets, and panel configuration without penetrative pro-                Subsequent to the installation of the entire system was
jection. Figure 24 shows the data acquisition and monitor-          completed, the soundness of the neutron detection function
ing system configuration for three channels of the FC. In           was confirmed using a neutron source. Specifically, a 252 Cf
addition, photographs of the detector and signal processing         neutron source was placed near the detector and the inte-
equipment are shown in Fig. 25.                                     grated pulse height distribution was measured. The inte-
     The analog output (AO) and the pulse output of the             grated pulse height distribution is a characteristic obtained
DSPU are collected by the analog input and counter func-            by measuring the count rate while stepwise changing the
                                                          1405018-10
Plasma and Fusion Research: Regular Articles Volume 16, 1405018 (2021)
Fig. 27 Example of the time evolution of the count rate when
adjusting the Campbell sensitivity.
Fig. 26 Integral pulse height distribution.
threshold voltage of the pulse mode discriminator. In the
low threshold voltage region, counting by noise is domi-
nant; therefore, it does not serve as information for con-
firming the neutron detection function. However, even in
the high threshold voltage region, if a certain level of count
rate is maintained, it can be said that this system can detect
neutrons. This is attributed to the neutron detection signal
being larger than other signals such as electrical noise and
gamma rays and the signals are counted even if the thresh-
old voltage is high to some extent.
Figure 26 shows the actual measurement results. In
this figure, the values measured without the radiation
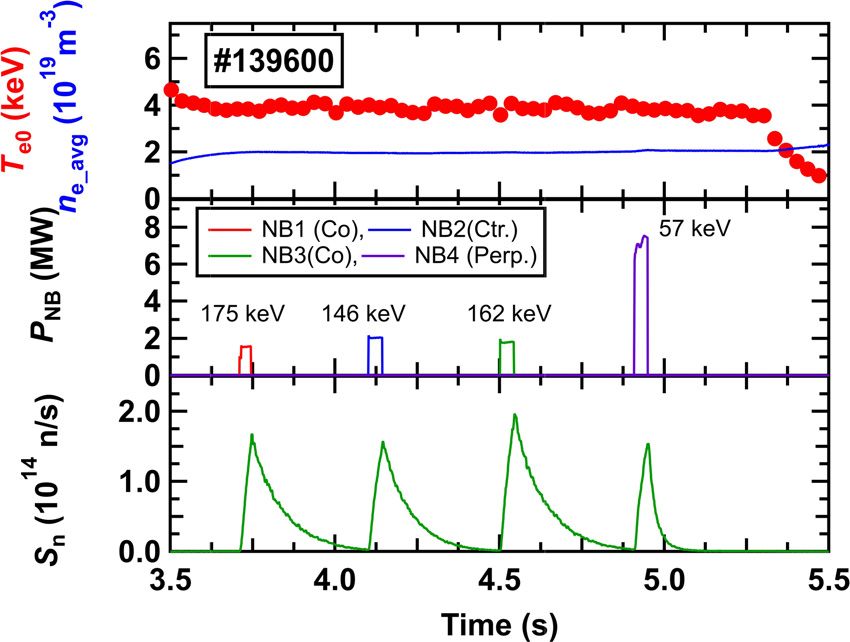
Fig. 28 Example of measurements when an NB-break occurs.
source are indicated by black circles and the measurement There is no influence on the total neutron emission rate
results with the radiation source placed are indicated by (Sn ).
red circles. When the radiation source is placed, counting
by the signal with a large pulse height is clear in the re-
gion where the threshold voltage is approximately 120 mV tween the pulse and MSV, which is attributed to the pulse
or greater. Consequently, there is no problem in the neu- mode losing its linearity owing to saturation.
tron detection function. In this result, although the char- Moreover, in the D-D experiments so far, the Sn is
acteristics of the region where the threshold voltage is low able to be measured without any serious problems even
are slightly different, it is considered that the background when at the occurrence of an NB break. Figure 28 shows
was changed owing to the shield around the detector being an example of this. The upper figure shows the power of
opened because the radiation source was placed near the the NB injector, and the lower figure is a graph showing
detector. the measured Sn . At the point of approximately 3.3 s in
this graph, the NB’s power went down and this implied
5.3 Neutron measurement in D-D experi- that an NB break occurred; however, there was no distur-
ments bance in the measured values that could be influenced by
To calibrate the equipment, the conversion factor of Sn this break. If they were affected by this noise, an unnat-
and counting rate was obtained by in situ calibration exper- ural waveform should appear so that the measured value
iment using a neutron source [7,8]. Further, the calibration suddenly changed.
of the device was completed by determining the conver- Finally, as a result of applying the NFM system to the
sion factor of the counting rate and the measured value of D-D experiment, Fig. 29 shows an example of performing
the Campbell mode. Subsequently, this system started op- the NB-blip experiment introduced in Sec. 2.2 in LHD. As
eration for D-D experiments. shown in the middle row of the figure, a short-pulse NB
Figure 27 is an example of an actual measurement. was injected in succession from NB1 (co-passing injec-
The red, green, and blue lines are the pulse mode, the tion), NB2 (counter-passing injection), NB3 (co-passing
Campbell mode, and the combined values of both, respec- injection), and NB4 (perpendicular injection). The cen-
tively. Both the pulse and Campbell modes are in good tral electron temperature Te0 and the line averaged elec-
agreement in the overlapping region. In the region that tron density ne_ave are shown in the top row. The lower
is beyond the overlapping region, there is a difference be- part shows the neutron emission rate, which shows the re-
1405018-11Plasma and Fusion Research: Regular Articles Volume 16, 1405018 (2021)
In particular, it was an unprecedented attempt in terms
of mounting a noise tolerance function that applies digi-
tal signal processing, focusing on its vulnerability to noise
owing to high-speed response.
After designing the important characteristics by ap-
plying simulation, the neutron measurement function was
demonstrated in the nuclear reactor. Subsequently, the
product version of three systems was installed in the LHD,
and the experimental operation was started successfully.
Furthermore, impressive results regarding fast ion confine-
ment have been achieved thus far. Through the experimen-
tal operation in the LHD, it has been proved that this device
effectively functions in the fusion experiments. In the fu-
ture, we will aim to apply it to other experimental devices
Fig. 29 Example of an actual NB-blip experiment using the neu- and further improve its functions.
tron flux monitoring system.
Acknowledgments
This work was supported by the National Institute
sponse of each NB. These pulse responses have a rise time
for Fusion Science (NIFS) and National Institute of Nat-
constant of approximately 50 ms and a fall time constant
ural Sciences, Japan. Testing at the KUCA was supported
of approximately 80 ms. The DSPU has a sufficiently fast
partly by the Institute for Integrated Radiation and Nuclear
time response to these time scales in a manner such that the
Science, Kyoto University, Japan.
responsiveness of the device does not blunt the waveform.
K. Ogawa et al. have shown that these response character-
istics are in good agreement with the simulation performed [1] Y. Endo et al., IEEE Trans. Nucl. Sci. NS-29, No. 1, 714
(1982).
using FBURN, GNET [9, 10].
[2] T. Hayashi et al., Rev. Sci. Instrum. 75, 3375 (2004).
[3] K. Tobita et al., Nucl. Fusion 34, No. 8, 1097 (1994).
6. Conclusion [4] M. Osakabe et al., Fusion Sci. Technol. 72, 199 (2017).
To measure the dynamic and abruptly changing Sn [5] M. Isobe et al., Rev. Sci. Instrum. 85, 11E114 (2014).
[6] R.A. DuBridge, IEEE Trans. Nucl. Sci. 14[1], 241 (1967).
in fusion experiments, such as the D-D experiment at the
[7] T. Nishitani et al., Fusion Eng. Des. 136A, 210 (2018).
LHD, a neutron measuring equipment with the following [8] M. Isobe et al., IEEE Trans. Nucl. Sci. 46, No. 6, 2050
three features was developed. (2018).
[9] K. Ogawa et al., Nucl. Fusion 59, 076017 (2019).
(i) Wide dynamic range [10] K. Ogawa et al., Plasma Phys. Control. Fusion 60, 095010
(ii) Fast time response (2018).
(iii) Sufficient noise tolerance
1405018-12You can also read