Pre-recruit abundance indices for eastern king prawn, blue swimmer crab and snapper in south eastern Queensland
←
→
Page content transcription
If your browser does not render page correctly, please read the page content below
Pre-recruit abundance indices for eastern king
prawn, blue swimmer crab and snapper in south
eastern Queensland
2020
This publication has been compiled by P. Bessell-Browne, A. Prosser and A. Garland of Fisheries Queensland, the Department
of Agriculture and Fisheries.

© State of Queensland, 2020

The Queensland Government supports and encourages the dissemination and exchange of its information. The copyright in
this publication is licensed under a Creative Commons Attribution 4.0 International (CC BY 4.0) licence.

Under this licence you are free, without having to seek our permission, to use this publication in accordance with the licence
terms.

You must keep intact the copyright notice and attribute the State of Queensland as the source of the publication.

Note: Some content in this publication may have different licence terms as indicated.

For more information on this licence, visit https://creativecommons.org/licenses/by/4.0/.

The information contained herein is subject to change without notice. The Queensland Government shall not be liable for
technical or other errors or omissions contained herein. The reader/user accepts all risks and responsibility for losses,
damages, costs and other consequences resulting directly or indirectly from using this information.
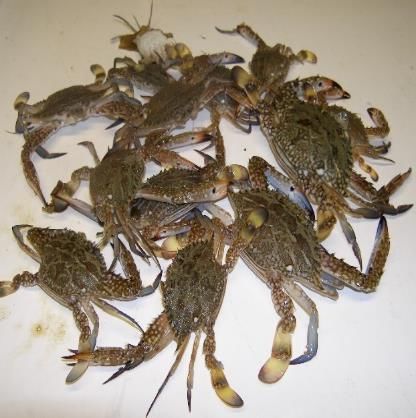
Table of Contents
Acknowledgements ............................................................................................................................... i
1 Introduction ................................................................................................................................... 1
2 Methods ......................................................................................................................................... 3
 2.1 Eastern king prawn ................................................................................................................ 4
 2.2 Blue swimmer crab ................................................................................................................ 4
 2.3 Snapper ................................................................................................................................. 5
 2.4 Analysis.................................................................................................................................. 5
3 Results ........................................................................................................................................... 6
 3.1 Model terms ........................................................................................................................... 6
 3.2 Eastern king prawn ................................................................................................................ 7
 3.3 Blue swimmer crab .............................................................................................................. 11
 3.4 Snapper ............................................................................................................................... 13
4 Discussion .................................................................................................................................. 15
 4.1 Eastern king prawn .............................................................................................................. 15
 4.2 Blue swimmer crab .............................................................................................................. 16
 4.3 Snapper ............................................................................................................................... 17
 4.4 Conclusions ......................................................................................................................... 18
5 References .................................................................................................................................. 19
Acknowledgements

The authors would like to sincerely thank the Quandamooka, Gidarjil and Butchulla people of
southern Queensland for permission to undertake this survey in their traditional waters.

We would also like to thank the staff who undertake the survey often in difficult conditions and
challenging circumstances, including Sean Maberly the skipper of the DAF Research Vessel Tom
Marshall. Jonathan Staunton Smith, Jason McGilvray, Darren Smallwood, Darren Roy, Matthew
Campbell and Tony Courtney who provide their time and expertise to solve a wide range of technical,
logistical and experimental design problems and ensure the survey has the best chance of success
each year. DAF biometricians David Mayer, Marco Kienzle and Mattias Braccini provided valuable
assistance developing indices. Thanks to Na Wang and You-Gan Wang from the University of
Queensland’s Centre for Applications in Natural Resource Mathematics for their mathematical
analysis. David Mayer and Michael O’Neill provided expert comments on the models and manuscript.

 i
1 Introduction

Abundance indicators are an important variable included in fishery stock assessments and are used
to inform fishery management decisions using harvest strategies (Haddon 2011, Sloan et al. 2014).
While fishery-dependent abundance indices are commonly available, these may be influenced by
changing behaviors of fishers and may not accurately represent the abundance of the population
(Mauder and Punt 2004; Ye and Dennis 2009). Fishery-independent abundance indices overcome
these issues and are a valuable tool to investigate changes in population structure through time.

Pre-recruit abundance indicators have improved assessments and management of fisheries, both
globally and in Australia (Fowler and Jennings 2003; Hamer and Jenkins 2004; Lowery and Geer
2000). For benthic invertebrates, and some vertebrates they provide information about recruitment
that can vary spatially and temporally. How trends in stock dynamics change over time is important for
stock assessment and fishery management.

In southern Queensland, Fisheries Queensland conducts a beam trawl survey to determine the
abundance of pre-recruit eastern king prawn (Melicertus plebejus), blue swimmer crab (Portunus
armatus) and snapper (Chrysophrys auratus). This survey is used to inform both stock assessment
and management about the recruitment variability of these three commercially valuable species.

Eastern king prawn is a key target species of the Queensland trawl fishery, and one of the most
valuable commercially-fished stocks (Courtney et al. 2014). They are a large penaeid, growing up to
30 cm and may live for more than three years (Ruello, 1975; Courtney et al 2014). They undertake
large migrations (
east biological stock are characterised by limited patterns of movement, with the majority of fish
exhibiting small home ranges and strong site fidelity (Harasti et al. 2015; Sumpton et al. 2003).

This study aims to develop methodology to standardise pre-recruit abundance indices for eastern king
prawn, blue swimmer crab and snapper collected during annual fishery-independent beam trawl
surveys.

 2
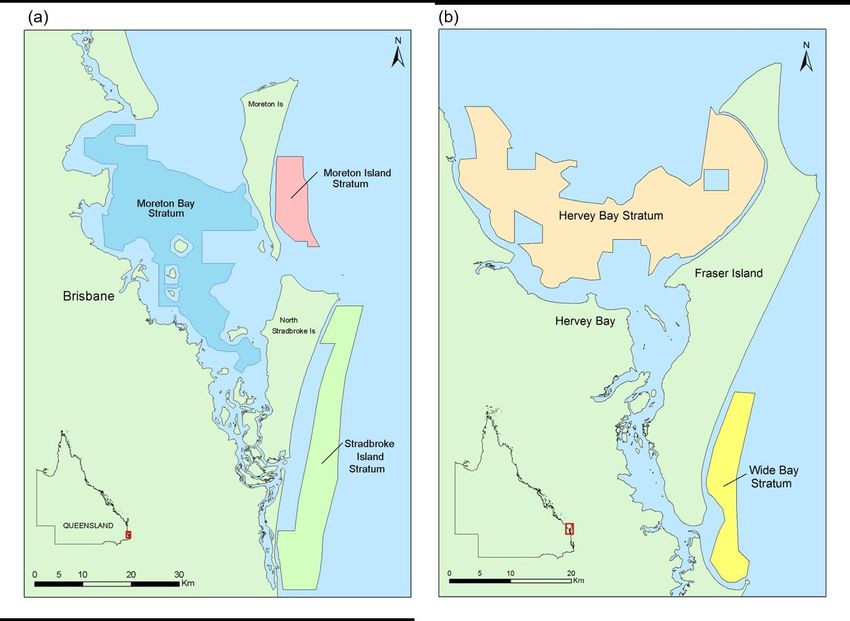
2 Methods

Fisheries Queensland conducts an annual fishery-independent beam trawl survey to improve
understanding of recruitment patterns for eastern king prawns, blue swimmer crabs and juvenile
snapper. After a successful pilot study was completed in 2006 using the DAF research vessel
Gwendoline May, the survey commenced in 2007 aboard the RV Tom Marshall and has been
conducted every year since, except in 2016.

Survey sites are located in key pre-recruit eastern king prawn, blue swimmer crab and snapper
habitat between 24° 30’ S and 28° S, including Moreton Bay and Hervey Bays (Figure 1). Strata were
selected at each of four known nursery areas for eastern king prawn (Moreton Bay, Moreton Island,
North and South Stradbroke Islands and Wide Bay), two key nursery areas for blue swimmer crabs
(Moreton and Hervey Bays) and the key nursery area for Snapper (Moreton Bay) (Figure 1). Initial
eastern king prawn survey strata were defined from historical trawl catch and effort data collected by
Courtney et al. (2002), while blue swimmer crab strata design was based on methods developed by
Sumpton et al. (2003) and snapper design was taken from Ferrell and Sumpton (1996) and Sumpton
and Jackson (2005). The distribution of effort in sites has been refined since the pilot survey in 2006
for logistical and efficiency reasons, but has remained consistent since 2009. Following the
completion of the 2008 survey, adjustments to the strata were made due to changes in the zoning of
the Moreton Bay Marine Park in March 2009, expansion of the Wide Bay stratum and cessation of
the Hervey Bay stratum (Figure 1b). In 2016, the survey was not completed in line with cost savings
within the department. In 2017, the survey was reinstated under the Queensland Sustainable
Fisheries Strategy 2017-2027. The Hervey Bay stratum was also reintroduced to complement data
collected from Moreton Bay for blue swimmer crabs (Figure 1b).

The survey currently consists of two legs sampling 400 sites. Leg 1 consists of 13 nights, with four
nights in Moreton Bay, two off North and South Stradbroke Islands and Wide Bay, one off Moreton
Island and four in Hervey Bay. Leg 2 consists of seven nights, four nights in Moreton Bay, one night
off Moreton Island and two nights off North and South Stradbroke Islands. Sites are randomly
selected for sampling, with 20 sites selected for each night of the survey. The number of nights
(therefore sites) selected for each stratum are proportional to the area of the stratum (Wang and
Wang 2012). Further details of sampling details are available (Fisheries Queensland 2016a, 2016b,
2019a, 2019b).

The survey is conducted in November and December each year. The first phase (Leg 1) starts in the
first week of November and the second phase (Leg 2) starts in the first week of December. Survey
dates are weather dependent. Between 2006 and 2009 trawl surveys were also conducted in Hervey
Bay and in March and October for other strata, however, these have been excluded from the
analyses. Additionally, records from Hervey Bay in 2017 and 2018 have been excluded until a longer
time series is obtained that can be included in future analyses.

 3
Figure 1: Map of survey strata, including (a) the three southern most strata, and (b) the northern strata, with the
recently added Hervey Bay stratum.

2.1 Eastern king prawn

All prawns caught during trawl shots at each site (samples) are identified and the carapace length
measured to the nearest 1 mm. If the catch contains over 100 eastern king prawn, a random sample
of 100 prawns are measured while the remainder are only counted.

For analyses only prawns between 25 and 35 mm carapace length were included. This size is
considered to represent prawns that will recruit to the fishery in the following months (Courtney et
al. 2002), and therefore best represents fishery dynamics.

2.2 Blue swimmer crab

Crabs collected within each sample are identified to species. For each blue swimmer crab, carapace
width is measured to the nearest 1 mm and sex is recorded. If there are over 50 blue swimmer crabs
in a single trawl sample, the first 50 individuals are measured and the remainder counted.

For analysis, only pre-recruit (0+ year old) blue swimmer crab were included. In November pre-
recruits were all crabs less than 65 mm, while in December pre-recruits were all crabs less than
85 mm carapace width. Determination of pre-recruit individuals and subsequent size inclusion during
analysis were based on a peak spawning period for blue swimmer crabs in Moreton Bay (Sumpton et
al. 1994) and growth parameters described by Sumpton et al. (2003).

 4
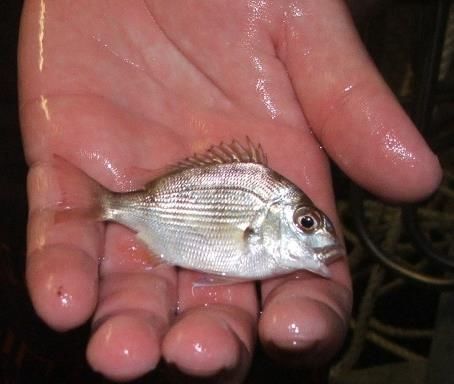
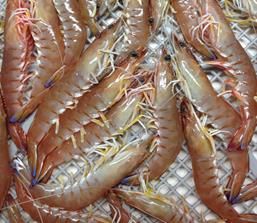
2.3 Snapper

Snapper collected within each sample are identified to species. Fork length is measured to the
nearest 1 mm, however, as the animal is alive sex is not determined.

Only pre-recruit (0+ year old) snapper, with a fork length of less than 150 mm, were included in the
analysis. Sumpton (2002) details a consistent (and discrete peak) spawning period for snapper and
growth parameters specific to Moreton Bay. Published biological information was used to inform
approximate age (in months) and expected length at the time of the survey, this information in
conjunction with modes from historical length frequency survey data aided the determination of
appropriate lengths for inclusion in analysis of pre-recruit snapper (Sumpton, 2002).

(a) (b) (c)

Figure 2: Juvenile (a) eastern king prawn, (b) blue swimmer crab and (c) snapper collected during the survey.

2.4 Analysis

Data were analysed using generalised linear models with a negative binomial distribution (McCullagh
and Nelder, 1989). A full subset of models were investigated to determine which variables were
influential for each species. These variables included year, month, area, start time group, lunar phase
and depth category. Trawled area was used as an offset in each of the models.

Start time group was the start time of each sample grouped into four time blocks, including the three
hour blocks following 17:00, 21:00, 00:00 and 03:00. Lunar phase was used as a categorical variable
of either full, waxing, waning or new moon split equally between the 29 days of the lunar cycle. Depth
was grouped into six categories of 10 m blocks, with each label representing the 10 m up to and
including that depth.

The best fitting model was determined from resulting Akike Information Criteria (AIC). Model results
estimated an index of abundance for each of the investigated species. Standardised abundances
were obtained from either the predict function for eastern king prawn or the Effects package (Fox and
Weisberg 2018, Fox 2003) for blue swimmer crab and snapper. Analyses were conducted using R
version 3.6.2 (R Core Team, 2019).

 5
3 Results

3.1 Model terms

For each of the three species, the terms that described the best model differed. For eastern king
prawn, the best model included an interaction between year and strata, with additive effects of start
time group, lunar phase and depth category. For blue swimmer crab, the best model included additive
effects of year, month, start time group, depth category and lunar phase. The best model for snapper
included additive effects of year, depth category, start time group and lunar phase.
Table 1: Top model fits for eastern king prawn, blue swimmer crab and snapper, including the model terms,
number of parameters (n), Akike Information Criteria (AIC) and delta AIC

 Species Model n AIC AIC

 Eastern king prawn Year x Area + Depth + Lunar phase + Start time group 55 20462 0

 Year x Area + Depth + Lunar phase + Start time group + 57 20464 2
 Month

 Year x Area + Depth + Lunar phase 52 20480 18

 Year x Area + Depth + Start time group 52 20466 4

 Year x Area + Lunar phase + Start time group 50 20546 84

 Year + Area + Depth + Lunar phase + Start time group 24 20609 147

 Blue swimmer crab Year + Month + Start time group + Lunar phase + Depth 22 10746 0

 Year + Month + Start time group + Depth 19 10757 11

 Year + Month + Lunar phase + Depth 19 10774 28

 Year + Start time group + Lunar phase + Depth 20 10855 109

 Year + Month + Start time group + Lunar phase 19 10932 186

 Snapper Year + Depth + Start time group + Lunar phase 19 7148 0

 Year + Depth + Start time group + Lunar phase + Month 22 7149 1

 Year + Depth + Start time group 17 7150 2

 Year + Depth + Lunar phase 17 7153 5

 Year + Start time group + Lunar phase 17 7390 242

 6
3.2 Eastern king prawn

The average number of pre-recruit eastern king prawns in each sample varied between 2007 and
2018. The highest number of pre-recruits was observed in 2008, with a total of 47 pre-recruits per
hectare (Figure 3). The next highest years of pre-recruits were in 2009 and 2012. Low years of pre-
recruits were observed in 2007, 2010, 2011 and 2014 (Figure 3). In 2014, the year with the fewest
pre-recruits sampled, an average of 24 pre-recruits per hectare were observed (Figure 3).

Figure 3: Average number of pre-recruit (25–35 mm) eastern king prawn (Melicertus plebejus) per hectare
caught in annual fishery-independent beam trawl surveys. Note the survey was not conducted in 2016.

The average number of eastern king prawn pre-recruits recorded varied between the four strata
(Figure 4). On average, fewer pre-recruits were observed in the Wide Bay strata compared with
Moreton Bay, Moreton Island and Stradbroke Island (Figure 4). In Moreton Bay, the highest number of
pre-recruits were observed in 2008 and 2009 (Figure 4). Since 2009, the average number of pre-
recruits in each sample has been below 25 per hectare (Figure 4). At Moreton Island, there was a
steady increase in the number of pre-recruits from 2007 to a peak in 2012 (Figure 4). The lowest
number of pre-recruits was observed in 2014 before another steady increase to the highest number of
pre-recruits observed in 2018 (Figure 4). At Stradbroke Island, the number of pre-recruits was
generally just below 50 per hectare, however a large peak was observed in 2008, with over 125 pre-
recruits per hectare observed (Figure 4). The number of pre-recruits was lowest overall at Wide Bay,
with a peak in 2012 only reaching an average of just below 50 pre-recruits (Figure 4).

The best model to standardise the abundance of pre-recruit eastern king prawn included an
interaction between year and area, with additive effects of start time group, depth and lunar phase.
The annual standardised index has illustrated variability and no overall clear long-term trends in
abundance between 2007 and 2018 (Figure 5).

 7
Figure 4: Average number of pre-recruit (25–35 mm) eastern king prawn (Melicertus plebejus) per hectare
caught in annual fishery-independent beam trawl surveys, in each of the four survey regions. Note the survey
was not conducted in 2016.

Figure 5: Standardised annual abundance of pre-recruit (25–35 mm) eastern king prawn (Melicertus plebejus).
Error bars represent 95% confidence intervals. Note the survey was not conducted in 2016.

 8
There was variation in the standardised abundance index between strata (Figure 6). In Moreton Bay,
pre-recruit numbers were lower than other strata, with small variation and the peak in abundance was
observed in 2008 (Figure 6). At Moreton Island, there was a strong increase in abundance between
2007 and 2013, with large variation associated with these estimates (Figure 6). Abundance
decreased in 2014, followed by another increase in abundance, with the highest record observed in
2018 (Figure 6). At Stradbroke Island, the abundance increased from 2007 to 2008, followed by a
decline to the lowest estimate in 2010 (Figure 6). Since 2010, the number of recruits ranged between
25 and 60 pre-recruits. At Wide Bay, recruits were consistently lower than Moreton and Stradbroke
Islands, with two years of increased abundance in 2009 and 2010 (Figure 6).

Figure 6: Standardised abundance of pre-recruit (25–35 mm) eastern king prawn (Melicertus plebejus) in each of
the four sampled strata. Error bars represent 95% confidence intervals. Note the survey was not conducted in
2016.

 9
The results demonstrate that, across all regions and years, higher numbers of pre-recruits were
caught when surveys trawls began in the midnight start time group compared to those beginning
earlier in the evening or later in the morning (Figure 7). In addition, fewer pre-recruits were observed
per hectare on samples conducted during the full moon, compared to those on the new moon, or
waxing or waning moon phases (Figure 7). Depth also influenced the number of pre-recruits
observed, with fewer pre-recruits observed at depths of 50 m or more, although similar numbers were
observed between 20 and 40 m depth, while the highest number of pre-recruits were observed at or
below 10 m depth (Figure 7).

Figure 7: Standardised abundance of pre-recruit (25–35 mm) eastern king prawn (Melicertus plebejus) and
variation in abundance by trawl start time group, lunar phase and depth of the trawl. Error bars represent 95%
confidence intervals.

 10
3.3 Blue swimmer crab

The highest average number of pre-recruit blue swimmer crabs were observed in 2008, with 77 crabs
per hectare, and this is considerably higher than all other years of the survey (Figure 6). The second
highest year was observed in 2017, with 39 crabs per hectare (Figure 8). The lowest number of pre-
recruits was observed in 2010, with 14 crabs per hectare (Figure 8). In all other years, the number of
pre-recruit blue swimmer crabs ranged between an average of 20–30 per hectare (Figure 8).

Figure 8: Average number of pre-recruit blue swimmer crabs per hectare caught in annual fishery-independent
beam trawl surveys. Note the survey was not conducted in 2016.

The standardised abundance index for pre-recruit blue swimmer crab shows three clear peaks in the
number of blue swimmer crabs per hectare, in 2008, 2014 and 2017, of 18, 12 and 13 crabs per
hectare respectively (Figure 9)). The remainder of the time series has been relatively stable, at
between 5 and 8 crabs per hectare (Figure 9).

Figure 9: Standardised annual abundance of pre-recruit blue swimmer crabs. Error bars represent 95%
confidence intervals. Note the survey was not conducted in 2016.

 11
Variables that influenced the abundance of pre-recruit blue swimmer crabs in the survey, include
year, month, lunar phase, start time group and depth category. Overall, more than double the number
of crabs were observed in December than in November (Figure 10). Fewer blue swimmer crabs were
observed during the waning moon phase, than during the full, new or waxing moon phases (Figure
10). The most pre-recruit blue swimmer crabs were caught when samples were conducted between 5
pm and 9 pm, followed by 9 pm through to midnight and midnight through to 3 am the least number of
crabs were observed in samples undertaken after 3 am (Figure 10). Depth also influenced the number
of pre-recruits observed, the highest number of pre-recruits were observed at or below 10 m depth,
more than double that of the other depth categories (Figure 10).

Figure 10: Standardised abundance of pre-recruit blue swimmer crabs and variation in abundance by month,
lunar phase, start time of the trawl and depth category. Error bars represent 95% confidence intervals.

 12
3.4 Snapper

The average number of pre-recruit snapper observed each year has been variable, with a peak in
numbers observed in 2011 and 2012, with 15 and 11 snapper per hectare recorded respectively
(Figure 11). This peak was followed by a sharp decline, with the lowest number of pre-recruits
observed in 2014 and 2015, with 2 and 1 snapper per hectare observed respectively (Figure 11). An
increase in pre-recruits has been observed in the two most recent surveys (Figure 11).

Figure 11: Total number of pre-recruit snapper per hectare caught in annual fishery-independent beam trawl
surveys. Note the survey was not conducted in 2016.

The standardised abundance index for pre-recruit snapper peaked in 2011 and 2012, before falling
sharply to very low estimates in 2014 and 2015, of 0.9 and 0.4 pre-recruits per hectare respectively
(Figure 12). There was also little standard error associated with these low estimates compared to the
higher estimates (Figure 12). Since these low abundance estimates, abundance has begun to
increase again with the estimate in 2018 nearing the high estimates observed in 2011 and 2012
(Figure 12).

 13
Figure 12: Standardised annual abundance of pre-recruit snapper. Error bars represent 95% confidence
intervals. Note the survey was not conducted in 2016.

Several variables influenced the abundance of snapper pre-recruits. The most pre-recruit snapper
were observed during the new moon, while fewer were observed during the other three moon phases
(Figure 13). Higher numbers were also observed in samples between 5 pm and 9 pm, with the fewest
observed during samples conducted after 3 am (Figure 13). Depth was also found to influence the
number of pre-recruit snapper observed, with the highest number of individuals found in the 0–10 m
depth category and a sharp decline in the numbers of snapper was observed at depths of 11 m or
more (Figure 13).

Figure 13: Standardised abundance of pre-recruit snapper and variation in abundance by lunar phase, start time
of the trawl and depth category. Error bars represent 95% confidence intervals.

 14
4 Discussion

The fishery-independent beam trawl survey was designed to generate an index of recruit abundance
of eastern king prawns, snapper and blue swimmer crab in southern Queensland. The survey has
undergone minor design alterations to account for legislation changes (i.e. 2009 Moreton Bay Marine
Park rezoning), to improve probability of completing the full survey (i.e. reducing sampling sites at the
Wide Bay stratum), and to increase stratum representation across species (i.e. addition of Hervey Bay
stratum for blue swimmer crab). However, the areas, timing, gear and vessel used within the survey
have remained consistent. The index of abundance has been calculated 11 times between 2007 and
2018, and provides an independent estimate of pre-recruit abundance for this time series. Being
independent of the fishery, the abundance index is not biased by fisher or fishery behavior that may
be subject to reporting errors as well as economic and social drivers.

Each index of pre-recruit abundance is used as a line of evidence in stock status assessments, Status
of Australian Fish Stock (SAFS) assessments and survey data are also used as inputs in periodic
quantitative stock assessments. Their robustness and long time series of data from a consistent
design mean that the value of the information is of high quality. As Fisheries Queensland develop
Harvest Strategies to manage key species, including eastern king prawn, blue swimmer crab and
snapper, this time series of information is of increased importance as it can be used to assist in
measuring fishery performance and to inform stock assessments to set sustainable catch and effort
levels.

Given the way the data are collected there are also opportunities to increase the value of the survey
through investigating data uses in addition to generating pre-recruit abundance indices and
comparing catch rates. Further investigation of potential data uses should be investigated.

4.1 Eastern king prawn

An independent review of the survey design in 2012 concluded that the survey was the most cost-
effective way to sample eastern king prawn effectively compared with alternative designs (Wang and
Wang 2012). The study concluded that the timing, location of strata, number of sites sampled per
stratum gave the most robust index with the resources Fisheries Queensland had for the survey
(Wang & Wang, 2012). Additionally, comparisons of survey catch rates with commercial shallow water
eastern king prawn fishery statistics show a strong correlation (Fisheries Queensland, 2012). This
supports the continuation of the survey with the current design into the future.

Some observations from the survey include that the abundance of juvenile eastern king prawns are
highest at shallow depths; the lunar phase and time of night had an impact upon survey catch rates;
and that catch rates differed between the strata within and between years. Post-larval to juvenile
stage penaeid prawns seek shallow water habitats in Moreton Bay to use as nursery areas, and the
highest abundances were recorded in areas with seagrass communities (Young 1978). This is most
likely due to the shallow water and seagrass communities providing protection from predators,
suitable water temperature ranges, salinities and current profiles along with access to abundant food
resources. As eastern king prawns grow they migrate towards deeper water and generally in a
northward direction (Ruello 1975). Additionally, in the 3–4 key recruitment months (October–January)
the eastern king prawn population in Moreton Bay reduces by 50% every two weeks through
migration and natural mortality (Lucas 1974). Therefore, it makes sense that this study observed

 15
higher catch rates in shallower water as prawns disperse through migration and abundance is
reduced due to natural mortality.

Courtney et al. (2002) found that lunar phase did not have a significant effect on juvenile eastern king
prawns in Deception Bay (part of Moreton Bay), whereas this study did. Lunar phase has previously
been found to significantly affect catch rates in juveniles in shallow nursery areas (e.g. Griffiths 1999)
due to a reduction in burying behaviour to escape predators. Prawns are more active and bury less
when light intensity is lower (Wassenberg and Hill 1994), which affect catchability and support the
findings of this study. Courtney et al. (2002) also found a correlation between time of night and prawn
catches, with more prawns being caught at night outside of dawn and dusk times, which is also
supported by the results of this study. Although significant, further analysis is required to determine
whether start time group and depth are real factors affecting eastern king prawn catch rates and not
related to sampling logistics (i.e. the pattern which randomly selected sites within the strata are
sampled) or correlations with habitat (i.e. proximity of sites to a coastal bar).

The different abundance between strata and years presented here may be a result of this study
sampling a wider range of depths and locations than Courtney et al. (2002) and the different biotic
(e.g. food items, seagrass species) and abiotic (e.g. currents, substrate type, salinity, water
temperature, distance from nursery areas) characteristics of the locations.

Future data analyses for eastern king prawn could include the development of a stock recruitment
relationship, to determine correlations with the deep-water fishery, and also to investigate the impacts
of abiotic variables, such a sea temperature on the abundance of juveniles. Increased understanding
of these factors would increase our understanding of this stock, improve stock assessment accuracy
and therefore ensure sustainable management of the fishery into the future.

4.2 Blue swimmer crab

Fishery-independent monitoring of the juvenile component of the blue swimmer crab fishery was
introduced by Fisheries Queensland to help address issues associated with accuracy of historical
logbook data and recreational fishing estimates and how this impacts on the reliability of indices of
stock abundance. The design of the fishery-independent survey is based on the methods of Sumpton
et al. (2003), who used a beam trawl to target juvenile blue swimmer crabs in Moreton Bay during
2000 and 2001. These results and results of the subsequent pilot study suggested that annual
surveys to estimate abundance of juvenile blue swimmer crab would be an achievable and cost
effective method for monitoring stocks in southern Queensland (Sumpton et al. 2003).

The surveys collecting biological data for blue swimmer crab have remained consistent since 2009.
The design of the survey captures the pulse of juveniles resulting from the spring spawning event and
is conducted during the optimal period in Moreton Bay, where recruitment is at its peak and there are
limited impacts of dispersal, reduced catchability and harvest (Sumpton et al. 2015).

The importance of having an index of relative abundance has also been recognised in South Australia
and Western Australia, where the management of blue swimmer crabs is informed by similar
independent trawl surveys that have been validated against fishery-dependent abundance indices.

The juvenile blue swimmer crab index of abundance was used in the most recent assessment of the
Queensland Blue Swimmer Crab Fishery (Sumpton et al. 2015). The assessment highlighted the
need for the fishery-independent trawl surveys to continue, as the assessment relied heavily on the

 16
recruit abundance index (Sumpton et al. 2015). The index will also be incorporated into the upcoming
stock assessment of the Queensland Blue Swimmer Crab Fishery.

Previous studies have shown that abundance of juvenile crabs in Moreton Bay is dependent on time
of year (Sumpton et al. 2003), while emergence of crabs from the substrate is dependent on time of
day (Sumpton and Smith 1990), which is supported by the results presented here. Juvenile blue
swimmer crabs are caught in higher abundances immediately after sunset and decline steadily
through time until sunrise (more catchable at dusk and at the beginning of night than at and after
midnight). These results support findings by Sumpton and Smith (1990), who found that crabs were
most active during the same period based on percentage emergence from the substrate. The peak in
activity of crabs during this period would make them more susceptible to capture and explain the
increased abundance of crabs in samples.

Similarly to eastern king prawn, it would be beneficial to further analyse the effect of depth on blue
swimmer crab catch rates. It is important to determine whether depth is an independent factor or
whether a correlation between depth and habitat/substrate type is responsible for changes in blue
swimmer crab abundance. Further work on blue swimmer crab could also include determination of a
stock recruitment relationship, and determining the contribution of juvenile crabs from inshore
Moreton Bay to fishing grounds further offshore. A tagging project in combination with this survey
could be a potential option to determine the contribution of inshore juveniles to the offshore fishery
grounds. Previous tagging studies showed adult blue swimmer crabs remained inside Moreton Bay,
however, at that time there was little fishing pressure offshore and the conclusion that the stock is
mainly contained within Moreton Bay now comes under question (Potter et al. 1994, Sumpton et
al. 2003).

4.3 Snapper

Recruitment surveys have been carried out for snapper in other states of Australia and have proven to
be a valuable source of information incorporated into the assessment and management of snapper
stocks. In South Australia, Western Australia and Victoria, fishery-independent beam trawl surveys
are used to describe patterns of pre-recruit snapper distribution and abundance and determine spatio-
temporal variability (Fowler and Jennings 2003, Hamer and Jenkins 2004). In Queensland, previous
research has confirmed the presence of pre-recruit snapper in Moreton Bay and the effectiveness of
using beam trawls to detect spatial and temporal variation and determine relative abundance of pre-
recruit snapper (Ferrell and Sumpton 1996, Sumpton and Jackson 2005).

Fishery-independent monitoring of pre-recruit snapper in Moreton Bay was introduced by Fisheries
Queensland to provide a method to estimate and identify trends in pre-recruit snapper abundance
independent of the commercial and recreational sectors. It precludes issues associated with relying
on historical logbook data and recreational fishing estimates.

Annual fishery-independent beam trawl surveys collecting biological data for snapper have remained
consistent since 2009. Survey design is based on other states’ recruitment surveys and previous
research conducted within Queensland (Fowler and Jennings 2003; Hamer and Jenkins 2004). The
survey is conducted approximately one to two months after the completion of spawning events in the
local mature snapper population (Sumpton 2002). This timing also coincides with the expected end of
the larval settlement period for snapper into nursery areas (Sumpton 2002).

 17
The 2009 east coast snapper stock assessment by Campbell et al. (2009) stated that monitoring was
imperative in increasing the accuracy and precision of future assessments. Specifically, the
continuation and refinement of the fishery-independent beam trawl survey to collect data designed to
assess snapper recruitment, would aid in a better understanding of the status of the snapper stock by
reducing assessment uncertainty.

Pre-recruit snapper data was not available for the initial stock assessment of snapper in 2006 as
monitoring commenced shortly after this assessment was published, but has been included in all
subsequent analysis of the species. Most recently, Wortmann et al. (2018) incorporated fishery-
independent snapper pre-recruit catch rates from Moreton Bay as an index of abundance in stock
assessment scenarios. Snapper is currently considered to be in a depleted state and it is important to
continue monitoring this species to better understand the status of the stock.

The highest catch rates of pre-recruit snapper from this survey were observed at sites equal to or less
than 10 m in depth. This is supported by research which has shown that juvenile snapper are more
common in the shallower of Moreton Bay (at locations of 10 m and less), with catch rates in the
deepest areas an order of magnitude lower than in areas less than 5 m in depth (Sumpton and
Jackson 2005, Sumpton 2002). It is important to consider that it is most likely not water depth that
directly influences snapper abundance, rather the presence of favourable habitat. For the
aforementioned reason, it is important that the significance of the depth factor be further investigated.
Additional investigation into the effect of start time group on snapper catch rates should also be
conducted to ensure its significance is not related to sampling logistics (i.e. the pattern which
randomly selected sites within the strata are sampled).

The snapper stock in Queensland were considered overfished before the survey began in 2007 and
the recruitment levels observed, even at higher estimates are likely much lower than would be
expected with a healthy stock size (Wortmann et al. 2018). Additionally, limited information is
available on annual recruitment to snapper stocks in southern Queensland and the importance and
contribution of juveniles from embayments such as Moreton Bay to offshore populations remains
poorly understood (Ferrell and Sumpton 1996). Determining a correlation between this fishery-
independent abundance index and fishery-dependent ones will be challenging due to the life history
strategy of this species and specifically the long time lag between the pre-recruits observed in this
survey and individuals recruited to the fishery.

4.4 Conclusions

Overall, the survey and resulting analyses have provided a fishery-independent index of abundance
for each of the species investigated. The survey data have been used as a line of evidence to
determine stock status of these species in a state and national context, and as recruitment inputs to
quantitative stock assessment. Further benefit would arise from linking the abundance indices
presented here and other fishery-dependent abundance indices to validate results and increase
confidence for stakeholders. Determining these relationships should be of priority for future work in
this area. The value of the survey will increase as the time series is extended with consistent
methodology.

 18
5 References

Allen, M., Sumpton, W., O’Neill, M., Courtney, T. and Pine, B. (2006), Stochastic stock reduction
analysis for assessment of the pink Snapper (Pagrus auratus) fishery in Queensland, Technical
Report QI06069, Department of Primary Industries and Fisheries, Brisbane.

Campbell, A., O’Neill, M., Sumpton, W., Kirkwood, J. and Wesche, S. (2009). Stock assessment of
the Queensland snapper fishery (Australia) and management strategies for improving sustainability.
Department of Employment, Economic Development and Innovation, Brisbane, Australia.

Courtney A.J., Cosgrove M.G., Mayer D.G. (2002) Developing indicators of recruitment and effective
spawner stock levels in eastern king prawns (Penaeus plebejus). Final Report FRDC 97/145,
Department of Primary Industries, Queensland

Courtney AJ, Courtney, A. J., O’Neill, M. F., Braccini, M., Leigh, G.M., Kienzle, M., Pascoe, S.,
Prosser, A. J., Wang, Y.-G., Lloyd-Jones, L., Campbell, A.B., Ives, M., Montgomery, S.S. and Gorring,
J. (2014) Biological and economic management strategy evaluations of the eastern king prawn
fishery. Project Report. FRDC.

de Lestang, S., Hall, N.G. and Potter, I.C. (2003). Do the age compositions and growth of the crab
Portunus pelagicus in marine embayments and estuaries differ? Journal of the Marine Biological
Association of the United Kingdom, 83: 1– 8.

Ferrell, D. and Sumpton, W. (1996) Assessment of the fishery for snapper (Pagrus auratus) in
Queensland and New South Wales. Fisheries Research and Development Corporation, Final Report
to FRDC for project no. 93/074, Canberra, Australia.

Fisheries Queensland (2012) Fishery indepednant trawl survey review: an assessment of the data
2006-2010. Brisbane, Australia.

Fisheries Queensland (2016a) Fishery Monitoring Sampling Protocol Section 1: Eastern king prawn.
Department of Agriculture and Fisheries. Brisbane, Australia.

Fisheries Queensland (2016b) Fishery Monitoring Sampling Protocol Section 2: Eastern king prawn.
Department of Agriculture and Fisheries. Brisbane, Australia.

Fisheries Queensland (2019a). Biological Sampling Protocol: Blue Swimmer Crab, Department of
Agriculture and Fisheries, Brisbane, Australia.

Fisheries Queensland (2019b). Biological Sampling Protocol: Pre-recruit Snapper, Department of
Agriculture and Fisheries, Brisbane, Australia.

Fowler, A.J. and Jennings, P.R. (2003). Dynamics in 0+ recruitment and early life history for snapper
(Pagrus auratus, Sparidae) in South Australia. Marine and Freshwater Research 54, 941–956.

Griffiths, S.P. (1999). Effects of lunar periodicity on catches of Penaeus plebejus (Hess) in an
Australian coastal lagoon. Fisheries Research 42, 195–199.

Haddon, M. (2011). Modelling and Quantitative Methods in Fisheries 2nd Edition. Chapman and Hall,
CRC Press.

Hamer, P.A. and Jenkins, G.P. (2004). High levels of spatial and temporal recruitment variability in the
temperate sparid Pagrus auratus. Marine and Freshwater Research 55, 663–673.

 19
Harasti, D,. Lee, K., Gallen, C., Hughes, J. and Stewart, J. (2015). Movements, home range and site
fidelity of snapper (Chrysophrys auratus) within a no-take marine protected area. PLoS One 10(11):
e0142454

Kumar, M. (1997). Proceedings of the First National Workshop on Blue Swimmer Crab Portunus
pelagicus. SARDI Research Report Series, 16, 129 pp.

Lowery, W.A. and Geer, P.J. (2000). Juvenile finfish and blue crab stock assessment program bottom
trawl survey annual data summary report series. Volume 1999. Virginia Institute of Marine Science
Special Scientific Report No. 124. Virginia Institute of Marine Science, Gloucester Point, VA.

Lucas, C. (1974). Preliminary estimates of stocks of the king prawn, Penaeus plebejus, in South-East
Queensland. Aust. J. Mar.Freshwater Res. 25, 35–47.

Maunder M.N., Punt A.E. (2004). Standardizing catch and effort data: a review of recent approaches.
Fish. Res. 70(2–3): 141–159

McCullagh, P. and Nelder, J. A. (1989). Generalized Linear Models (2nd ed.). Chapman and Hall,
London.

Morgan, J., Sumpton, W., Jones, A., Campbell., A., Stewart, J., Hamer, P. and Ovenden, J. (2018).
Assessment of genetic structure among Australian east coast populations of Snapper Chrysophrys
auratus (Sparidae). Marine and Freshwater Research. DOI 10.1071/MF18146.

Potter, I.C., Chrystal, P. J. and Loneragan. N.R. (1983). The biology of the blue manna crab Portunus
pelagicus in an Australian estuary. Marine Biology 78:75–85.

R Core Team (2019). R: A language and environment for statistical computing Version 3.6.2. R
Foundation for Statistical Computing, Vienna, Austria. URL https://www.R-project.org/.

Ruello, N.V. (1975). Geographical distribution, growth and breeding miagration of the eastern
Australian king prawn Penaeus plebejus Hess Australian Journal of Marine and Freshwater Research
26(3) 343–354

Sloan, S. R., Smith, A.D.M., Gardner, C., Crosthwaite, K., Triantafillos, L., Jeffries, B. and Kimber, N.
(2014) National Guidelines to Develop Fishery Harvest Strategies. FRDC Report – Project 2010/061.
Primary Industries and Regions, South Australia, Adelaide, March. CC BY 3.0

Stewart, J., Rowling, K., Hegarty, A-M. and Nuttall, A. (2010), Size and age at sexual maturity of
snapper Pagrus auratus in New South Wales 2008/09. Industry and Investment NSW – Fisheries
Research Report Series No. 27. 38pp.

Sumpton, W. (2002). Population Biology and Management of Snapper (Pagrus auratus) in
Queensland. PhD Thesis. University of Queensland, Brisbane, Australia.

Sumpton, W., Campbell, M., O’Neill, M., McLennan, M., Campbell, A. and Leigh, G (2015).
Assessment of the Blue swimmer crab (Portunus armatus) fishery in Queensland. Department of
Agriculture and Fisheries.

Sumpton, W., Gaddes, S., McLennan, M., Campbell, M., Tonks, M., Good, N., Hagedoorn, W.,
Skilleter, G. (2003). Fisheries biology and assessment of the blue swimmer crab (Portunus pelagicus)
in Queensland. Final report to FRDC on Project No. 98/117. Department of Primary Industries and
Fisheries, Brisbane, Australia.

 20
Sumpton, W. and Jackson, S. (2005). The effects of incidental trawl capture of juvenile snapper
(Pagrus auratus) on yield of a sub-tropical line fishery in Australia: An assessment examining habitat
preference and early life history characteristics. Fisheries Research 71, 335–347.

Sumpton, W.D., Potter, M.A., and Smith, G.S. (1994). The biology of the commercial sand crab,
Portunus pelagicus L. in a subtropical Australian embayment. Asian Fisheries Science 7: 103-113.

Wortmann J, O’Neill MF, Sumpton WD, Campbell MJ (2018). Stock assessment of Australian east
coast snapper, Chrysophrys auratus. Predictions of stock status and reference points for 2016.
Department of Agriculture and Fisheries, Brisbane, Australia 128 pp.

Wang, N., and Wang, Y.-G. (2012). Optimal survey design for the EKP component of LTMP – An
assessment of the Fishery-independent trawl survey data. Centre for Applications in Natural
Resource Mathematics, University of Queensland 17 pp.

Wassenberg, T.J., Hill, B.J. (1994). Laboratory study of the effect of light on the emergence behaviour
of eight species of commercially important adult penaeid prawns. Aust. J. Mar. Freshwater Res. 45,
43–50.

Ye, Y. and Dennis, D. (2009). How reliable are the abundance indices derived from commercial
catch–effort standardization? Canadian Journal of Fisheries and Aquatic Science. 66: 1169–1178.

 21
You can also read