Moreton Bay Regional Council Caboolture West Transport Modelling Study Report
←
→
Page content transcription
If your browser does not render page correctly, please read the page content below
Moreton Bay Regional Council
                                                  Caboolture West Transport
                                                  Modelling
                                                  Study Report

                                                  Issue | 30 January 2014

This report takes into account the particular
instructions and requirements of our client.
It is not intended for and should not be relied
upon by any third party and no responsibility
is undertaken to any third party.

Job number         229906

Arup
Arup Pty Ltd ABN 18 000 966 165
Arup
Level 17
1 Nicholson Street
Melbourne VIC 3000
Australia
www.arup.com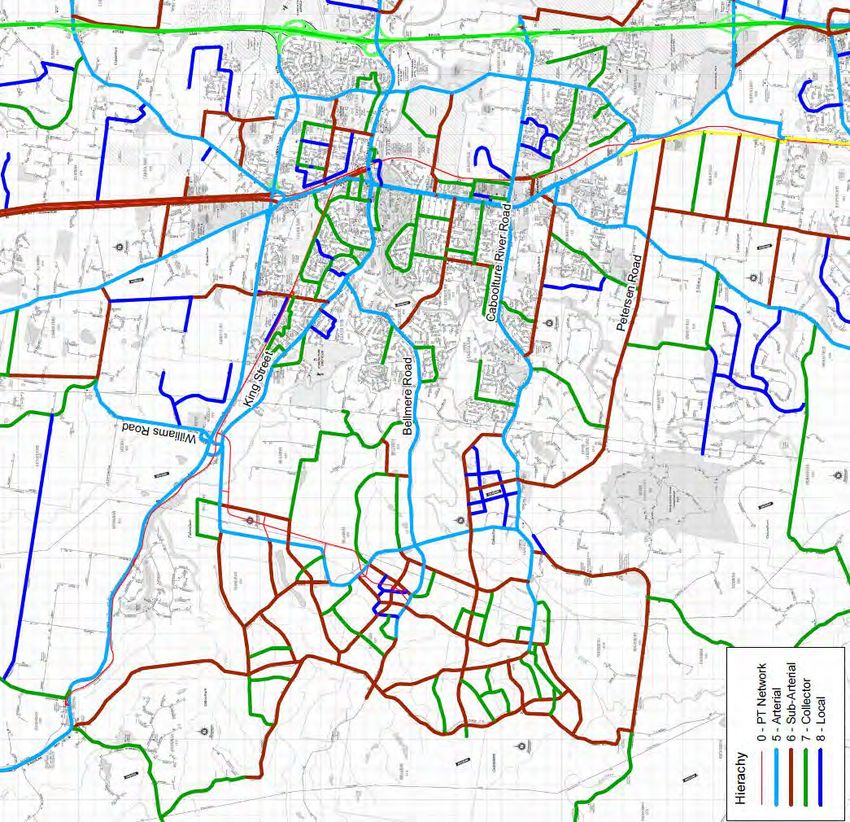
Moreton Bay Regional Council                                                    Caboolture West Transport Modelling
                                                                                                      Study Report

Contents

                                                                                                            Page

1               Introduction                                                                                    1
                1.1                 Background                                                                  1
                1.2                 Study Process                                                               1
                1.3                 This report                                                                 1

2               Study Background                                                                                3
                2.1                 Regional context                                                            3
                2.2                 Caboolture/ Morayfield                                                      3
                2.3                 Caboolture West                                                             3
                2.4                 Transport Policy and Strategy                                               7

3               Transport Assessment Methodology                                                                9
                3.1                 Overview                                                                   9
                3.2                 The model                                                                  9
                3.3                 Assessment of transport issues                                            10
                3.4                 Land use and transport scenario assessment                                10
                3.5                 Preferred scenario selection                                              11
                3.6                 Preferred scenario assumptions                                            11

4               Ultimate Scenario Assessment                                                                  20
                4.1                 Introduction                                                              20
                4.2                 Travel demand                                                             20
                4.3                 Trip distribution                                                         21
                4.4                 Mode split                                                                24
                4.5                 Public transport                                                          24
                4.6                 Traffic impact                                                            26

5               Intersection improvements                                                                     32
                5.1                 Approach                                                                  32
                5.2                 Desired Standard of Service                                               32
                5.3                 Deficiencies and Solutions                                                34

6               Staging Assessment                                                                            36
                6.1                 Approach                                                                  36
                6.2                 Assumptions                                                               36
                6.3                 Strategic modelling results                                               37
                6.4                 Timing of road improvements                                               38

7               Transport Infrastructure Cost                                                                 40
                7.1                 Internal Road Network                                                     40

 | Issue | 30 January 2014 | Arup
\\GLOBAL.ARUP.COM\AUSTRALASIA\BNE\PROJECTS\229000\229906-00 CABOOLTURE WEST
MODELLING\WORK\INTERNAL\DOCUMENTS\REPORTS\FINALREPORT\STUDY REPORT_FINAL.DOCX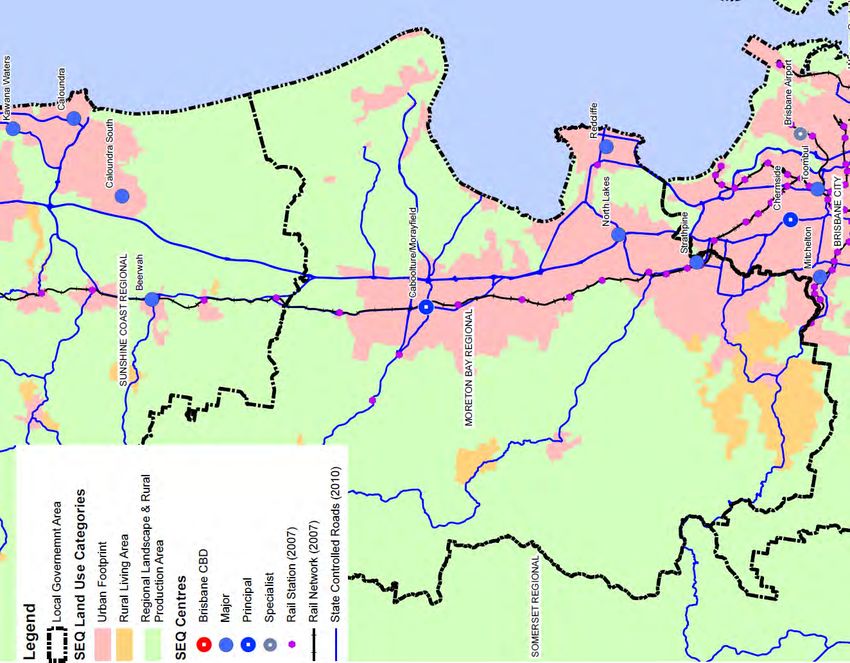
Moreton Bay Regional Council                                                    Caboolture West Transport Modelling
                                                                                                      Study Report

                7.2                 External Road Network                                                     41

8               Summary and Conclusions                                                                       42
                8.1                 Introduction                                                              42
                8.2                 Preliminary Analysis                                                      42
                8.3                 Proposed Development                                                      42
                8.4                 Deficiency analysis                                                       43
                8.5                 Staging requirements                                                      43
                8.6                 Preliminary road network costs                                            44

Appendices

Appendix A
Desire Line Analysis

Appendix B
Scenario Assessment Working Paper

Appendix C
Public Transport Network Review

Appendix D
Road Network Analysis

Appendix E
Staging Analysis

Appendix F
Preliminary Internal Road Network Costs

Appendix G
Preliminary External Road Network Costs

 | Issue | 30 January 2014 | Arup
\\GLOBAL.ARUP.COM\AUSTRALASIA\BNE\PROJECTS\229000\229906-00 CABOOLTURE WEST
MODELLING\WORK\INTERNAL\DOCUMENTS\REPORTS\FINALREPORT\STUDY REPORT_FINAL.DOCX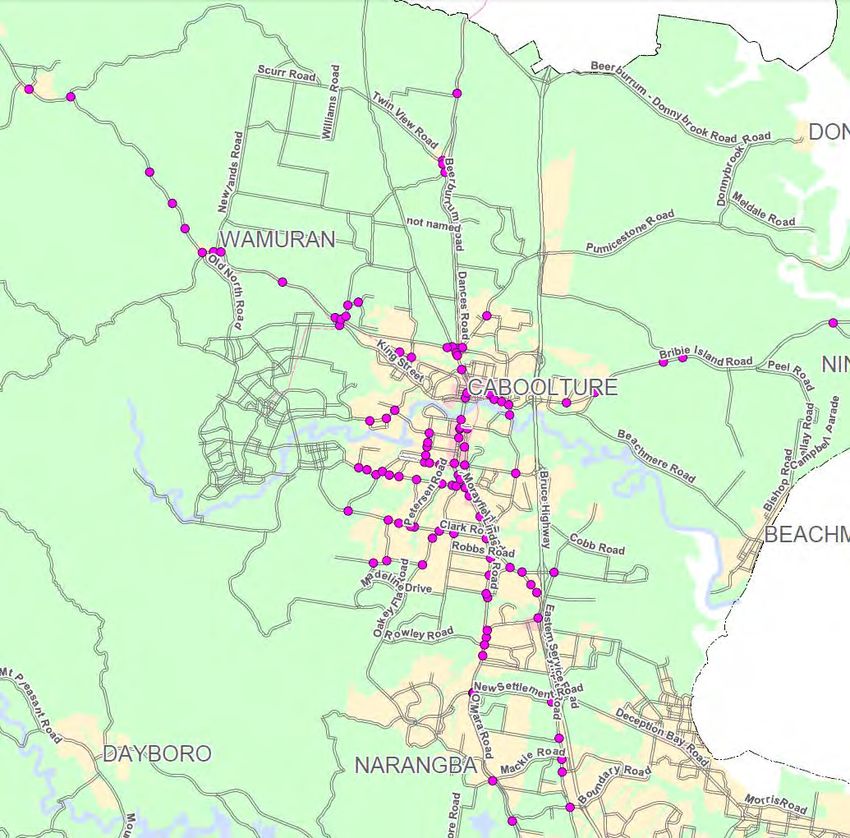
Moreton Bay Regional Council                                                    Caboolture West Transport Modelling
                                                                                                      Study Report

1                     Introduction
1.1                   Background
Moreton Bay Regional Council (MBRC) appointed Arup to assist in the planning
and development of a Structure Plan for the Caboolture West Master Plan Area.
Arup’s scope was to undertake strategic transport modelling to assess the likely
transport impacts and provide transport planning advice regarding the form of the
internal transport network and transport connections to the external network.
Caboolture West is located to the west of Caboolture and Morayfield, bounded to
the north by the D’Aguilar Highway and to the south by the Caboolture River
Road. The site is predominantly rural in nature and is traversed by several local
roads including Old North Road and Bellmere Road. Provisionally, the proposed
development could allow for approximately 68,000 residents and employment of
15,000 full time equivalent jobs, with development of the area occurring over the
next 30 to 40 years.
MBRC appointed a range of consultants, including urban design, environmental
economics and transport modelling to provide specialist input to the structure plan
for the proposed Caboolture West development. MBRC with stakeholders set
objectives for the form of the development and how it would integrate with the
rest of Caboolture.
The purpose of the Arup’s commission was to undertake transport modelling to
identify the challenges faced accommodating Caboolture West on the wider
transport network, to inform land use and transport scenario development and
identify the transport infrastructure that would be required to accommodate the
development.

1.2                   Study Process
The study phases are outlined as follows:
•      Phase 1: Travel demand assessment: to identify challenges and issues to
       provide access to Caboolture West. This involved an assessment of the
       potential demand characteristics and desire lines
•      Phase 2: Scenario Testing: to investigate a range of alternative land use and
       transport scenarios for Caboolture West that meet the objectives set for the
       development
•      Phase 3: Assessment of Preferred Scenario: to analyse and identify the
       required transport measures to adequately accommodate travel demand to,
       from and within Caboolture West as part of Moreton Bay’s overall transport
       goals.

1.3                   This report
This report summarises the outcomes of our transport modelling investigations,
referring to various appendices that document in more detail the analysis that
supports the outcomes:

 | Issue | 30 January 2014 | Arup                                                                       Page 1
\\GLOBAL.ARUP.COM\AUSTRALASIA\BNE\PROJECTS\229000\229906-00 CABOOLTURE WEST
MODELLING\WORK\INTERNAL\DOCUMENTS\REPORTS\FINALREPORT\STUDY REPORT_FINAL.DOCX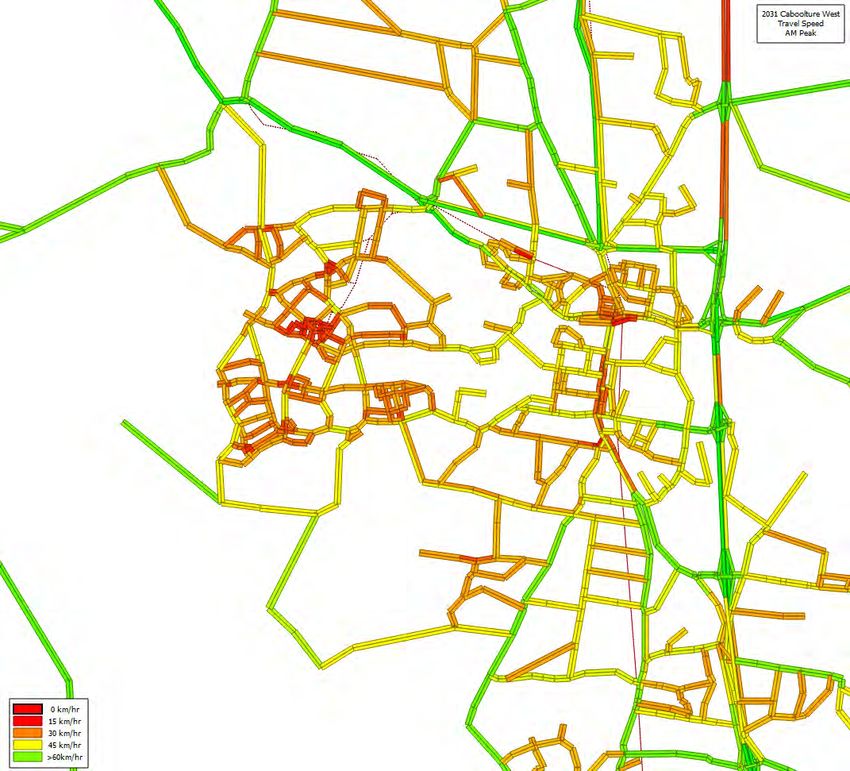
Moreton Bay Regional Council                                                    Caboolture West Transport Modelling
                                                                                                      Study Report

•      Section 2 outlines the study background including the regional planning
       context and the Caboolture West development
•      Section 3 outlines the methodology used and assumptions made to assess the
       transport impacts of the Caboolture West development on the Caboolture
       network
•      Section 4 describes the impact of the full development on the transport
       network
•      Section 5 outlines intersection road network upgrades required as a result of
       the development
•      Section 6 summarises the staging requirements of transport improvements to
       accommodate Caboolture West
•      Section 7 outlines the preliminary cost estimates for the road infrastructure to
       be provided.
The following appendices are provided:
•      Appendix A: Details the desire line analysis that was used to identify key
       travel characteristics to inform the transport challenges for Caboolture West
•      Appendix B: Contains the working paper produced to assess the impacts of
       alternative transport and land use scenarios
•      Appendix C: Outlines the public transport network assessment
•      Appendix D: Details the assessment of required road transport infrastructure
•      Appendix E: Details the assessment of staging requirements for transport
       infrastructure
•      Appendix F: Outlines the preliminary costing undertaken for the identified
       internal and external road network upgrades.

 | Issue | 30 January 2014 | Arup                                                                       Page 2
\\GLOBAL.ARUP.COM\AUSTRALASIA\BNE\PROJECTS\229000\229906-00 CABOOLTURE WEST
MODELLING\WORK\INTERNAL\DOCUMENTS\REPORTS\FINALREPORT\STUDY REPORT_FINAL.DOCX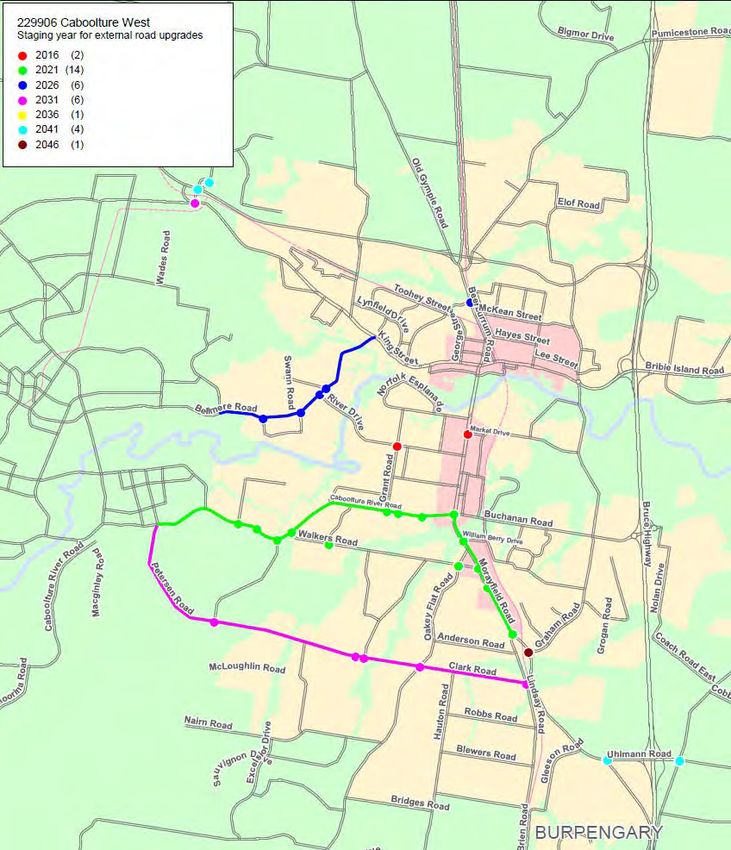
Moreton Bay Regional Council                                                    Caboolture West Transport Modelling
                                                                                                      Study Report

2                     Study Background
2.1                   Regional context
The Moreton Bay Region is one of the fastest developing places in Australia.
Situated between Brisbane and the Sunshine Coast, it is the third largest
municipality in Australia. It has a current population in the order of 350,000 and is
forecast to grow to over 500,000 by 2031. Figure 1 shows the Moreton Bay
region. Caboolture is a principal activity centre located at the northern extent of
the urban footprint from Brisbane. Caboolture is the only principal activity centre
between Brisbane and the Sunshine Coast. Other major centres in Moreton Bay
are Strathpine and North Lakes located to the south along the Bruce Highway and
Redcliffe to the east. The Bruce Highway transport corridor is an important
corridor of national importance, servicing the Sunshine Coast and other areas in
South East Queensland and is experiencing a significant growth in demand. As
growth occurs in this corridor and Moreton Bay increasing pressure is being
placed on the transport network in Moreton Bay.

2.2                   Caboolture/ Morayfield
The Caboolture/ Morayfield area currently has a population of about 80,000
people, is located on the Bruce Highway and is a key activity centre between
Brisbane and the Sunshine Coast. Significant growth is forecast in Caboolture/
Morayfield area where the population is expected to grow to over 200,000 by
2051. This is a substantial change for the current situation and hence requires
some consideration on how to provide good and efficient transport connection to
accommodate that growth. Whilst development will be a combination of infill and
greenfields, there are limited sites to accommodate greenfields development in
Caboolture. The Caboolture West site provides the opportunity to the greenfields
component of growth.
It is important to note that whilst we are considering the transport network
requirements for the Caboolture West Master Plan Area (MPA) the development
is being considered as part of the overall Caboolture/Morayfield growth plan.

2.3                   Caboolture West
Caboolture West is located to the west of the Caboolture town centre and
Morayfield, bounded to the north by the D’Aguilar Highway and to the south by
the Caboolture River Road as shown in Figure 2. The site is predominantly rural
in nature and is traversed by several local roads including Old North Road and
Bellmere Road. The proposed development could allow for up to 68,000 residents
and employment of 15,000 full time equivalent jobs leading to a potential
population in Caboolture of around 200,000.
The proposed development at Caboolture West would retain natural bushland and
wildlife habitats in the area as well as many parks and open space areas. There
would be a range of homes that people can afford that reflect the needs of all
residents from families with children to retirees, singles and extended families.
The area will have a “sense of place” with views to the range, river and
mountains. Good accessibility will be provided with many choices in how you

 | Issue | 30 January 2014 | Arup                                                                       Page 3
\\GLOBAL.ARUP.COM\AUSTRALASIA\BNE\PROJECTS\229000\229906-00 CABOOLTURE WEST
MODELLING\WORK\INTERNAL\DOCUMENTS\REPORTS\FINALREPORT\STUDY REPORT_FINAL.DOCX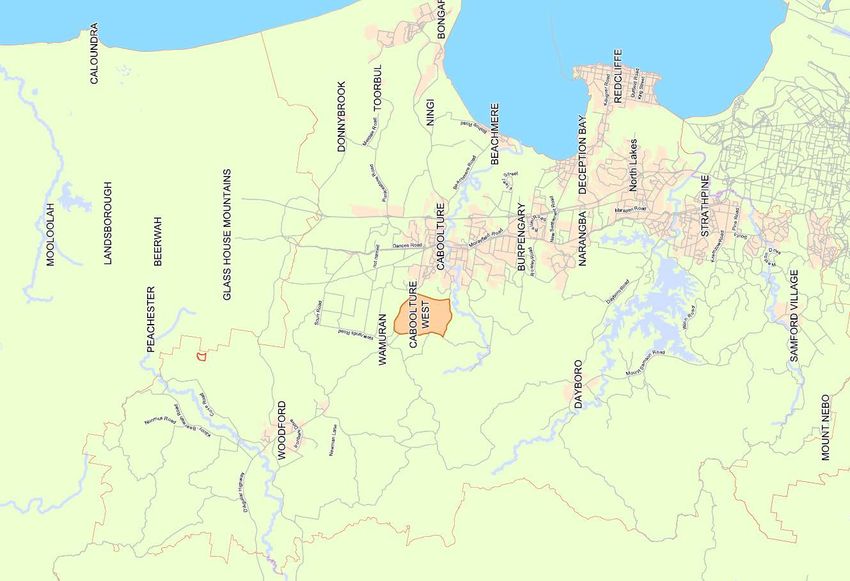
Moreton Bay Regional Council Caboolture West Transport Modelling
Study Report
can travel. The development plan encourages people walk or cycle to local
destinations such as shops, schools and other services that are easily accessed by
dedicated pathways. Many of the required services and shops are in the
Caboolture West area to encourage trip containment within the area, and minimise
unnecessary travel outside Caboolture. Strong transport corridors including
public transport/bus services are proposed to connect Caboolture West to external
activity centres.
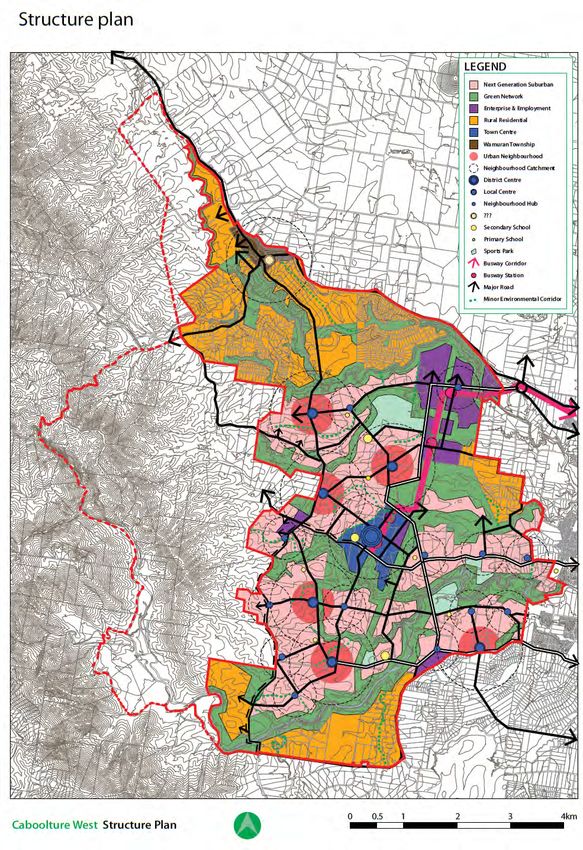
Figure 3 shows the proposed structure plan for Caboolture West. The key features
to note include the centrally located town centre and six neighbourhood centres.
An enterprise and employment area is located to the north of the area adjacent to
the D’Aguilar Highway. A series of major roads permeate the site and link the
town and neighbourhood centres to the external road network. The
neighbourhoods are quite distinct and are separated by green space.
Figure 1: Regional context
| Issue | 30 January 2014 | Arup Page 4
\\GLOBAL.ARUP.COM\AUSTRALASIA\BNE\PROJECTS\229000\229906-00 CABOOLTURE WEST
MODELLING\WORK\INTERNAL\DOCUMENTS\REPORTS\FINALREPORT\STUDY REPORT_FINAL.DOCX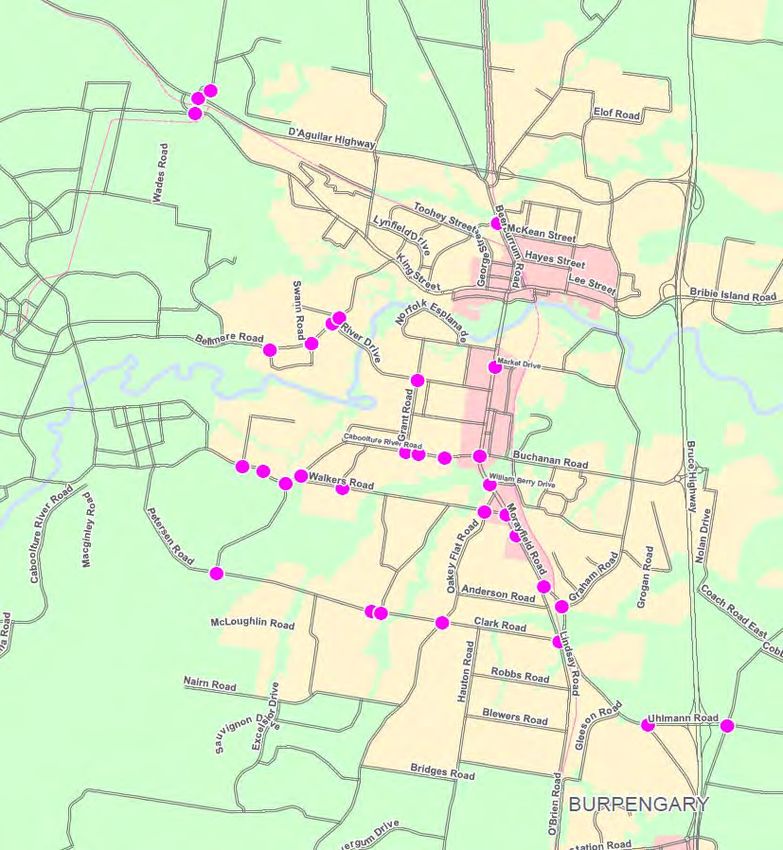
Moreton Bay Regional Council                                                    Caboolture West Transport Modelling
                                                                                                      Study Report

Figure 2: Caboolture West location

 | Issue | 30 January 2014 | Arup                                                                       Page 5
\\GLOBAL.ARUP.COM\AUSTRALASIA\BNE\PROJECTS\229000\229906-00 CABOOLTURE WEST
MODELLING\WORK\INTERNAL\DOCUMENTS\REPORTS\FINALREPORT\STUDY REPORT_FINAL.DOCX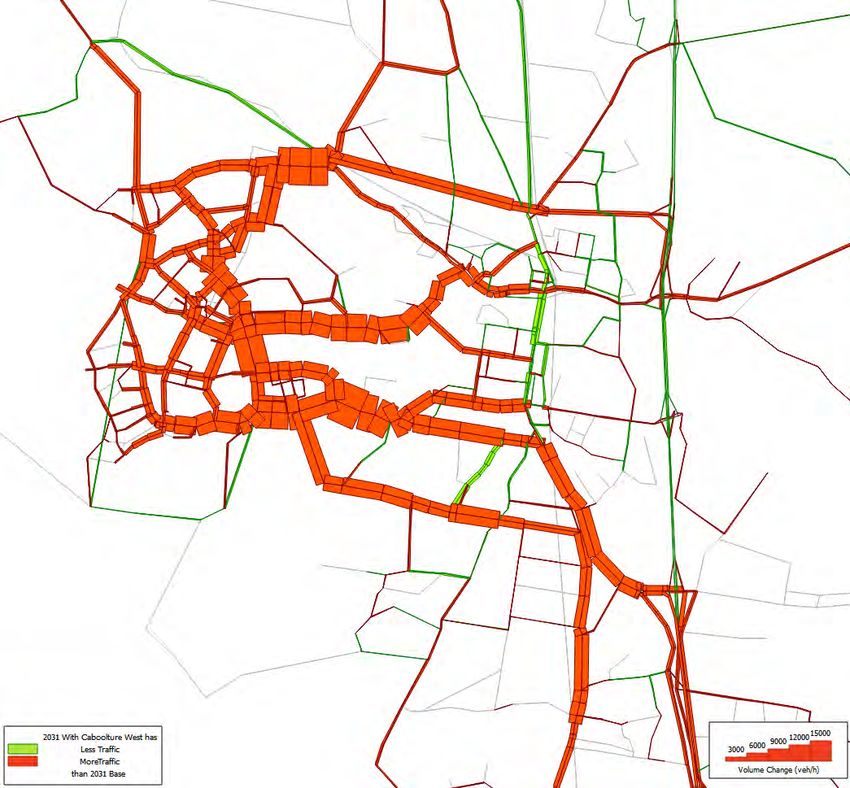
Moreton Bay Regional Council                                                    Caboolture West Transport Modelling
                                                                                                      Study Report

Figure 3: Caboolture West Structure Plan

 | Issue | 30 January 2014 | Arup                                                                       Page 6
\\GLOBAL.ARUP.COM\AUSTRALASIA\BNE\PROJECTS\229000\229906-00 CABOOLTURE WEST
MODELLING\WORK\INTERNAL\DOCUMENTS\REPORTS\FINALREPORT\STUDY REPORT_FINAL.DOCX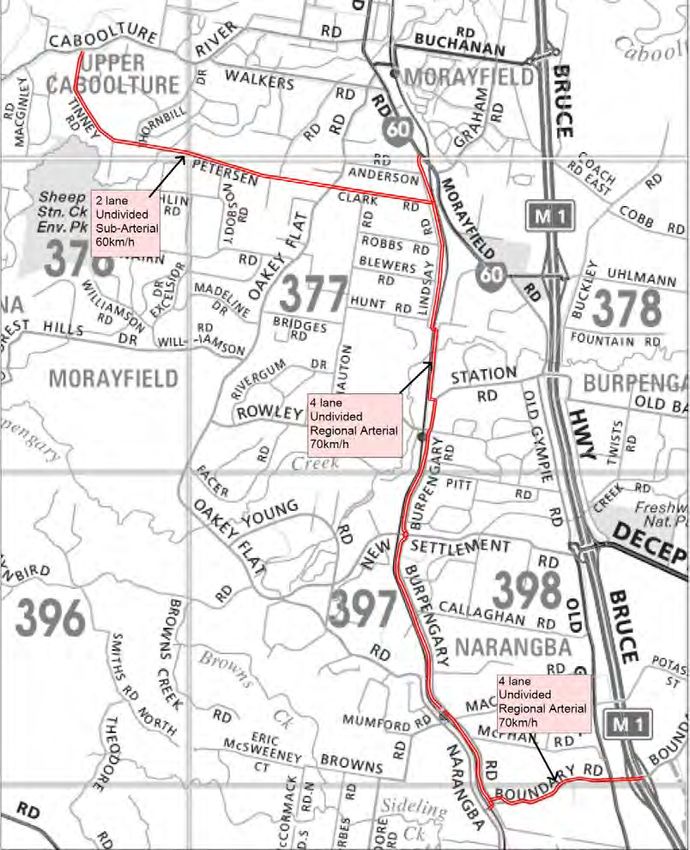
Moreton Bay Regional Council                                                    Caboolture West Transport Modelling
                                                                                                      Study Report

2.4                   Transport Policy and Strategy

2.4.1                 State Context
There are two key interrelated State Government strategic planning and policy
documents that guide the development and implementation of road network
improvements in Queensland. These are:
•      South East Queensland Regional Plan 2009 to 2031.
•      Connecting SEQ 2031: An integrated regional transport plan for South East
       Queensland.
Due to the recent change in government, it is anticipated that a number of these
documents will change to represent the current governments’ strategies. In the
absence of new policy documents the most recent government policy documents
available have been reviewed.
The South East Queensland Regional Plan sets the overarching policy and
planning framework for managing growth in South East Queensland region. The
strategic directions outlined in the plan establish the broad policy framework for
achieving the regional vision set out in Toward Q2 and intended growth
management outcomes.
The vision is delivered by a series of desired regional outcomes, principles,
policies and programs to address growth and management of the region. The most
important desired regional outcome for Moreton Bay and Caboolture West is the
one for integrated transport.
Connecting SEQ 2031 has been developed as the guiding transport planning and
policy document to support the desired outcomes of South East Queensland
Regional Plan 2009 to 2031. It is one of the programmed activities under the
integrated transport desired regional outcome within the regional plan.
To deliver the 2031 transport vision, Connecting SEQ 2031 has established nine
key transport policy goals. These support the government’s strategic directions as
conveyed in Toward Q2, the Transport Coordination Plan and the South East
Queensland Regional Plan. Achieving these goals by 2031 would meet future
travel and economic development needs while supporting the desired lifestyle of
South East Queensland residents.
To support these key strategic documents are a number of other regional State
Government strategic planning and policy documents.
The Moreton Bay Integrated Transport Study (MITS) was undertaken by TMR in
2011 to develop a high level strategy to address Moreton Bay’s current and future
transport challenges. The strategy drew on the overarching objectives outlined in
Connecting SEQ and identified a range of potential actions to achieve those goals.
Many of the assumptions for future transport initiatives in this project are based
on either Connecting SEQ or MITS assumptions.

 | Issue | 30 January 2014 | Arup                                                                       Page 7
\\GLOBAL.ARUP.COM\AUSTRALASIA\BNE\PROJECTS\229000\229906-00 CABOOLTURE WEST
MODELLING\WORK\INTERNAL\DOCUMENTS\REPORTS\FINALREPORT\STUDY REPORT_FINAL.DOCX
Moreton Bay Regional Council Caboolture West Transport Modelling
Study Report
2.4.2 Local context
MBRC is currently developing a new Planning Scheme which will be based on
the next generation planning ‘Place Types’ concept. As this will be the first
Planning Scheme developed by MBRC as a combined entity, this provided
MBRC with the opportunity to provide a fresh direction with regards to the long-
term urban development patterns and transport requirements for the region.
To inform their planning scheme MBRC developed a Transport Network and
Corridor Strategy (TNCS) and Priority Infrastructure Plan in 2013.The purpose of
the TNCS was to provide a strategic framework and analysis by which to evaluate
the current and future operation of the primary transport networks and corridors
for all transport modes. The strategy aimed to have a focus on those transport
assets within the control of MBRC. The desired outcomes from the overall study
built upon the following principles for sustainable transport corridors:
1. Creation of a corridor network which is safe and efficient;
2. Creation of a corridor network which supports communities and places;
3. Creation of a corridor network that sustains and attracts economic activity;
4. Maximisation of transport choice;
5. Integration of the corridor network with the natural environment at all scales;
6. Respect of existing natural and built environments;
7. Emphasis of walking as the fundamental unit of the corridor network; and
8. Creation of harmony and integration with other transport networks.
| Issue | 30 January 2014 | Arup Page 8
\\GLOBAL.ARUP.COM\AUSTRALASIA\BNE\PROJECTS\229000\229906-00 CABOOLTURE WEST
MODELLING\WORK\INTERNAL\DOCUMENTS\REPORTS\FINALREPORT\STUDY REPORT_FINAL.DOCXMoreton Bay Regional Council Caboolture West Transport Modelling
Study Report
3 Transport Assessment Methodology
3.1 Overview
This section broadly outlines the transport assessment methodology and the
assumptions. Our analysis of future strategic travel on the wider transport network
uses the Moreton Bay Regional Strategic Transport Model. In summary the
assessment methodology includes the following steps:
• Assessment of challenges and issues;
• Assessment of alternative land use and transport scenarios for Caboolture
West;
• A multi-criteria assessment workshop with key stakeholders to choose
preferred scenario;
• A refinement of preferred scenario following the workshop;
• Detailed analysis of preferred scenario to identify the transport impacts of the
development and the required internal and external transport network to
support the development;
• Identification of required intersection upgrades required to accommodate
Caboolture West traffic demand using SIDRA, based on the traffic flows
forecast by MBRSTM;
• A staging assessment of when road and intersection infrastructure needs to be
implemented; and
• Development of indicative costing and staging of required transport
improvements.
3.2 The model
MBRC’s strategic transport model, the Moreton Bay Regional Strategic Transport
Model (MBRSTM), has been used to assess the future travel demand impacts of
the Caboolture West MPA on the wider transport network and inform the
transport network, measures and infrastructure required to accommodate the
activity generated by the development.
MBRSTM is a detailed 4 step transport model that uses demographic forecasts to
predict travel demand across the MBRC’s transport network for all modes for
current and future years. It is a strategic model that does not include detailed
operational parameters such as the representation of intersection delay or allow for
capacity constraints on public transport due to crowding. Other models are
developed for this purpose.
The model has been recently been revalidated to 2010 traffic levels to inform
future transport network requirements for MBRC’s Transport and Corridor
Network Strategy and Priority Infrastructure Plan.
The modelling assumes the following:
• The trend based model process has been used. That is the calibrated model has
been used without policy intervention.
| Issue | 30 January 2014 | Arup Page 9
\\GLOBAL.ARUP.COM\AUSTRALASIA\BNE\PROJECTS\229000\229906-00 CABOOLTURE WEST
MODELLING\WORK\INTERNAL\DOCUMENTS\REPORTS\FINALREPORT\STUDY REPORT_FINAL.DOCXMoreton Bay Regional Council Caboolture West Transport Modelling
Study Report
• The 2031 model has been used to assess the impact of all stages of Caboolture
West.
• The highway networks and public transport networks developed for the policy
based model were adopted as the base case without Caboolture West.
3.3 Assessment of transport issues
Initially the MBRSTM was used to assess existing travel characteristics and the
potential travel demand impacts generated by Caboolture West to broadly identify
accessibility and capacity issues. The version of the MBRSTM for this assessment
represented Caboolture West MPA with a transport zone definition which was
relatively coarse. The results of this assessment were documented in a technical
working paper attached as Appendix A. The outcome of the analysis was to
identify some potential transport scenarios to align with the land use scenarios.
3.4 Land use and transport scenario assessment
A range of development and transport scenarios was assessed using the MBRSTM
to inform the development of the Caboolture West Structure Plan. The scenarios
include variation of size and mix of development, the road network connections
and the level of public transport provision.
The scenarios include testing of the following:
• Two land use options;
• Three public transport options; and
• Two options for a southern connection (i.e. the West Moreton Corridor).
The key outcomes of the scenario tests are summarised as follows:
• Travel demand: The analysis suggested that a high proportion of trips to and
from Caboolture West would generally be contained within Caboolture and
Morayfield and most within the Moreton Bay Region;
• Public transport: Frequent bus services would be required to connect the
various centres within Caboolture West to key activity nodes within
Caboolture and Morayfield. Strong demand for park and ride at Burpengary
was forecast;
• Rapid transit: The analysis suggests that the provision of a high quality public
transport service between the Town Centre and Caboolture that provides
competitive travel times compared to the private vehicle would be attractive to
travellers; and
• Road network: The analysis highlighted potentially high demand for
Caboolture West traffic to access Morayfield Road to either travel south to the
Bruce Highway or access local employment zones. There was also strong
demand forecast to Caboolture Town Centre and industrial areas to the north
of Caboolture. The analysis highlighted potential external road upgrades
would be required to accommodate the additional demand, which is
documented in Section 5 of this report.
The scenario testing is documented in detail in Appendix B.
| Issue | 30 January 2014 | Arup Page 10
\\GLOBAL.ARUP.COM\AUSTRALASIA\BNE\PROJECTS\229000\229906-00 CABOOLTURE WEST
MODELLING\WORK\INTERNAL\DOCUMENTS\REPORTS\FINALREPORT\STUDY REPORT_FINAL.DOCXMoreton Bay Regional Council Caboolture West Transport Modelling
Study Report
3.5 Preferred scenario selection
A preferred scenario was selected by MBRC following a multi criteria assessment
and a workshop with key stakeholders. The preferred scenario selected, termed the
“Sustainable Town” was refined both from a land use and planning and transport
perspective to account for comments and further analysis following the scenario
workshop. The following sections document the key assumptions and analysis of
the preferred option.
3.6 Preferred scenario assumptions
3.6.1 Land Use
The modelling was based on the current 2031 land use forecasts for South East
Queensland with the addition of the proposed development for Caboolture West.
The transport zone definition for MBRSTM within Caboolture West was refined
from 28 to 130 zones to represent the proposed development more accurately.
Demographic forecasts for Caboolture West have been produced by MBRC for
every 5 years to 2051. Table 1 shows the percentage of the full development for
population, housing, school enrolments and jobs in Caboolture West at each five
year interval.
Table 1: Caboolture West Development Assumptions
Population Dwellings Enrolment Jobs
2016 8% 8% 7% 4%
2021 19% 18% 33% 11%
2026 37% 36% 41% 17%
2031 56% 55% 47% 26%
2036 70% 70% 51% 55%
2041 85% 86% 87% 77%
2046 94% 94% 93% 87%
2051 100% 100% 100% 97%
2056 100% 100% 100% 100%
Table 2 outlines in more detail the demographic assumptions in the transport
model for the Caboolture West MPA, whilst the assumed demographics are
shown spatially in Figure 4. Caboolture West is assumed to have an ultimate
population of 68,761 and, employment of 15,148 which incorporates a high
proportion of retail employment primarily in the town centre and to a lesser extent
in the neighbourhood centres. The other concentration of employment is planned
to be in the enterprise employment area at the north end of the site. The 16,882
enrolments are mostly for primary and secondary education.
| Issue | 30 January 2014 | Arup Page 11
\\GLOBAL.ARUP.COM\AUSTRALASIA\BNE\PROJECTS\229000\229906-00 CABOOLTURE WEST
MODELLING\WORK\INTERNAL\DOCUMENTS\REPORTS\FINALREPORT\STUDY REPORT_FINAL.DOCXMoreton Bay Regional Council Caboolture West Transport Modelling
Study Report
Figure 4 Demographics - population, employment, education
Table 2 Caboolture West demographic assumptions
Caboolture West
Demographic Input
Ultimate
Population 68,761
Dwellings 26,956
Average Occupancy 2.6
Employment 15,148
Professional 3,689
Service 1,749
Construction & Industry 3,109
Retail 6,542
Other 59
Enrolments 16,882
Primary 9,882
Secondary 5,200
Tertiary 1,800
| Issue | 30 January 2014 | Arup Page 12
\\GLOBAL.ARUP.COM\AUSTRALASIA\BNE\PROJECTS\229000\229906-00 CABOOLTURE WEST
MODELLING\WORK\INTERNAL\DOCUMENTS\REPORTS\FINALREPORT\STUDY REPORT_FINAL.DOCXMoreton Bay Regional Council Caboolture West Transport Modelling
Study Report
3.6.2 Transport projects
The model assumes the transport projects identified for the MBRC’s PIP for 2031
as a basis for the base case network to assess the impact of Caboolture West
development. The transport projects were identified using the policy based
version of MBRSTM which makes adjustments to the model’s forecasting process
to reflect MBRC’s mode split policy targets. The base case transport network also
draws on road improvements and public transport service and infrastructure
improvements identified in Connecting SEQ and the Moreton Bay Integrated
Transport Study (MITS).
Table 3 and Table 4 identify the most relevant projects included in the 2031 base
case transport scenario. The model outcomes presented in this report are
dependent on the assumed future transport network presented in these tables and
the results of the modelling may change if these assumptions are altered.
Table 3: Assumed public transport improvements
Future Public Transport Project 2031 Cab West
Moreton Bay Rail Line feeder bus services
North West Transport Corridor (NWTC)
Caboolture North Rail Station (incl. park’n’ride)
CSEQ bus routes (extracted from MITS model)
Northern Busway (Chermside to Bald Hills)
Kippa-Ring to Redcliffe High Frequency bus route
MITS recommended bus routes
Table 4: Selection of road improvements most relevant to Caboolture West
2031 Cab
Year Location Description
West
Modifications to park’n’ride nodes
2016 2016 Park’n’Ride modifications including updates to car parking
spaces
New overpass connecting into
2016 Francis Road Overpass
Gympie Road
2016 Kerr Road Overpass New overpass across Bruce Highway
Station Road, Burpengary
2016 Upgrade to 4 lanes divided
(Joyce Road to Progress Road)
Deception Bay Road (Bruce
2021 Upgrade to 4 lanes divided
Highway to Lipscombe Road)
Modifications to park’n’ride nodes
2021 2021 Park’n’Ride modifications including updates to car parking
spaces
Brown Street Pedestrian Path
2021 1.5 km walking/cycling route
(Elof Road to Brown Street)
Road network changes around
greenfield sites (North Lakes and
Moreton Bay Greenfill Sites
2021 Caboolture). North Lakes in
Network
preparation for North South Urban
Arterial
| Issue | 30 January 2014 | Arup Page 13
\\GLOBAL.ARUP.COM\AUSTRALASIA\BNE\PROJECTS\229000\229906-00 CABOOLTURE WEST
MODELLING\WORK\INTERNAL\DOCUMENTS\REPORTS\FINALREPORT\STUDY REPORT_FINAL.DOCXMoreton Bay Regional Council Caboolture West Transport Modelling
Study Report
2031 Cab
Year Location Description
West
Inner City Rail Stage 1
2021 (Fairfield-Exhibition Loop to New rail
Bowen Hills_
South Pine Road (Queens Road
2021 Upgrade to 4 lanes undivided
to Lily Street)
2021 Buchanan Road (entire length) Upgrade to 4 lanes divided
Caboolture River Road (Grant
2021 Upgrade to 4 lanes divided
Road to Morayfield Road)
South Pine Road (Queens Road
2021 Upgrade to 4 lanes undivided
to Camelia Avenue)
South Pine Road (Plucks Road
2026 Upgrade to 4 lanes undivided
to Bunya Road)
Modifications to park’n’ride nodes
2026 2026 Park’n’Ride modifications including updates to car parking
spaces
2031 Caboolture North Rail Station New rail station at Caboolture North
New green corridor (bus, pedestrian
Caboolture to Wamuran Green
2031 and cycle) from the existing
Corridor
Caboolture Rail Station to Wamuran
Extension of Pettigrew Street to
2031 Caboolture
Pumicestone Road
Cundoot Creek – New link from
2031 Caboolture South
Buchanan Road to Lower King Street
Continuation of Buchanan Road to
2031 Morayfield Morayfield Road with grade
separation at railway crossing.
Upgrade of Morayfield
2031 Morayfield Road/Uhlmann Road to 4 lanes from
Graham Road to the Bruce Highway
3.6.3 Caboolture West internal road network
The proposed internal road network (see Figure 5) for Caboolture West consists
of three main arterial routes, two east-west connections; Caboolture River Road,
and Bellmere Road, and a new north-south connection that would be an extension
of Williams Road from King Street to Caboolture River Road, connecting the
town centre and key employment areas.
Old North Road runs on the western side of the site and will be upgrade to a sub-
arterial connection between Wamuran and Rocksberg, intersecting with various
sub-arterial and collector roads to access Caboolture West.
The town centre, neighbourhood centres will be connected via a network of new
sub-arterial routes, supported by collector and local streets.
| Issue | 30 January 2014 | Arup Page 14
\\GLOBAL.ARUP.COM\AUSTRALASIA\BNE\PROJECTS\229000\229906-00 CABOOLTURE WEST
MODELLING\WORK\INTERNAL\DOCUMENTS\REPORTS\FINALREPORT\STUDY REPORT_FINAL.DOCXMoreton Bay Regional Council Caboolture West Transport Modelling
Study Report
Figure 5 Caboolture West Road hierarchy
3.6.4 Caboolture West external road connections
Analysis of the impact of the Caboolture West development was undertaken based
on the transport network assumptions outlined in Section 3.6.2.
External road connections servicing Caboolture West were assessed and a number
of upgrades were identified to accommodate the forecast traffic demand. The
assessment identified, as illustrated in Figure 6, the following existing roads will
need to be widened or extended:
• Bellmere Road- widened from 2 to 4 lanes from Caboolture West to King
Street;
• Caboolture River Road – widened from 2 to 4 lanes from Caboolture West to
Morayfield Road;
• Peterson Road – 2 lane extension connecting Petersen Road to Clark Road;
and
• Morayfield Road – widened from 4 to 6 lanes between Buchanan Road and
Lindsay Road.
| Issue | 30 January 2014 | Arup Page 15
\\GLOBAL.ARUP.COM\AUSTRALASIA\BNE\PROJECTS\229000\229906-00 CABOOLTURE WEST
MODELLING\WORK\INTERNAL\DOCUMENTS\REPORTS\FINALREPORT\STUDY REPORT_FINAL.DOCXMoreton Bay Regional Council Caboolture West Transport Modelling
Study Report
Figure 6 External road upgrades
Our assessment with Caboolture West assumed that increased road capacity was
provided in the West Moreton Corridor. A study is currently being undertaken by
the state to identify a preferred alignment for a West Moreton Corridor. For the
purpose of this study the West Moreton Corridor was assumed to consist of
improved traffic operations to/from Narangba along the route of Lindsay Road,
O’Brien Road, Station Road, Burpengary Road and Boundary Road (see Figure
7). The upgraded route assumes:
• Four lanes with a posted speed of 70km/hr;
• Improved crossing of the rail line at Lindsay Road; and
• Improved crossing of the rail line at Boundary Road to provide a high capacity
connection to Narangba Road.
The required intersection improvements on the external road network are
discussed in Section 5.
| Issue | 30 January 2014 | Arup Page 16
\\GLOBAL.ARUP.COM\AUSTRALASIA\BNE\PROJECTS\229000\229906-00 CABOOLTURE WEST
MODELLING\WORK\INTERNAL\DOCUMENTS\REPORTS\FINALREPORT\STUDY REPORT_FINAL.DOCXMoreton Bay Regional Council Caboolture West Transport Modelling
Study Report
Figure 7 Assumed West Moreton Corridor
3.6.5 Public Transport
The planning for Caboolture West was centred on providing good public transport
connections locally, to Caboolture and Morayfield and other regional centres. The
transport modelling identified the need for strong public transport provision to
service the Caboolture town centre and the Railway Station. The preliminary
assessment identified that providing a dedicated rapid transit corridor to connect
the Caboolture West town centre to the Caboolture town centre would provide
significant patronage uplift compared to on-road systems. The modelling did not
assess the relative merits of alternative modes for rapid transit. The assumption
for the purposes of the analysis was that the rapid transit corridor would be a
segregated bus corridor known as C-Bahn as shown in Figure 8. The C-Bahn
would accommodate three trunk services that would provide convenient access to
| Issue | 30 January 2014 | Arup Page 17
\\GLOBAL.ARUP.COM\AUSTRALASIA\BNE\PROJECTS\229000\229906-00 CABOOLTURE WEST
MODELLING\WORK\INTERNAL\DOCUMENTS\REPORTS\FINALREPORT\STUDY REPORT_FINAL.DOCXMoreton Bay Regional Council Caboolture West Transport Modelling
Study Report
the neighbourhood centres. A further extension from the Caboolture Railway
Station to Morayfield was also assumed. This is shown in the figure below as an
on-road connection along Morayfield Road, though there are a number of
alternatives that could be provided which would need further investigation in the
future.
Figure 8 C-Bahn corridor
Within Caboolture West, two levels of C-Bahn services were assumed:
• Three through routes would collect passengers in Caboolture West and
continue directly onto the C-Bahn. These would be at 7.5 minute headways
during peak periods, providing services on the C-Bahn at 2.5 minute average
headways.
• Several additional feeder services would collect passengers throughout
Caboolture West, connecting to the C-Bahn at the town centre. Passengers
would then need to transfer to travel further, but the high frequency of through
service on the C-Bahn means the transfer penalty would be minimised.
The public transport network modelled is highlighted in the figures below.
Individual service lines are shown in different colours Figure 9 and the service
frequencies are shown in Figure 10. The network included additional route
refinements in the areas surrounding Caboolture West to service Caboolture West
and other local growth areas. The public transport route refinements are discussed
in further detail in Appendix C.
The assumed bus services to Caboolture West would extend current or proposed
local services from Caboolture and Morayfield into Caboolture West. The
transport analysis indicated the importance of maintaining strong linkages
between Morayfield and Caboolture West as well as providing rapid transit to the
Caboolture town centre.
| Issue | 30 January 2014 | Arup Page 18
\\GLOBAL.ARUP.COM\AUSTRALASIA\BNE\PROJECTS\229000\229906-00 CABOOLTURE WEST
MODELLING\WORK\INTERNAL\DOCUMENTS\REPORTS\FINALREPORT\STUDY REPORT_FINAL.DOCXMoreton Bay Regional Council Caboolture West Transport Modelling
Study Report
Figure 9 Proposed public transport network and services (2031)
Figure 10 Modelled public transport frequency, AM Peak Hour 2031
| Issue | 30 January 2014 | Arup Page 19
\\GLOBAL.ARUP.COM\AUSTRALASIA\BNE\PROJECTS\229000\229906-00 CABOOLTURE WEST
MODELLING\WORK\INTERNAL\DOCUMENTS\REPORTS\FINALREPORT\STUDY REPORT_FINAL.DOCXMoreton Bay Regional Council Caboolture West Transport Modelling
Study Report
4 Ultimate Scenario Assessment
4.1 Introduction
This section outlines the predicted travel demand characteristics as forecast using
the MBRSTM for the ultimate Caboolture West development based on the
assumptions outlined in Section 3.
4.2 Travel demand
A summary of the forecast daily trip making characteristics of Caboolture West is
outlined in Table 5 showing the MPA is forecast to generate over 218,000 trips
during a typical weekday. The high provision of public transport, including C-
Bahn, is forecast to result in a relatively high public transport mode split of 12.9%
over the day.
Table 5 Trip generation by trip persons
Travel Mode Daily Trips Mode Split
Private vehicle 163,277 74.8%
Public transport 28,075 12.9%
Active transport (walking, cycling) 26,804 12.3%
Total 218,156 100%
Travel demand in the MBRSTM is disaggregated into eight trip purposes with the
proportion of daily travel from Caboolture West outlined in Table 6. The majority
of trips are categorised as “other non-home based” trips, this category is
associated with trips that are not connected with a home based journey, such as a
work to retail trip.
Table 6: Trips by trip purpose (daily trips)
Purpose Proportion
Other Non-home-based 25%
Home-based Work (white-collar) 20%
Home-based Other 18%
Home-based Education (Primary and Secondary) 15%
Home-based Shopping 15%
Home-based Work (blue-collar) 4%
Work- based work 2%
Home-based Education (Tertiary) 1%
Figure 11 outlines the forecast trip length profile of trips from Caboolture West
for the AM Peak. The average trip length is predicted to be 12 km.
| Issue | 30 January 2014 | Arup Page 20
\\GLOBAL.ARUP.COM\AUSTRALASIA\BNE\PROJECTS\229000\229906-00 CABOOLTURE WEST
MODELLING\WORK\INTERNAL\DOCUMENTS\REPORTS\FINALREPORT\STUDY REPORT_FINAL.DOCXMoreton Bay Regional Council Caboolture West Transport Modelling
Study Report
Trip Length Profile (AM Peak)
2500 100%
90%
2000 80%
Cummulative Trips (%)
Trips (PV)
70%
Cumulative Trips (%)
1500 60%
Trips
50%
1000 40%
30%
500 20%
10%
0 0%
0 20 40 60 80 100 120
Distance Traveled (km)
Figure 11: Trip length profile for vehicle trips from Caboolture West
4.3 Trip distribution
Analysis of the trips produced as part of the Caboolture West MPA showed that a
large proportion of the trips are forecast to be contained within Caboolture West
and Caboolture as reported in Table 7 for all modes. The locality boundaries used
in this analysis are shown in Figure 12.
The forecast containment of trips generated by the Caboolture West development
within Caboolture West itself is 50% for all modes, whereas for trips contained in
the wider Caboolture and Morayfield area this increases to 79%. The majority of
trips from Caboolture West, 90%, are forecast to travel to localities within the
Moreton Bay region. Of those that would travel to localities outside the region a
significant proportion would use public transport (about 40%), reflecting the
strong road connection between Moreton Bay and Brisbane.
Table 7 Proportion of Caboolture West trips contained within localities based on trip ends
Locality Trips PV PT Active Total
External 111,326 23,023 901 135,250
Caboolture West Internal 101,024 10,272 26,342 137,638
% internal 48% 31% 97% 50%
External 69,727 17,256 376 87,358
Inc. Caboolture Internal 142,624 16,039 26,868 185,530
% internal 67% 48% 99% 68%
External 42,264 13,647 88 55,998
Inc. Morayfield Internal 170,087 19,648 27,156 216,890
% internal 80% 59% 100% 79%
External 16,569 11,118 3 27,690
MBRC Internal 195,781 22,176 27,240 245,198
% internal 92% 67% 100% 90%
| Issue | 30 January 2014 | Arup Page 21
\\GLOBAL.ARUP.COM\AUSTRALASIA\BNE\PROJECTS\229000\229906-00 CABOOLTURE WEST
MODELLING\WORK\INTERNAL\DOCUMENTS\REPORTS\FINALREPORT\STUDY REPORT_FINAL.DOCXMoreton Bay Regional Council Caboolture West Transport Modelling
Study Report
Figure 12: Locality definitions for containment analysis
The distribution of traffic from Caboolture West is shown in Figure 13. It shows
that the a high proportion (81%) of trips would travel to destinations locally
within the Caboolture/ Morayfield area and only 10% of trips travelling to the
Brisbane area and the remainder would be distributed North, East and West.
The assigned distribution of traffic from Caboolture West is shown in Figure 14
for the AM Peak. It shows that the majority of vehicle trips from Caboolture West
would travel east towards Caboolture onto Morayfield Road to destinations in
Morayfield and to access the Bruce Highway to travel south. There were a large
number of trips terminating at the Burpengary Park n’ Ride train station as can be
observed by the sudden drop along Lindsay Road
| Issue | 30 January 2014 | Arup Page 22
\\GLOBAL.ARUP.COM\AUSTRALASIA\BNE\PROJECTS\229000\229906-00 CABOOLTURE WEST
MODELLING\WORK\INTERNAL\DOCUMENTS\REPORTS\FINALREPORT\STUDY REPORT_FINAL.DOCXMoreton Bay Regional Council Caboolture West Transport Modelling
Study Report
Figure 13 Forecast vehicle trip distribution from Caboolture West 2031
| Issue | 30 January 2014 | Arup Page 23
\\GLOBAL.ARUP.COM\AUSTRALASIA\BNE\PROJECTS\229000\229906-00 CABOOLTURE WEST
MODELLING\WORK\INTERNAL\DOCUMENTS\REPORTS\FINALREPORT\STUDY REPORT_FINAL.DOCXMoreton Bay Regional Council Caboolture West Transport Modelling
Study Report
Figure 14 Assigned vehicle trip distribution from Caboolture West (AM Peak)
4.4 Mode split
Table 8 shows the mode share as predicted by 2031 MBRSTM for the entire
model and separately for Caboolture West. It can be seen that the model forecasts
a high mode share for public and active transport in Caboolture West. It also
shows that the forecast mode share for Caboolture West exceeds MBRC’s current
policy target for public transport. This reflects that a high level of public transport
service is assumed to Caboolture West in 2031, including rapid transit that can
compete with car travel times.
Table 8 Mode share based on region of origin
Area Private Public Active
Vehicle Transport Transport
Moreton
82.8% 9.3% 8.0%
Bay Region
Caboolture
74.5% 13.0% 12.5%
West
MBRC
Policy 75.6% 10.8% 13.6%
Targets
4.5 Public transport
The forecast public transport volumes and volume to capacity ratios are shown in
Figure 15 and Figure 16 respectively for the morning and evening peak period.
The bandwidths in the plots represent the relative magnitude of trips whilst the
colours denote the volume and capacity (V/C) ratios as per Table 9. The plot
| Issue | 30 January 2014 | Arup Page 24
\\GLOBAL.ARUP.COM\AUSTRALASIA\BNE\PROJECTS\229000\229906-00 CABOOLTURE WEST
MODELLING\WORK\INTERNAL\DOCUMENTS\REPORTS\FINALREPORT\STUDY REPORT_FINAL.DOCXMoreton Bay Regional Council Caboolture West Transport Modelling
Study Report
indicates that there was a high demand for the C-Bahn service between
Caboolture West and Caboolture. It also illustrates that the wider public transport
network was underutilised and there is spare capacity.
Table 9: PT volume to capacity ratio colour scale
Colour V/C Range
Green < 0.50
Yellow 0.50 – 0.75
Orange 0.75 - 0.85
Light red 0.85 – 1.00
Dark red > 1.00
Figure 15: PT volume and volume to capacity ratios, AM peak (excluding rail)
| Issue | 30 January 2014 | Arup Page 25
\\GLOBAL.ARUP.COM\AUSTRALASIA\BNE\PROJECTS\229000\229906-00 CABOOLTURE WEST
MODELLING\WORK\INTERNAL\DOCUMENTS\REPORTS\FINALREPORT\STUDY REPORT_FINAL.DOCXMoreton Bay Regional Council Caboolture West Transport Modelling
Study Report
Figure 16: PT volume and volume to capacity ratios, PM peak (excluding rail)
4.6 Traffic impact
The forecast impact of the Caboolture West MPA on the assumed 2031 road
network is not surprisingly significant given that the development is forecast to
generate 163,000 vehicle trips on a typical weekday. The impact would be
minimised by the high provision of public transport and active modes and the
relatively high level of trip containment forecast. Figure 17 and Figure 18 show
the impact of the traffic generated by the full development of Caboolture West
development on the external road network in 2031 for the morning peak period
and across the day respectively. Whilst it should be noted that the full
development of Caboolture West is not likely to be realised until 2061, it shows
some interesting trends:
• Strong demand to the north increasing traffic volumes on both King Street and
the D’Aguilar Highway;
• Strong demand will increase traffic volumes on Bellmere Road to access
Caboolture town centre;
• High demand on the various routes including Caboolture River Road to access
Morayfield;
• Strong demand south to Burpengary via a new southern connection along
Petersen Road to access the park and ride facility (noting limited forecast
spaces available at Caboolture Town Centre and Morayfield); and
| Issue | 30 January 2014 | Arup Page 26
\\GLOBAL.ARUP.COM\AUSTRALASIA\BNE\PROJECTS\229000\229906-00 CABOOLTURE WEST
MODELLING\WORK\INTERNAL\DOCUMENTS\REPORTS\FINALREPORT\STUDY REPORT_FINAL.DOCXMoreton Bay Regional Council Caboolture West Transport Modelling
Study Report
• The model indicated that Grant Road could be used as to access Morayfield
Road from River Drive and Torrens Road.
Figure 17: Difference Plot With and Without Caboolture West - AM Peak 2031
| Issue | 30 January 2014 | Arup Page 27
\\GLOBAL.ARUP.COM\AUSTRALASIA\BNE\PROJECTS\229000\229906-00 CABOOLTURE WEST
MODELLING\WORK\INTERNAL\DOCUMENTS\REPORTS\FINALREPORT\STUDY REPORT_FINAL.DOCXMoreton Bay Regional Council Caboolture West Transport Modelling
Study Report
Figure 18: 4 Difference Plot With and Without Caboolture West – Daily Volumes
Plots of the forecast traffic volumes and volume to capacity (V/C) ratios for the
AM peak periods modelled are given in Figure 19 and Figure 22 without and
with the Caboolture West development respectively. Figure 21 and Figure 22
show the traffic volumes and volume to capacity ratio for the road network for the
PM Peak period without and with the Caboolture West development respectively.
As for the public transport volumes and V/C ratio plots presented in Section 4.1,
the bandwidths in the plots represent the relative magnitude of trips whilst the
colours denote the V/C ratios as per Table 9. The light red indicates roads
approaching or at congestion and the dark red indicates severe congestion. In both
the AM peak and PM peak periods increased congestion is forecast on key roads
in Caboolture such as Morayfield Road, Oakley Flat Road and the D’Aguilar
Highway due to background growth to 2031. Of particular note is that the Bruce
Highway is forecast to operate with a V/C ratio over 1 on both directions.
These figures show that the Caboolture West MPA would increase traffic levels
and congestion on key arterials particularly on key access roads to Caboolture
West. However the identified external road improvements generally result in
adequate capacity on key routes to accommodate the additional traffic flows,
noting that some locations are forecast to be quite congested in the base case
scenario.
| Issue | 30 January 2014 | Arup Page 28
\\GLOBAL.ARUP.COM\AUSTRALASIA\BNE\PROJECTS\229000\229906-00 CABOOLTURE WEST
MODELLING\WORK\INTERNAL\DOCUMENTS\REPORTS\FINALREPORT\STUDY REPORT_FINAL.DOCXMoreton Bay Regional Council Caboolture West Transport Modelling
Study Report
Figure 19: Traffic volume and v/c ratio base case 2031 AM Peak
Figure 20: Traffic volume and v/c ratios, with Caboolture West 2031 AM peak
| Issue | 30 January 2014 | Arup Page 29
\\GLOBAL.ARUP.COM\AUSTRALASIA\BNE\PROJECTS\229000\229906-00 CABOOLTURE WEST
MODELLING\WORK\INTERNAL\DOCUMENTS\REPORTS\FINALREPORT\STUDY REPORT_FINAL.DOCXMoreton Bay Regional Council Caboolture West Transport Modelling
Study Report
Figure 21: Traffic volume and v/c ratio, base case, 2031 PM Peak
Figure 22: Traffic volume and v/c ratio, with Caboolture West, 2031 PM peak
| Issue | 30 January 2014 | Arup Page 30
\\GLOBAL.ARUP.COM\AUSTRALASIA\BNE\PROJECTS\229000\229906-00 CABOOLTURE WEST
MODELLING\WORK\INTERNAL\DOCUMENTS\REPORTS\FINALREPORT\STUDY REPORT_FINAL.DOCXMoreton Bay Regional Council Caboolture West Transport Modelling
Study Report
A plot of the travel speeds around Caboolture for the AM peak period is given in
Figure 23. The image shows a significant reduction in travel speed surrounding
the town centres with auto speeds around 20 km/hr. The connections between
Caboolture West and Caboolture also show some strain with travel speeds around
40 km/hr. The PM Peak period displays similar travel speed characteristics.
Figure 23 Travel speeds, AM Peak
| Issue | 30 January 2014 | Arup Page 31
\\GLOBAL.ARUP.COM\AUSTRALASIA\BNE\PROJECTS\229000\229906-00 CABOOLTURE WEST
MODELLING\WORK\INTERNAL\DOCUMENTS\REPORTS\FINALREPORT\STUDY REPORT_FINAL.DOCXMoreton Bay Regional Council Caboolture West Transport Modelling
Study Report
5 Intersection improvements
5.1 Approach
This section summarises the approach to assess the intersection upgrade
requirements to accommodate the traffic demand generated by the Caboolture
West MPA.
5.2 Desired Standard of Service
The capacity of the road network has been assessed using desired standards of
service defined within MBRC’s new draft planning scheme. It aligns with
MBRC’s recent Transport and Corridor Network Strategy. A Desired Standard of
Service (DSS) has been defined separately for each place type using place type
groupings as summarised below.
• Place Type Grouping 1: activity centres;
• Place Type Grouping 2: urban neighbourhoods, next generation suburban
neighbourhoods, suburban neighbourhoods, enterprise employment areas,
rural townships, coastal villages; and
• Place Type Grouping 3: rural residential, rural areas.
It should be noted that the suburban neighbourhoods place type is grouped in
Place Type Group 3.
The DSS was based on an upper limit level of service, defined using degree of
saturation (DOS), applicable during peak travel periods. This was defined for each
place type grouping shown in Table 10.
Table 10: Desired standard of service for road capacity
Place Type Grouping
1 2 3
Desired Standard of Service D/E D C
(Level of Service)
Intersection Signalised 0.95 0.95 0.90
DOS
Roundabout 0.95 0.95 0.85
Priority 0.90 0.90 0.80
The DSS recognises the different expectations for acceptable peak period traffic
conditions across the different place types. For example, in built-up areas such
activity centres, a lower level of service is tolerated compared to rural areas.
Council has adopted level of service definitions for the DSS that are generally
lower in activity centres and urban areas than has been used in the previous PIPs
for Caboolture, Pine Rivers and Redcliffe. This aligns with Council’s objectives
for creating more sustainable transport outcomes such as an increased mode share
of walking, cycling and public transport.
| Issue | 30 January 2014 | Arup Page 32
\\GLOBAL.ARUP.COM\AUSTRALASIA\BNE\PROJECTS\229000\229906-00 CABOOLTURE WEST
MODELLING\WORK\INTERNAL\DOCUMENTS\REPORTS\FINALREPORT\STUDY REPORT_FINAL.DOCXMoreton Bay Regional Council Caboolture West Transport Modelling
Study Report
5.2.1 Deficiency Identification Process
The intersection deficiencies and improvements were determined using SIDRA
analysis, using peak hour traffic volumes predicted by the strategic model. An
intersection was identified as being deficient if the degree of saturation of any
movement exceeded the thresholds shown in Table 10 and if more than 10% of
the traffic was attributed to Caboolture West.
As the MBRSTM is a strategic model that does not explicitly model intersection
delay or capacity, a process to ‘flag’ potentially deficient intersections using the
model output was used to select candidate intersection for analysis in SIDRA.
The process to select intersections for SIDRA analysis used the modelled mid-
block link capacity parameter to calculate a volume to capacity ratio (v/c) of the
approaches (links) to intersections. Intersections were then selected for SIDRA
analysis if:
• 1 leg exceeded a v/c of 0.8; or
• 2 legs exceeded a v/c of 0.64; or
• 3 legs exceeded a v/c of 0.48.
The results of the selection process are shown in Appendix D showing the
intersections that were selected and those that were subsequently identified as
being deficient.
The determination of the upgrade requirements follows the process detailed in
Figure 24.
Does Intersection
Fail with Caboolture
West?
YES NO
Does Intersection fail
Does not need any
without Caboolture
further assessment
West
YES NO
Requires a Do
Minimum Upgrade Requires a
(after Do Min Caboolture West
upgrade, repeat flow specific upgrade
chart with Do Min)
Figure 24 SIDRA assessment steps
| Issue | 30 January 2014 | Arup Page 33
\\GLOBAL.ARUP.COM\AUSTRALASIA\BNE\PROJECTS\229000\229906-00 CABOOLTURE WEST
MODELLING\WORK\INTERNAL\DOCUMENTS\REPORTS\FINALREPORT\STUDY REPORT_FINAL.DOCXMoreton Bay Regional Council Caboolture West Transport Modelling
Study Report
5.3 Deficiencies and Solutions
The MBRSTM identified a number of intersections as potentially being deficient
as illustrated in Figure 25. This list was then evaluated using SIDRA resulting in
the identification of 34 intersections that would not meet the level of service
criteria in 2031 with Caboolture West, as shown in Figure 26. This provided the
basis for costing the external road network upgrades.
The deficiency analysis identified several intersections, such as Morayfield
Road/Caboolture River Road and Morayfield/Walkers Road intersections that
would require significant upgrades by 2031 without Caboolture West. The impact
of additional traffic from Caboolture West may require consideration of further
capacity improvements including grade separation or lane management which
would have wider implications and require a more comprehensive and holistic
assessment. Such major upgrades are considered outside the scope of the
deficiency analysis and have not been costed.
The analysis and proposed intersection layouts of the candidate intersections are
outlined in detail in Appendix D.
Figure 25 Intersections flagged for assessment
| Issue | 30 January 2014 | Arup Page 34
\\GLOBAL.ARUP.COM\AUSTRALASIA\BNE\PROJECTS\229000\229906-00 CABOOLTURE WEST
MODELLING\WORK\INTERNAL\DOCUMENTS\REPORTS\FINALREPORT\STUDY REPORT_FINAL.DOCXMoreton Bay Regional Council Caboolture West Transport Modelling
Study Report
Figure 26: Intersections requiring upgrade due to Caboolture West MPA
| Issue | 30 January 2014 | Arup Page 35
\\GLOBAL.ARUP.COM\AUSTRALASIA\BNE\PROJECTS\229000\229906-00 CABOOLTURE WEST
MODELLING\WORK\INTERNAL\DOCUMENTS\REPORTS\FINALREPORT\STUDY REPORT_FINAL.DOCXMoreton Bay Regional Council Caboolture West Transport Modelling
Study Report
6 Staging Assessment
6.1 Approach
The approach to assess the staging requirements of road upgrades involved the
following steps:
• MBRC identified the assumed development levels of Caboolture West at 5
year intervals to ultimate build out at 2056;
• An MBRSTM model run was undertaken for each 5 year Caboolture West
development interval using the 2031 base demand to estimate traffic volumes
on the internal and external road networks;
• SIDRA analysis for each 5 year interval was undertaken on the intersections
identified as requiring upgrades as outlined in Section 5; and
• The deficiency identification process was used to identify upgrade
requirements at each year for mid-block and intersection upgrades.
6.2 Assumptions
6.2.1 Land use
The development assumptions for Caboolture West are outlined in Table 11 in 5
year intervals to 2056.
Table 11: Development and Trip Generation Assumptions
Mode Share
Population Dwellings Enrolment Jobs Trip Gen PV PT Active
(total)
2016 8% 8% 7% 4% 11,584 75% 13% 12%
2021 19% 18% 33% 11% 30,197 76% 10% 14%
2026 37% 36% 41% 17% 73,313 78% 10% 12%
2031 56% 55% 47% 26% 108,810 75% 14% 11%
2036 70% 70% 51% 55% 139,001 72% 16% 12%
2041 85% 86% 87% 77% 181,388 74% 13% 13%
2046 94% 94% 93% 87% 198,424 74% 13% 13%
2051 100% 100% 100% 97% - - - -
2056 100% 100% 100% 100% 218,196 75% 13% 12%
As shown in Figure 27, Caboolture West is expected to experience steady growth
in the population and number of dwellings, whilst the highest rate of increase in
jobs and enrolments is expected to occur around 2031 and 2036 respectively.
| Issue | 30 January 2014 | Arup Page 36
\\GLOBAL.ARUP.COM\AUSTRALASIA\BNE\PROJECTS\229000\229906-00 CABOOLTURE WEST
MODELLING\WORK\INTERNAL\DOCUMENTS\REPORTS\FINALREPORT\STUDY REPORT_FINAL.DOCXYou can also read