REGIONAL AUTOMOTIVE MANUFACTURING PROFILE: London/Stratford-Bruce Peninsula - The Automotive Policy Research Centre
←
→
Page content transcription
If your browser does not render page correctly, please read the page content below
REGIONAL AUTOMOTIVE
                  MANUFACTURING PROFILE:
                  London/Stratford-Bruce Peninsula

The project is a collaboration of the Canadian Skills Training and Employment Coalition,
      Prism Economics and Analysis, and the Automotive Policy Research Centre.

October 2019
This report was prepared for the Auto Labour Market Information (LMI) Project.

 The goal of the Auto LMI project is to help stakeholders better understand the
 automotive labour market. The Project will create industry-validated, regional,
 occupational supply and demand analyses and forecasts and skill profiles for
 skilled trades and other key skilled occupations in the broader automotive sector
 including vehicle assemblers, parts manufacturers and technology companies
 that supply the industry. The project will also examine various labour market
 trends in the sector and facilitate discussions among stakeholders about how to
 address any forecasted skills shortages and other labour market challenges. The
 planned outcome of the project is enhanced regional LMI that will support
 colleges, employers, policy makers and other stakeholders in taking practical
 steps to address skills shortages and other labour market challenges in the
 automotive sector.

 This project is funded by the Government of Canada’s Sectoral Initiatives
 Program. The opinions and interpretations in this publication are those of the
 author(s) and do not necessarily reflect those of the Government of Canada.

 Canadian Skills Training and Employment Coalition, cstec.ca

 Prism Economics and Analysis, prismeconomics.com

 Automotive Policy Research Centre, automotivepolicy.ca

 October 2019

Automotive Industry Labour Market Analysis: Regional Automotive Manufacturing Profile – London/Stratford-Bruce Peninsula   2
Table of Contents
Executive Summary .............................................................................................................................. 5
Project Background ............................................................................................................................... 6
Introduction .............................................................................................................................................. 9
Regional Economy.................................................................................................................................. 9
Regional Labour Considerations ..................................................................................................... 12
   Population, Age Distribution and Regional Diversity .............................................................................. 12

   Educational Attainment .......................................................................................................................... 16

   Labour Market Activity ........................................................................................................................... 16

Regional Automotive Manufacturing Analysis ........................................................................... 19
   Profile of Automotive Manufacturing Employment ............................................................................... 20

   Profile of Automotive Manufacturing Employers ................................................................................... 21

   Automotive Manufacturing Labour Market ........................................................................................... 22

   Competition from Other Industries ........................................................................................................ 25

   Automotive Manufacturing Demographics ............................................................................................ 26

Automotive Industry Labour Market Analysis: Regional Automotive Manufacturing Profile – London/Stratford-Bruce Peninsula                               3
This page has been left blank for double-sided copying.

Automotive Industry Labour Market Analysis: Regional Automotive Manufacturing Profile – London/Stratford-Bruce Peninsula   4
Executive Summary

The London/Stratford-Bruce Peninsula region is comprised of the Economics Regions (ERs) of London
and Stratford-Bruce Peninsula. The region’s GDP was an estimated $48 billion in 2018, 18% of which was
generated by the manufacturing sector. Manufacturing is also a major employer in the region,
accounting for 14% of the total labour force, including 4% from automotive manufacturing. The region
has a positive economic outlook, with annual GDP growth of at least 2.0% projected through 2029.
However, the region’s manufacturing sector is expected to see its GDP growth slow in the coming years.

The London/Stratford-Bruce Peninsula region’s population was an estimated 1 million in 2018. Healthy
population growth is expected in the region through 2025 before slowing in the latter half of the next
decade. Population growth will likely be driven primarily by migration into the region as a declining birth
rate means little natural population change. The region is expected to see an aging trend in its
population, with the share of the population aged 65 years and over projected to increase from 18% in
2016 to 24% by 2030. The region is also expected to see its unemployment fall from 6.7% in 2016 to
5.5% by 2020 before stabilizing over the coming decade.

The London/Stratford-Bruce Peninsula region’s automotive manufacturing industry employed an
estimated 24,200 workers across 93 businesses in 2018, based on findings from industry contacts,
company websites, industry literature and other sources of publicly available data. Employment in the
past five years is estimated to have ranged from a low of 22,600 in 2013 to a peak of 24,400 in 2017. The
region is home to three assembly plants that employed an estimated 5,900 workers in 2018. A total 64
parts suppliers located in the London ER employed nearly 12,000 workers while 26 suppliers in the
Stratford-Bruce Peninsula employed an additional 6,300. The region’s largest automotive
manufacturing-related employers include Toyota, General Motors and Magna International.

Automotive Industry Labour Market Analysis: Regional Automotive Manufacturing Profile – London/Stratford-Bruce Peninsula   5
Project Background
The automotive industry is critically important to Canada’s economic well-being. Despite a declining
trend over the past decade, Canada still produced over 2 million vehicles in 2018. Furthermore, vehicle
assembly plants have the capacity to build over 2.3 million vehicles annually. The industry directly
accounted for over 8% of Canada’s manufacturing GDP and 17% of Ontario’s manufacturing GDP in
2017. The industry also contributes to Canada’s economy through expenditures on capital, which
totaled $1.7 billion as of 2017, and research & development, where businesses spent an additional $265
million in 2018. However, expenditure levels in both cases have dropped off since the early to mid-
2000s. Finally, Canada’s automotive industry is deeply tied to the global market through foreign trade.
The majority of vehicles produced in Canada are exported, mostly to the United States. The U.S. is also
the top export destination for automotive parts and components manufactured domestically. Canada
also imports vehicles and parts, mainly from the U.S. and Mexico but also from Japan, Germany, South
Korea and China. Although Canada has historically maintained a trade surplus in vehicles despite a trade
deficit in parts it faced a deficit in both sub-sectors in 2018, leading to a total automotive trade deficit of
$24.6 billion.

The automotive industry is one of the key drivers of innovation in the advanced manufacturing sector and
it increasingly spurs innovation across a wide range of industries. In addition to developing new
manufacturing technologies and production systems that will increase productivity and competitiveness,
the industry is developing innovative solutions to challenges in vehicle connectivity and advanced driver
assistance systems and is breaking new ground in vehicle light-weighting and alternative propulsion to
reduce greenhouse gas (GHG) emissions. A recent automotive advisory report outlined how the industry
can achieve its future goals. It identified talent and skills development as key to industry’s success going
forward and recommended a detailed analysis of the industry’s workforce1. Similarly, the Canadian
Automotive Partnership Council (CAPC) encouraged industry to work with government and its agencies
to invest in both current and future workforces in its most recent “Call for Action” report2.

Since talent and skills will be a driving force in enabling this innovation and facilitating the industry’s future
prosperity, it is important to undertake a comprehensive analysis of the workforce required to design and
build the new technology intensive vehicles, parts, and systems of today and tomorrow. Accordingly, the
Canadian Skills Training and Employment Coalition (CSTEC) and the Automotive Policy Research Centre
(APRC) are undertaking a comprehensive labour market analysis of the automotive industry and its supply
chain. The project is funded by the Government of Canada’s Sectoral Initiatives Program (SIP) and will be
completed over a three-year period.

Under the North American Industry Classification System (NAICS) automotive manufacturing is
traditionally defined as being comprised of two main sub-sectors: motor vehicle assembly (NAICS 3361),
which includes chassis manufacturing, and motor vehicle parts manufacturing (NAICS 3363). These sub-
sectors directly employ a combined 125,000 Canadians, based on data collected through the 2016
Census. However, this definition of the industry understates the workforce because it excludes
establishments that have been misclassified by Statistics Canada as belonging to a non-automotive
NAICS code. Misclassification occurs because many of these establishments dedicate only a portion of

1
    Tanguay, “Drive to Win”
2
    Canadian Automotive Partnership Council (CAPC), “A Call for Action: II

Automotive Industry Labour Market Analysis: Regional Automotive Manufacturing Profile – London/Stratford-Bruce Peninsula   6
their output to automotive-related activities and are not always present within the automotive supply
chain3. A 2017 report by the APRC profiling the automotive manufacturing industry in Canada identified
over 200 automotive parts manufacturing establishments that were assigned a NAICS industry code
other than 3361 or 33634. The APRC’s estimates of automotive manufacturing employment, which
supplemented Statistics Canada data with establishment-level estimates for businesses that have been
misclassified, placed the industry’s workforce at over 140,000 people as of 2016.
Rather than limiting automotive manufacturing to Statistics Canada’s two main automotive
manufacturing NAICS codes, this project will instead broaden the definition of the sector to include
producers in the supply chain that have been classified in non-automotive industries. This broader
definition of automotive manufacturing will include establishments in the following categories:
1. OEM Vehicle Assembly – Car and light-duty truck assembly plants owned by Original Equipment
Manufacturers (OEMs) including Ford, Fiat Chrysler Automobiles (FCA), Toyota, Honda and
General Motors.
2. OEM Parts Suppliers - Motor vehicle parts and components manufacturing plants owned by
OEMs. These include facilities that produce internal combustion engines, transmissions, cast
wheels and other structural metal components, and plastic or composite interior or exterior
trim and mouldings.
3. Primary Independent Parts Suppliers – Establishments whose primary purpose is to supply
parts and components or provide value-added services (e.g. sub-assembly, sequencing) to the
supply chain of OEMs.
4. Diversified Independent Parts Suppliers – Establishments that supply OEMs or primary parts
suppliers but who also supply a number of other industries.
5. Automotive Tooling and Automation – Establishments that provide machine tools, dies, moulds
and/or automation equipment (e.g. welding cells, presses, complete assembly lines) to OEMs
and parts suppliers.
6. Bus and Heavy Truck – Establishments that manufacture buses, medium-duty trucks and/or
heavy-duty trucks, or whose primary purpose is to supply parts and components to busy and
heavy truck manufacturers.
7. Automotive Technology – Establishments that build or develop automotive technologies,
including those that are included in the vehicle (e.g. embedded software), in the production
process (e.g. systems that monitor the assembly line) and/or in infrastructure (e.g. electric
vehicle charging stations).
8. Raw Materials – Establishments that are primarily engaged in the production and processing of
raw materials (e.g. steel, rubber, glass) used in automotive manufacturing.
It should be noted that while some establishments could be included within more than one of these
categories, they are ultimately assigned to only one. Establishments are classified based on the research
and expertise of the project team.
3
Sweeney & Mordue, “The Restructuring of Canada’s Automotive Industry, 2005-2014”
4
Sweeney, “A Profile of the Automotive Manufacturing Industry in Canada, 2012-2016”
Automotive Industry Labour Market Analysis: Regional Automotive Manufacturing Profile – London/Stratford-Bruce Peninsula 7The following industries will be included as part of the broader definition of the sector, in addition to the
two main automotive manufacturing NAICS codes:
• Paint, coating and adhesive • Coating, engraving, cold and heat
manufacturing (NAICS 3255) treating and allied activities (NAICS 3328)
• Plastic product manufacturing (NAICS • Computer and peripheral equipment
3261) manufacturing (NAICS 3341)
• Rubber product manufacturing (NAICS • Communications equipment
3262) manufacturing (NAICS 3342)
• Glass and glass product manufacturing • Semiconductor and other electronic
(NAICS 3272) component manufacturing (NAICS 3344)
• Iron and steel mills and ferro-alloy • Navigational, measuring, medical and
manufacturing (NAICS 3311) control instruments manufacturing
(NAICS 3345)
• Steel product manufacturing from • Electric lighting equipment
purchased steel (NAICS 3312) manufacturing (NAICS 3351)
• Foundries (NAICS 3315) • Electrical equipment manufacturing
(NAICS 3353)
• Forging and stamping (NAICS 3321) • Other electrical equipment and
component manufacturing (NAICS 3359)
• Cutlery and hand tool manufacturing • Architectural, engineering and related
(NAICS 3322) services (NAICS 5413)
• Architectural and structural metals • Computer systems design and related
manufacturing (NAICS 3323) services (NAICS 5415)
• Hardware manufacturing (NAICS 3325) • Management, scientific and technical
consulting services (NAICS 5416)
• Machine shops, turned product, and • Motor vehicle and motor vehicle parts
screw, nut and bolt manufacturing and accessories merchant wholesalers
(NAICS 3327) (NAICS 415)
One of the central challenges of this project will be to understand the links between companies in these
industries and those included in the primary automotive NAICS codes. A two-pronged approach will be
used to ensure the broader definition of the sector closely reflects the true profile of the Canadian
automotive industry:
1. A bottom up approach will use an establishment-level database to identify individual producers
that are involved in the automotive supply chain.
2. A top down approach will use Statistics Canada’s input-output tables, which track inter-industry
transactions, to better understand the contributions to employment and output that
establishments from non-automotive NAICS codes make to the sector.
Preliminary estimates based on this approach indicate the broader automotive manufacturing sector
employed roughly 177,000 workers in Canada as of 2015.
Automotive Industry Labour Market Analysis: Regional Automotive Manufacturing Profile – London/Stratford-Bruce Peninsula 8Introduction
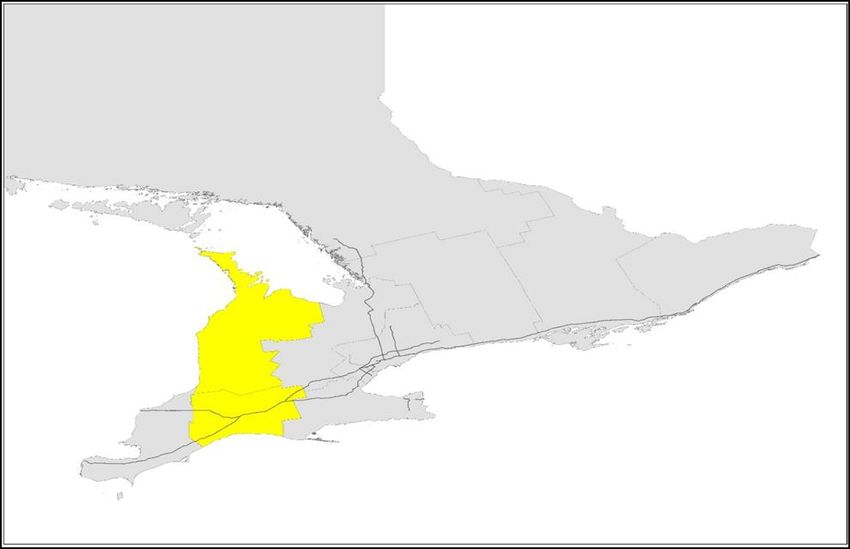
The London/Stratford-Bruce Peninsula region is an aggregate region comprised of two Economic
Regions (ERs) as defined by Statistics Canada: the London ER and the Stratford-Bruce Peninsula ER. The
London ER is the larger of the two regions and includes the cities of London and St. Thomas. The
Stratford-Bruce Peninsula ER includes the Perth, Huron, Bruce and Grey counties. Taken together they
are home to approximately 7% of Ontario’s population and cover a land area of nearly 21,500 square
kilometers. The region includes Highways 401 and 402, major trade routes between Canada and the
United States.
This regional profile includes three main sections. First, a discussion of the regional economy, including
outlooks for GDP. Next, a section outlining trends in the region’s population, demographic
characteristics and overall workforce. Finally, an overview of the region’s automotive manufacturing
industry, including key employers and occupations.
All regional data presented in this profile are aggregates (or weighted averages where appropriate) of
ER-level data for London and Stratford-Bruce Peninsula. Except where noted, data on the automotive
manufacturing industry refers to Statistics Canada’s two main industry codes for motor vehicle assembly
(NAICS 3361) and parts manufacturing (NAICS 3363).
Regional Economy
The London/Stratford-Bruce Peninsula region’s GDP totaled an estimated $48 billion dollars in 2018.
Manufacturing was the largest single contributor to the region’s GDP of any sector, accounting for
nearly one-fifth (18%) or approximately $8.7 billion. The next largest sector, real estate and rental and
leasing, accounted for 10% of the regional economy. Other major sectors in the region include
construction (8% of GDP), finance and insurance (8%), and health care and social services (8%).
Regional GDP Shares by Sector, 2018
Utilities, 5%
Construction, 8%
Other, 36%
Manufacturing, 18%
Wholesale trade, 6%
Retail trade, 5%
Health, social services,
8%
Finance, insurance, 8%
Education, 6% Real estate and rental
and leasing , 10%
Source: Canadian Skills Training & Employment Coalition, Metro Economics
Automotive Industry Labour Market Analysis: Regional Automotive Manufacturing Profile – London/Stratford-Bruce Peninsula 9The region’s largest sectors by workforce size include manufacturing (14% of total regional labour force),
health care and social assistance (13%) and retail trade (11%). While these industries are prominent in
both the London and Stratford-Bruce Peninsula ERs there are noticeable differences in the distribution
of their workforces. The London ER workforce is concentrated in services sectors such as education and
accommodation and food services, which account for 8% and 7% of the region’s labour force
respectively. Conversely, the workforce in the Stratford-Bruce Peninsula ER is built on goods-producing
sectors such as agriculture and construction, each of which accounts for 9% of the region’s labour force.
Regional Labour Force Shares by Sector, 2016
Motor vehicle
manufacturing, 4% Other manufacturing,
10%
Agriculture, forestry,
Other, 31% fishing and hunting, 5%
Construction, 8%
Retail trade, 11%
Accommodation and Professional, scientific
food services, 7% and technical services,
5%
Health care and social Educational services,
assistance, 13% 7%
Source: Canadian Skills Training & Employment Coalition, Statistics Canada
The region’s economic outlook is expected to be positive over the coming decade. Regional GDP is
expected to grow 2.6% in 2019 and 2.0% in 2020, surpassing $50 billion. Furthermore, annual GDP
growth of at least 2.0% is projected for every year from 2019 to 2029, surpassing $60 billion, with 1.9%
growth projected in 2030.
Automotive Industry Labour Market Analysis: Regional Automotive Manufacturing Profile – London/Stratford-Bruce Peninsula 10Total Regional GDP Outlook, 2016-2030
70,000 3.0%
Forecast
60,000 2.5%
50,000
2.0%
40,000
1.5%
30,000
1.0%
20,000
10,000 0.5%
0 0.0%
2016 2017 2018 2019 2020 2021 2022 2023 2024 2025 2026 2027 2028 2029 2030
Total GDP ($2012 millions) Annual GDP Growth Rate (%)
Source: Canadian Skills Training & Employment Coalition, Metro Economics
While the region’s overall GDP growth outlook is healthy, projections by sector vary significantly. In the
near term, industries such as wholesale trade (4.4%), finance and insurance (3.6%), and accommodation
and food services (3.6%) have experienced strong GDP growth and will continue to do so through 2020.
Agriculture, forestry, fishing and hunting (4.6%) is expected to experience the strongest growth between
2021 and 2025, while utilities (0.7%) and government services (0.8%) are expected to see little growth
during the same period. Both agriculture (4.4%) and food services (4.1%) are projected to continue their
strong growth over the 2026 to 2030 period. The manufacturing sector, which includes automotive
manufacturing, is expected to see its GDP growth slow in the coming years. While the sector’s GDP is
expected to be 2.1% larger in 2020 than 2016, growth is projected to fall to 1.9% for the 2021-2025
period and 1.7% for the 2026-2030 period.
Automotive Industry Labour Market Analysis: Regional Automotive Manufacturing Profile – London/Stratford-Bruce Peninsula 11Annual Average Regional GDP Growth by Sector, 2016-2030
Government
Other services
Accommodation, food
Arts, entertainment, recreation
Health, social services
Education
Other business services
Professional, scientific, technical services
Real estate and rental and leasing
Finance, insurance
Information, culture
Transportation, warehousing
Retail trade
Wholesale trade
Manufacturing
Construction
Utilities
Mining, oil and gas
Agriculture, forestry
0.0% 0.5% 1.0% 1.5% 2.0% 2.5% 3.0% 3.5% 4.0% 4.5% 5.0%
2016-2020 2021-2025 2026-2030
Source: Canadian Skills Training & Employment Coalition, Metro Economics
Regional Labour Considerations
Population, Age Distribution and Regional Diversity
The London/Stratford-Bruce Peninsula region is one of the most populous regions in Ontario, with
approximately 7% of the total provincial population residing in the region. The principal population
centre of the region is the London ER, which includes the cities of London and St. Thomas. The region
also includes the Stratford-Bruce Peninsula ER, which covers the Perth, Huron, Bruce and Grey counties.
The region’s population was estimated at just over 1.00 million people in 2018, approximately 70% of
whom reside in the London ER. Looking ahead, the region’s population is expected to reach 1.02 million
people by 2020. The population is then expected to grow by 5.0% between 2021 and 2025 to 1.07
million. However, population growth is expected to slow to 3.6% over the latter half of the next decade,
reaching 1.1 million by 2030.
Automotive Industry Labour Market Analysis: Regional Automotive Manufacturing Profile – London/Stratford-Bruce Peninsula 12Total Regional Population Outlook, 2016-2030
1,150,000 1.6%
Forecast 1.4%
1,100,000
1.2%
1,050,000 1.0%
0.8%
1,000,000 0.6%
0.4%
950,000
0.2%
900,000 0.0%
2016 2017 2018 2019 2020 2021 2022 2023 2024 2025 2026 2027 2028 2029 2030
Total Population Annual Population Growth Rate (%)
Source: Canadian Skills Training & Employment Coalition, Metro Economics
Changes in total population occur through net natural population change (i.e. the difference between
the number of births and deaths in a region) and net migration (i.e. the difference between the number
of people moving in and out of a region). Categorizing a region’s total population change based on these
components can be useful in identifying whether its future population growth will be driven by natural
means or through drawing people in from outside the region.
In the case of the London/Stratford-Bruce Peninsula region population change is predominantly a result
of net migration, which was responsible for nearly 80% of the region’s population growth in 2018. This
share is expected to increase over the next decade as natural population change shrinks. The annual
growth rate in the number of births in the region is projected to decline and be outpaced by the growth
rate of deaths. Births and deaths in the region are expected to be nearly equal by 2030. In contrast, net
migration is expected to increase annually over the next several years before beginning to decline over
the latter half of the next decade. Overall, the region is expected to add an average of nearly 10,000
people to its population annually through 2030.
Automotive Industry Labour Market Analysis: Regional Automotive Manufacturing Profile – London/Stratford-Bruce Peninsula 13Total Regional Population Change Outlook, 2016-2030
16,000
14,000 Forecast
12,000
10,000
8,000
6,000
4,000
2,000
0
2016 2017 2018 2019 2020 2021 2022 2023 2024 2025 2026 2027 2028 2029 2030
-2,000
Net Natural Population Change Net Migration Total Population Change
Source: Canadian Skills Training & Employment Coalition, Metro Economics
The London/Stratford-Bruce Peninsula region’s age distribution is also expected to shift in the coming
years. In 2018, an estimated 18% of the region’s population were 65 years of age or older; that
proportion is expected to rise to 24% by 2030. The region will also see concurrent declines in the
population shares of the 45-54 and 55-64 age cohorts as part of the aging trend. Among younger age
cohorts, the population share of the 15-24 age cohort is projected to fall from 13% to 11% during the
period. This is notable as this cohort is traditionally the largest source of new entrants to the labour
force.
Automotive Industry Labour Market Analysis: Regional Automotive Manufacturing Profile – London/Stratford-Bruce Peninsula 14Regional Population Outlook by Age Distribution, 2016-2030
0% 10% 20% 30% 40% 50% 60% 70% 80% 90% 100%
2016 16% 13% 13% 12% 14% 14% 18%
2020 16% 12% 13% 12% 12% 15% 20%
2025 17% 11% 13% 13% 11% 13% 22%
2030 17% 11% 12% 13% 11% 11% 24%
0 to 14 years 15 to 24 years 25 to 34 years 35 to 44 years 45 to 54 years 55 to 64 years 65+ years
Source: Canadian Skills Training & Employment Coalition, Metro Economics
Some portions of society are likely underrepresented in the automotive manufacturing workforce.
Examining their population shares in the region’s total population can illustrate the magnitude of the
untapped potential for the industry. The shares of these groups in the London/Stratford-Bruce Peninsula
region’s population are generally on par with those of Ontario as a whole. The region had similar shares
of Indigenous peoples, youth and women as the provincial population as of 2016. One notable exception
is in the share of the population who are immigrants; in the London/Stratford-Bruce Peninsula region,
this share was 14%, less than half that of the provincial average (29%).
Regional and Provincial Population Diversity, 2016
60%
51% 52%
50%
40%
29%
30%
20%
14%
12% 13%
10%
2% 3%
0%
Immigrants Indigenous peoples Youth (15-24 years) Women
London/Stratford-Bruce Peninsula Ontario
Source: Canadian Skills Training & Employment Coalition, Statistics Canada
Automotive Industry Labour Market Analysis: Regional Automotive Manufacturing Profile – London/Stratford-Bruce Peninsula 15Educational Attainment
Educational attainment among the population aged 15 years and over provides important insights into
workforce qualifications and potential labour supply for the automotive industry. Comparing regional
educational attainment rates to provincial averages can help identify what skills the region needs to
cultivate internally or attract externally.
Just under half (49%) of people in the London/Stratford-Bruce Peninsula region had either a high school
diploma or no certificate, diploma or degree of any kind as of 2016. The share of the same group was
45% for Ontario as a whole. The region also had a slightly higher share of people with college degrees
(24%) than the provincial average (21%). Conversely, 18% of the London/Stratford-Bruce Peninsula
region had a university degree at bachelor level or above, compared to 26% for Ontario.
Regional and Provincial Educational Attainment, 2016
35%
29% 27%
30% 26%
24%
25% 21%
20%
20% 18% 18%
15%
10% 7% 6%
5% 2% 2%
0%
No certificate, Secondary (high) Apprenticeship or College, CEGEP or University University
diploma or degree school diploma or trades certificate other non- certificate or certificate, diploma
equivalency or diploma university diploma below or degree at
certificate certificate or bachelor level bachelor level or
diploma above
London/Straford-Bruce Peninsula Ontario
Source: Canadian Skills Training & Employment Coalition, Statistics Canada
Labour Market Activity
Total employment in the London/Stratford-Bruce Peninsula region was an estimated 483,000 in 2018,
while the region’s labour force, including both the employed and those who are unemployed and
actively seeking work, totaled 514,000. The unemployment rate, or the proportion of unemployed
persons in the labour force, was 6.2%. This was a sharp decline from both 2016 and 2017, when the
unemployment rate was 6.7% and 6.8% respectively. The region’s unemployment rate is projected to
continue this trend going forward, falling to 5.5% by 2020 before stabilizing over the coming decade.
Automotive Industry Labour Market Analysis: Regional Automotive Manufacturing Profile – London/Stratford-Bruce Peninsula 16Total Regional Employment Outlook, 2016-2030
700,000 8.0%
Forecast
600,000 7.0%
6.0%
500,000
5.0%
400,000
4.0%
300,000
3.0%
200,000
2.0%
100,000 1.0%
0 0.0%
2016 2017 2018 2019 2020 2021 2022 2023 2024 2025 2026 2027 2028 2029 2030
Labour Force Employment Unemployment Rate (%)
Source: Canadian Skills Training & Employment Coalition, Metro Economics
A forecast of the region’s manufacturing hiring requirements can provide additional insights into labour
market trends for the automotive manufacturing sub-sector. Total manufacturing hiring requirement is
comprised of expansion demand (additional jobs as a result of industry growth) and replacement
demand (workers needed to replace exits from the labour force due to deaths and retirements). To
meet the hiring requirement, the industry relies on individuals entering the workforce for the first time
(i.e. new entrants) and workers entering from other regions or industries (i.e. recruitment gap).
Projections for the London Census Metropolitan Area (CMA) indicate that new entrants will cover only
61% of the region’s manufacturing hiring requirement between 2016 and 2025. The remaining 39% is
the industry’s recruitment gap in the region.
Automotive Industry Labour Market Analysis: Regional Automotive Manufacturing Profile – London/Stratford-Bruce Peninsula 17London CMA Manufacturing Hiring Requirement, 2016-2025
9,000 Expansion Demand
8,000 Recruitment
Gap
7,000
6,000
5,000
New Entrants Replacement
4,000
Demand
3,000
2,000
1,000
-
Supply Demand
Source: Canadian Skills Training & Employment Coalition, Prism Economics and Analysis
The industry’s hiring requirements vary significantly between occupations based on labour demand.
Manufacturing occupations with the largest hiring requirements tend to be skilled trades and technical
occupations, such as welders or millwrights. The following table lists the occupations with the largest
hiring requirements:
London CMA Manufacturing Hiring Requirement by Occupation, 2016-2025
Occupations Total Hiring Share of
Requirement 2016
Employment
2016 - 2025
Motor vehicle assemblers, inspectors and testers 934 23%
Labourers in food, beverage and associated products processing 427 34%
Material handlers 289 31%
Manufacturing managers 330 36%
Welders and related machine operators 210 28%
Construction millwrights and industrial mechanics 216 38%
Other labourers in processing, manufacturing and utilities 175 31%
Process control and machine operators, food, beverage and associated 129 23%
products processing
Automotive Industry Labour Market Analysis: Regional Automotive Manufacturing Profile – London/Stratford-Bruce Peninsula 18Mechanical engineers 118 22% Shippers and receivers 167 32% Machinists and machining and tooling inspectors 155 31% Senior managers - construction, transportation, production and 144 40% utilities Industrial electricians 115 34% Industrial engineering and manufacturing technologists and 63 22% technicians Industrial and manufacturing engineers 75 28% Sheet metal workers 72 30% Mechanical engineering technologists and technicians 53 25% Electrical and electronics engineering technologists and technicians 46 24% Contractors and supervisors, machining, metal forming, shaping and 55 31% erecting trades Electrical and electronics engineers 37 21% Transport truck drivers 78 52% Chemical technologists and technicians 23 23% Industrial sewing machine operators 42 42% Labourers in wood, pulp and paper processing 39 43% Plastics processing machine operators 31 40% Furniture and fixture assemblers and inspectors 26 34% Source: Canadian Skills Training & Employment Coalition, Prism Economics and Analysis Regional Automotive Manufacturing Analysis The following sections use data based on a broader definition of the automotive manufacturing industry where applicable, including the traditional industry codes (NAICS 3361 and 3363) as well as an additional set of industries. Please refer to the Project Background section of this report for more details. Automotive Industry Labour Market Analysis: Regional Automotive Manufacturing Profile – London/Stratford-Bruce Peninsula 19
Profile of Automotive Manufacturing Employment
Total automotive manufacturing employment in the region, including Original Equipment Manufacturer
(OEM) plants and parts suppliers, was an estimated 24,200 workers across 93 establishments in 2018,
based on findings from industry contacts, company websites, industry literature and other sources of
publicly available data. Employment in the five years prior is estimated to have ranged from a low of
22,600 in 2013 to a peak of 24,400 in 2017. In comparison, data from Statistics Canada’s 2016 Census
reports the region’s automotive manufacturing employment as totaling 16,840 workers.

The London/Stratford-Bruce Peninsula region is home to two large OEM assembly plants: a General
Motors plant in Ingersoll that produces the Chevrolet Equinox and a Toyota plant in Woodstock that
produces the Toyota RAV4. There is an additional Toyota-owned assembly plant in Woodstock, Hino
Canada, that produces light and medium-duty trucks. These plants employed an estimated 5,900
workers combined in 2018. Notably, employment at OEM plants has declined in recent years, having
reached as high 6,600 in 2016.

There are an estimated 90 parts suppliers in the region. 64 of these establishments are located in the
London ER, the majority of which are dedicated to metal stamping and related manufacturing. There are
also multiple establishments working in plastics, seating, sub-assembly and suspension manufacturing.
Employment across all parts suppliers in the London ER is estimated at nearly 12,000 in 2018. The
remaining 26 parts suppliers reside in the Stratford-Bruce Peninsula ER. The most common
establishment types among them are metal stamping, plastics, propulsion and rubber product
manufacturing. Estimated total parts employment in the Stratford-Bruce Peninsula ER was 6,300 in
2018.
             Regional Automotive Manufacturing Employment by Activity, 2013-2018

 30,000

 25,000

                                                      5,628              5,864              6,210              6,276
 20,000         5,625              5,586

 15,000
                                                      11,563             11,822             11,933             11,988
                11,027             11,172
 10,000

  5,000
                5,931              5,923              6,624              6,626              6,223              5,906
      0
                 2013               2014               2015               2016               2017               2018

                              Assembly       Parts (London)       Parts (Stratford-Bruce Peninsula)

Source: Canadian Skills Training & Employment Coalition, Automotive Policy Research Centre =

Automotive Industry Labour Market Analysis: Regional Automotive Manufacturing Profile – London/Stratford-Bruce Peninsula   20
Profile of Automotive Manufacturing Employers
Statistics Canada’s business counts data provides insights into the mix of business types present in the
London/Stratford-Bruce Peninsula region’s automotive manufacturing industry. A comparison of data
from 2013 and 2016 reveals that while the proportion of small-sized automotive manufacturing
establishments (i.e. 1 to 99 employees) remained stable there was a noticeable decline among very
small businesses. 16% of automotive manufacturing establishments in the region had between 1 and 4
employees in 2013, compared to just 6% in 2016. The region also saw the share of medium-sized
automotive manufacturing establishments (i.e. 100 to 199 employees) fall from 20% in 2013 to 17% in
2016. The largest gains during the period were seen among large-sized automotive manufacturing
establishments (i.e. 500+ employees) and establishments with 50-99 employees.
Regional Automotive Manufacturing Establishments by Employment Size, 2013-2016
0% 10% 20% 30% 40% 50% 60% 70% 80% 90% 100%
2013 16% 6% 6% 12% 10% 20% 20% 10%
2016 6% 8% 5% 14% 16% 17% 22% 13%
1-4 5-9 10-19 20-49 50-99 100-199 200-499 500+
Source: Canadian Skills Training & Employment Coalition, Statistics Canada
The largest automotive manufacturing-related employers in the London/Stratford-Bruce Peninsula
region include Toyota and General Motors, which each have one plant in the region, and Magna
International, which has three plants in the region. Taken together, the region’s top employers
employed 14,200 people in 2018, based on findings from industry contacts, company websites, industry
literature and other sources of publicly available data.
Automotive Industry Labour Market Analysis: Regional Automotive Manufacturing Profile – London/Stratford-Bruce Peninsula 21Largest Regional Automotive Manufacturing-Related Employers, 2018 Employer Plants Employees Toyota 1 3,000 General Motors 1 2,800 Magna International 3 2,540 DYNA-MIG 1 900 Vuteq 1 730 Brose Canada 1 700 Autoneum 2 685 Cooper-Standard Automotive Canada 3 650 Stackpole International 1 600 Meridian Lightweight Technologies 2 560 Listowel Technology 1 510 Wescast Industries 3 500 Source: Canadian Skills Training & Employment Coalition, Automotive Policy Research Centre Automotive Manufacturing Labour Market Workers in the London/Stratford-Bruce Peninsula region’s automotive manufacturing industry can be classified by job family, which indicates the broad area of work in which they are employed. Employees in each of these occupational groups play distinct roles in contributing to the industry’s success. Unsurprisingly, manufacturing and utilities occupations account for 60% of the region’s automotive manufacturing workforce. A further 20% is accounted for by trades, transport and equipment operators. The remaining workers are split between business, finance and administration occupations (7%); natural and applied sciences occupations (5%); and all other occupation types (8%). Automotive Industry Labour Market Analysis: Regional Automotive Manufacturing Profile – London/Stratford-Bruce Peninsula 22
Regional Automotive Manufacturing Workforce by Job Family, 2016

                                                               Business, finance and
                                            Other, 8%           administration, 7%
                                                                               Natural and applied
                                                                                  sciences, 5%

                                                                                       Trades, transport and
                                                                                       equipment operators,
                                                                                                20%

                         Manufacturing and
                           utilities, 60%

Source: Canadian Skills Training & Employment Coalition, Statistics Canada

A more granular analysis of the region’s automotive manufacturing workforce shows that over two-
fifths (41%) of the industry’s workers are classified by Statistics Canada as motor vehicle assemblers,
inspectors and testers (NOC 9522). This occupational code covers a range of activities including5:

      •   connecting cables, tubes and wires to complete assemblies and installations;
      •   positioning and installing parts, subassemblies and accessories such as engines, transmissions,
          door panels or instrument panels;
      •   driving and testing motor vehicles on roll testing devices to ensure proper functioning;
      •   and fitting and adjusting parts such as doors, hoods and trunk lids

Other key occupations among the region’s automotive manufacturing workers include motor vehicle
assembling supervisors (NOC 9221); material handlers (NOC 7452); welders and related machine
operators (NOC 7237); and industrial painters, coaters and metal finishing process operators (NOC
9536).

The following table lists the occupations that account for at least 1.0% of the region’s automotive
manufacturing workforce:

5
    http://noc.esdc.gc.ca/English/NOC/QuickSearch.aspx?ver=&val65=9522

Automotive Industry Labour Market Analysis: Regional Automotive Manufacturing Profile – London/Stratford-Bruce Peninsula   23
Key Regional Automotive Manufacturing Occupations and Trades, 2016
Automotive Share of Automotive
Occupation Manufacturing Manufacturing
Employment
Employment
Motor vehicle assemblers, inspectors and 7,345 40.8%
testers (NOC 9522)
Supervisors, motor vehicle assembling (NOC 1,065 5.9%
9221)
Material handlers (NOC 7452) 1,060 5.9%
Welders and related machine operators (NOC 635 3.5%
7237)
Industrial painters, coaters and metal finishing 525 2.9%
process operators (NOC 9536)
Manufacturing managers (NOC 0911) 460 2.6%
Construction millwrights and industrial 455 2.5%
mechanics (NOC 7311)
Other labourers in processing, manufacturing 325 1.8%
and utilities (NOC 9619)
Metalworking and forging machine operators 275 1.5%
(NOC 9416)
Industrial electricians (NOC 7242) 270 1.5%
Tool and die makers (NOC 7232) 220 1.2%
Automotive service technicians, truck and bus 215 1.2%
mechanics and mechanical repairers (NOC
7231)
Shippers and receivers (NOC 1521) 210 1.2%
Mechanical assemblers and inspectors (NOC 205 1.1%
9526)
Machinists and machining and tooling 200 1.1%
inspectors (NOC 7231)
Mechanical engineers (NOC 2132) 185 1.0%
Source: Canadian Skills Training & Employment Coalition, Statistics Canada
Automotive Industry Labour Market Analysis: Regional Automotive Manufacturing Profile – London/Stratford-Bruce Peninsula 24Competition from Other Industries
While the automotive manufacturing industry remains a premier employer, competing employment
demands from other industries are worth analyzing for their potential impact on hiring decisions for key
trades and occupations.
Overall, automotive manufacturing accounted for 4% of the London/Stratford-Bruce Peninsula region’s
total employment in 2016. Among manufacturing and utilities occupations, however, the industry
accounted for 18% of total employment. The primary competition for these occupations comes from
other manufacturing employers (61%). Greater regional competition exists within other job families. For
example, the construction industry accounted for 33% of region’s workforce employed in trades,
transport and equipment operator positions. Regional growth in this industry could impact the
availability of workers in this job family for automotive manufacturing employers.
Regional Employment Distribution by Job Family and Sector, 2016
100%
14%
90%
28%
5%
0% 80%
2%
2% 70%
67%
73%
18% 78% 60%
50%
61%
40%
33%
6% 30%
3% 2%
4%
6% 2% 20%
7% 8%
16% 16% 4% 10%
18% 9%
8%
2% 2% 1% 4% 0%
Manufacturing and Trades, transport and Natural and applied Business, finance and Total
utilities equipment operators sciences administration
Automotive Manufacturing Other Manufacturing Construction
Transportation and Warehousing Utilities Other
Source: Canadian Skills Training & Employment Coalition, Statistics Canada
Automotive Industry Labour Market Analysis: Regional Automotive Manufacturing Profile – London/Stratford-Bruce Peninsula 25Automotive Manufacturing Demographics
The age distribution of the London/Stratford-Bruce Peninsula region’s automotive manufacturing
workforce is distinct from that of the region’s total workforce across all industries. Notably, just 9% of
motor vehicle manufacturing workers and 12% of motor vehicle parts manufacturing workers were
between the ages of 15 and 25 as of 2016. In contrast, 15% of the region’s total workforce belonged to
the 15-24 age cohort. New entrants to the workforce are critical for sustaining long-term growth for the
industry. The region’s automotive manufacturing workforce consists of more mid-career workers, with
higher proportions of the workforce belonging to the 35-44 and 45-54 age cohorts. Somewhat
surprisingly, the region’s total workforce has a larger share of workers aged 55+ (23%) than either motor
vehicle manufacturing (14%) or motor vehicle parts manufacturing (18%).
Regional Automotive Manufacturing Workforce Age Distribution, 2016
35%
30%
30% 27%
26%
25% 23% 22%
22%
20%20% 19%
20% 18%
17%
15%
15% 12% 13%
9%
10%
5%
5%
1% 1%
0%
15 to 24 years 25 to 34 years 35 to 44 years 45 to 54 years 55 to 64 years 65 years and over
All Industries Motor Vehicle Manufacturing (NAICS 3361) Motor Vehicle Parts Manufacturing (NAICS 3363)
Source: Canadian Skills Training & Employment Coalition, Statistics Canada
As older workers move into retirement it will be essential to replenish the region’s automotive
manufacturing workforce with the next generation of skilled workers. A recent survey of Canadian
manufacturers examined the level of satisfaction with the young workers they employ. Overall,
manufacturers were only moderately satisfied, with just 46% of respondents indicating that they are
satisfied with their young workers. 39% of employers were dissatisfied with their work ethic and
attitude, while 56% were dissatisfied with their industry specific knowledge. However, 56% of employers
were satisfied with their willingness to learn.
Automotive Industry Labour Market Analysis: Regional Automotive Manufacturing Profile – London/Stratford-Bruce Peninsula 26Canadian Manufacturing Employer Satisfaction with Young Workers, 2016
Overall satisfaction 18% 37% 46%
Willingness to learn/progress 18% 26% 56%
Work ethic/Attitude 39% 30% 31%
Industry-specific knowledge 36% 45% 19%
Level of skills 23% 42% 36%
Level of training 19% 42% 38%
0% 10% 20% 30% 40% 50% 60% 70% 80% 90% 100%
Dissatisfied Neutral Satisfied
Source: Canadian Skills Training & Employment Coalition, Prism Economics and Analysis
The region’s automotive manufacturing workforce also differs from the total workforce in terms of its
diversity. The biggest difference is with respect to the proportion of women in the workforce. The
female share of the region’s total workforce was 48% as of 2016, on par with their population share.
However, the proportions of women working in motor vehicle manufacturing (22%) and motor vehicle
parts manufacturing (30%) were well-below average. Elsewhere, foreign-born workers account for 14%
of the region’s total workforce, slightly higher than the share found in motor vehicle manufacturing
(11%) but slightly lower than the share found in motor vehicle parts manufacturing (16%). A similar
trend is observed with regard to the share of workers who are visible minorities. There is no notable
difference in the proportion of the workforce who are Indigenous peoples between automotive
manufacturing and the total regional workforce.
Automotive Industry Labour Market Analysis: Regional Automotive Manufacturing Profile – London/Stratford-Bruce Peninsula 27Regional Automotive Manufacturing Workforce Diversity, 2016
60%
50% 48%
40%
30%
30%
22%
20% 16%
14%
11% 11%
8%
10% 5%
2% 3% 3%
0%
Female Immigrant Inidgenous peoples Visible minorities
All Industries Motor Vehicle Manufacturing (NAICS 3361) Motor Vehicle Parts Manufacturing (NAICS 3363)
Source: Canadian Skills Training & Employment Coalition, Statistics Canada
Educational attainment is yet another dimension where the region’s automotive manufacturing
workforce diverges from the total regional workforce. 56% of motor vehicle manufacturing workers and
60% of motor vehicle parts manufacturing workers in the region have no more than a high school
diploma as of 2016, compared to 42% for the total regional workforce. Conversely, the automotive
manufacturing workforce has a much lower than average proportion of workers with a university
degree.
Regional Automotive Manufacturing Workforce Educational Attainment, 2016
60%
48% 48%
50%
40%
29% 28% 27%
30% 25%
23%
20%
13% 12%
10%
8% 7% 8% 8% 8%
10%
0%
Below high school High school Apprenticeship or College University
trades
All Industries Motor Vehicle Manufacturing (NAICS 3361) Motor Vehicle Parts Manufacturing (NAICS 3363)
Source: Canadian Skills Training & Employment Coalition, Statistics Canada
Automotive Industry Labour Market Analysis: Regional Automotive Manufacturing Profile – London/Stratford-Bruce Peninsula 28You can also read