How to limit global warming to 1.5 C: New research identifies the remaining global carbon budget for twelve main industries
←
→
Page content transcription
If your browser does not render page correctly, please read the page content below
Sectorial Pathways for Industries – OneEarth Climate Model 2021                   University of Technology Sydney
                                                                                  Institute for Sustainable Futures

                                     How to limit global warming to 1.5°C:
  New research identifies the remaining global carbon budget for twelve main industries
Summary
The remaining global carbon budget to limit global warming to 1.5˚C for the 12 main macro industry sectors has been defined
for the first time. Scientists of the University of Technology Sydney (UTS) developed energy-related carbon budgets for
twelve main industry and service sectors: Aluminium, chemical, cement, steel and textile & leather industry, power& gas
utilities, agriculture, forestry, the aviation and shipping industry, road transport and the real estate & building industry.
Those specific industry emission budgets were further subdivided into so-called Scope 1, 2 and 3 emissions, which define the
responsibility for those emissions. So far, this system has only been applied to companies, but not to entire industry sectors
or regions, yet. The researchers used and streamlined three financial industry classifications (BICS, GICS, NACE) for the first
time for energy and climate scenarios. The interconnections across the 12 industry sectors with regards to scope 1,2 and 3
emissions are reported via a Sankey-Diagram.
The UTS research shows that it is still possible to limit global warming to 1.5˚C and implement the Paris Climate Agreement.
This, however, requires timely climate action by key stakeholders: policy makers, industry sectors and financiers alike. With
the help of these new UTS findings and data, operationalizing the global 1.5°C objective, incl. short-term progress tracking
against this objective, is made feasible.
For instance, financial actors and corporations increasingly set strict and ambitious climate neutrality targets - often called
net-zero targets. Climate target setting and implementation need sector decarbonisation models, such as the UTS One Earth
Climate Model (OECM), to be used as a benchmark and guidance for investment portfolio decision making and engaging
with various stakeholders (e.g. corporations, sector associations, and governments). It requires emission paths for each
special industry classifications, which is then captured in one consistent model in line with the net zero ambition level.
Siloed approaches would not work due to the global and sectoral interconnections. Members of the UN-convened Net Zero
Asset Owner Alliance (the Alliance) already started using this model for target setting and investment portfolio steering.

                                                                           The UTS ‘One Earth Climate Model’ (OECM) is an
                                                                           integrated energy assessment model to develop
                                                                           net-zero targets based on science for all major
                                                                           industries in a granularity and with the key
                                                                           performance indicators (KPI) needed to make
                                                                           short-, mid- and long-term investment decisions.
                                                                           The 1.5˚C emission pathways developed by UTS
                                                                           are no/low overshoot scenarios (SSP 1) as
                                                                           defined by the IPCC: this means that a carbon
                                                                           budget overshoot is avoided and that already
                                                                           released CO2 is not assumed to be ‘removed’ by
                                                                           unproven technologies still under development
                                                                           such as carbon capture and storage (CCS). The
                                                                           OECM does take negative emissions into account,
                                                                           but only ‘natural carbon sinks’ such as forests,
                                                                           mangroves or seaweed to compensate process
                                                                           emissions which are currently un-avoidable such
                                                                           as from cement production.

The OECM remains within an energy related carbon budget of 400 Gt CO2 while the recently released Net Zero scenario of
the International Energy Agency (IEA NZ) leads to “(…) cumulative energy‐related and industrial process CO2 emissions
between 2020 and 2050 of 460 Gt CO2.” In August 2021, the Intergovernmental Panel on Climate Change (IPCC), the United
Nations body for assessing the science related to climate change, identified the global carbon budget to achieve 1.5˚C with
67% likelihood as 400 GtCO2 and 50% likelihood at 500 GtCO2 between 2020 and 2050.
Another key differentiation between OECM and IEA NZ is that due to the use of technical measure to remove CO2 after
emissions, the IEA NZ classifies therefore as an IPCC SSP2 scenario. The IEA NZ does not provide disaggregated Scope 1,2
and 3 emissions and does not specify all industry sub-sectors.
According to the UTS scientists, the most important measures to limit global warming to max. 1.5° are a rapid phase out of
coal and internal combustion engines for cars. Power utilities electricity suppliers play a central role. They must be able to
provide electricity from renewable energies in sufficient quantities for energy-intensive industries and for electric cars.

                          Monday, 25 October 2021 EMBARGO TILL 2. NOVEMBER 2021 2AM CET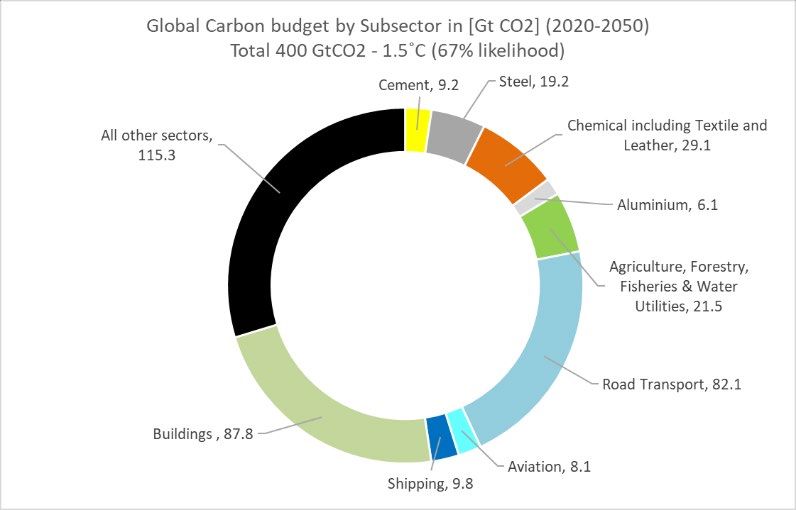
Sectorial Pathways for Industries – OneEarth Climate Model 2021                  University of Technology Sydney
                                                                                 Institute for Sustainable Futures
The One Earth Climate Model (OECM) has been developed under the leadership of the Institute for Sustainable Futures (ISF)
at the University of Technology (UTS) in order to develop 1.5˚C compatible climate and energy pathways for countries,
regions or globally. A number of climate modelling organisations including the Energy Transition Commission, Potsdam
Institute for Climate Impact Research, Science Based Targets Initiative, Rocky Mountain Institute (RMI), CRREM (Carbon Risk
Real Estate Monitor) and WWF have been invited to peer-review the OECM-derived net-zero pathways. Initial work by the
University of Technology Sydney and the University of Melbourne, Australia, as well as the German Aerospace Centre (DLR)
has led to publishing the first joint One Earth Climate Modell (OECM) in February 2019 as an open access book with Springer
Nature.
The first phase of the research from 2017 to 2019 has been financed by the Leonardo DiCaprio Foundation. Since 2019, the
OECM has been further developed toward no/low overshoot sectorial pathways for 12 industry sectors. This research has
been supported and financed in parts by the UN-convened Net-Zero Asset Owner Alliance, the Rockefeller Foundation and
the European Climate Foundation (ECF) 1. The latest OECM research methodology, assumptions and data are scheduled to
be publish in scientific literature late 2021 / early 2022. The full datasets will be made available as open-source usage to the
public, esp. for academics and researchers, civil society organizations, financial industry, companies, and policy makers.
As a first major use case setting a strong signal to the UNFCCC COP negotiations, the UN-convened Net-Zero Asset Owner
Alliance – an international group of currently 56 institutional investors committed to transitioning their investment
portfolios of about 9.3tr USD Assets under Management (AuM) to net-zero emissions by 2050 on a low/no overshoot path –
is endorsing the further development of the OECM and is offering to the financial sector to apply the latest UTS findings and
data for informing the investor group’s net zero target setting protocol and investment portfolio decision making.
The following recommendations derive from this new UTS research:
Industry:
     1.     Setting and implementing a climate strategy in line with 1.5˚C no/low overshoot sector models,
     2.     Immediate stop new oil, coal and gas projects,
     3.     Utilities to rapidly upscale renewable electricity to provide logistical support to reduce Scope 2 emissions for all
            industries and services (this is a huge market opportunity for utilities),
     4.     Develop efficient technologies to implement electric mobility,
     5.     Transparent mandatory forward looking and historic disclosure for the most relevant KPIs e.g. carbon emissions,
            energy demand, carbon intensities per production unit.
Finance Institutions:
     1.     Setting and implementing investment, lending and underwriting portfolio sector decarbonizations targets in line
            with 1.5˚C no/low overshoot sector models,
     2.     Stop investing in, underwriting and lending to new oil, coal and gas projects,
     3.     Scale climate solution investments especially in the emerging economies,
     4.     Disclosure of:
                 • climate mitigation strategy
                 • short- and mid-term target setting
                 • target achievements and transparency on engagement activities
                 • progress of climate solution investments.
Governments and Policy Maker:
     1.     Immediate stop of public and private investments in new oil, coal and gas projects,
     2.     Ensure coal phase out by 2030 in OECD countries, between 2030 and 2040 all regions should phase out coal,
     3.     Implement carbon pricing with a reliable minimum CO2 price with the underlying OECM emissions caps,
     4.     Manufacturing stop for passenger cars with oil fuelled internal combustion engines by 2030,
     5.     Legally binding efficiency standards for all electrical application, vehicles and buildings,
     6.     Governments to provide detailed transitions plans to net zero
     7.     Renewable energy targets based on IPCC-carbon budget based 1.5˚C no/low overshoot scenarios and outlined and
            detailed countries’ masterplans,
     8.     Mandatory transparent forward looking and historic disclosure for the most relevant KPIs: energy intensity, share
            of renewable energy supply, energy demand, carbon emissions and carbon intensities per production unit.

1Responsibility for the information and views set out in this research lie with the authors. None of the founders can be held responsible for any use which
may be made of the information contained or expressed therein
                                Monday, 25 October 2021 EMBARGO TILL 2. NOVEMBER 2021 2AM CET
Sectorial Pathways for Industries – OneEarth Climate Model 2021 University of Technology Sydney
Institute for Sustainable Futures
1. The OECM defines the Global Industry Sector Carbon Budget
The global carbon budget identifies the total amount of energy related CO2 emissions available to limit global warming to
max. 1.5°C with no/low overshoot. The Intergovernmental Panel on Climate Change (IPCC), is the United Nations body for
assessing the science related to climate change. In August 2021, the IPCC published a new report that identified the global
carbon budget to achieve 1.5˚C with 67% likelihood as 400 GtCO2 between 2020 and 2050 (IPCC AR6, 2021) 2. The OECM
uses this as the overall remaining budget and develops energy scenarios and emission pathways across all major industry
sectors, buildings and transport and sub-divides those large sectors further for specific industries. Figure 1 shows the shares
in percent and table 1 the remain cumulative CO2 emissions in Gigatons for various industries.
Figure 1: Global carbon budgets – share by industry sectors
Table 1: Global Carbon Budgets – cumulative energy related CO2 by industry sectors
Global Carbon budget for energy relative CO2 emissions by Subsector (2020-2050)
2020-2030 2020 - 2050
Total 400 GtCO2 - 1.5˚C (67% likelihood)
Cement (process heat, fuels & electricity) 6 9
Steel (process heat, fuels & electricity) 14 19
Chemical Industry (process heat, fuels & electricity) 17 25
Textile & Leather (process heat, fuels & electricity) 3 4
Aluminium (process heat, fuels & electricity) 5 6
Buildings
69 88
-commercial, residential incl. construction- (heat, fuels & electricity)
Fisheries (fuels & electricity) 0 1
Agriculture & Food processing (heat, fuels & electricity) 10 14
Forestry & Wood (heat, fuels & electricity) 5 6
Water Utilities (heat, fuels & electricity) 1 1
Aviation - Transport Services 6 8
Aviation Industry direct (fuels & electricity) 0 0
Navigation Transport Services 6 10
Navigation Industry direct (fuels & electricity) 0 0
Road Transport - Transport Services 63 80
Road Transport Industry direct (fuels & electricity) 2 2
Energy Industry - Production of fossil fuels 4 5
Remaining Energy Services (Fossil Fuels) 54 89
Utilities (Power & Gas) – Distribution 1 1
Remaining Electricity Services 7 12
Other conversions & losses 6 8
Total cumulative energy related CO2 emissions 278 388
2IPCC, 2021: Climate Change 2021: The Physical Science Basis. Contribution of Working Group I to the Sixth Assessment Report of the Intergovernmental
Panel on Climate Change, Masson-Delmotte, V., P. Zhai, A. Pirani, S.L. Connors, C. Péan, S. Berger, N. Caud, Y. Chen, L. Goldfarb, M.I. Gomis, M. Huang, K.
Leitzell, E. Lonnoy, J.B.R. Matthews, T.K. Maycock, T. Waterfield, O. Yelekçi, R. Yu,and B. Zhou (eds.). Cambridge University Press.
Monday, 25 October 2021 EMBARGO TILL 2. NOVEMBER 2021 2AM CETSectorial Pathways for Industries – OneEarth Climate Model 2021 University of Technology Sydney
Institute for Sustainable Futures
2. Scope 1, 2 and 3 – Global cross-sector responsibility for greenhouse gas emissions
Reporting of corporate Greenhouse Gas (GHG) emissions is important and no longer focuses only on direct energy related
CO2 emissions, but also includes other Greenhouse Gases (GHG) emitted by industries and increasingly includes indirect
emissions that occur in supply chains (Hertwich & Wood, 2018). The most important GHG besides CO2 are emissions from
land-use change (‘AFOLU'), methane (CH4), nitrous oxide (N2O), commonly known as ‘laughing gas’ and
chlorofluorocarbons (CFCs) a chemical propellant. The OECM analyses is taking all of them into account”. The GHG protocol,
a global corporate GHG accounting and reporting standard, distinguishes between three ‘scopes’
- Scope 1 emissions are direct emissions from owned or controlled sources.
- Scope 2 emissions are indirect emissions from the generation of purchased energy.
- Scope 3 emissions are all indirect emissions (not included in Scope 2) that occur in the value chain of the reporting
company, including both upstream and downstream emissions.
The United States Environmental Protection Agency (EPA) defines Scope 3 emissions as ‘the result of activities from assets
not owned or controlled by the reporting organization, but that the organization indirectly impacts in its value chain. They
include upstream and downstream of the organization’s activities. Scope 3 emissions accounting methodologies have been
developed for entity level accounting and reporting. By contrast, the OECM model focuses on the development of 1.5˚C
net-zero pathways of industry sectors classified under the Global Industry Categorisation Standard (GICS) for countries or
regions and the global level.
Entity-level Scope 3 emissions methodologies require bottom-up entity-level data to arrive at exact figures. Thus, data
availability and the accounting system for whole industry sectors on a regional or global level is challenging. The OECM
methodology, is based on the ‘Technical Guidance for Calculating Scope 3 Emissions’ of World Resource Institute (WRI &
WBCSD, 2013) but simplified in order to reflect the higher level of industry and country specific pathways. The OECM
defines the three emissions scopes as follows:
Scope 1 – All direct emissions from the activities of an organisation or under their control. Including fuel
combustion on site such as gas boilers, fleet vehicles and air-conditioning leaks. For this analysis only economic
activities covered under the sector specific GICS classification that are counted for the sector are covered. All
energy demands reported by the IEA Advanced World Energy Balances (IEA 20203, IEA, 2021 4) for the specific
sector are included.
Scope 2 – Indirect emissions from electricity purchased and used by the organisation. Emissions are created during
the production of the energy and eventually used by the organisation. Due to data availability, emission calculation
focuses on the electricity demand and ‘own consumption’ e.g. reported for power generation.
Scope 3 – GHG emissions caused by the analysed industry limited to sector specific activities and/or products as
classified in GICS. The OECM only includes sector specific emissions. Traveling, commuting and all other transport
related emissions are reported under transport. Lease of buildings is reported under ‘buildings’. All other finance
activities such as ‘capital goods’ are excluded as data is not available for GICS industry sectors and would lead to
double counting. The OECM is limited to energy related carbon dioxide (CO2) and energy related methane
emissions (CH4). All other GHG gases are calculated outside the OECM model by Meinshausen & Dooley (20195).
Double counting can be avoided by defining a primary class for the primary energy industry, a secondary class for supply
utilities and the end-use class for all economic activities which use the energy from the primary and secondary class
companies.
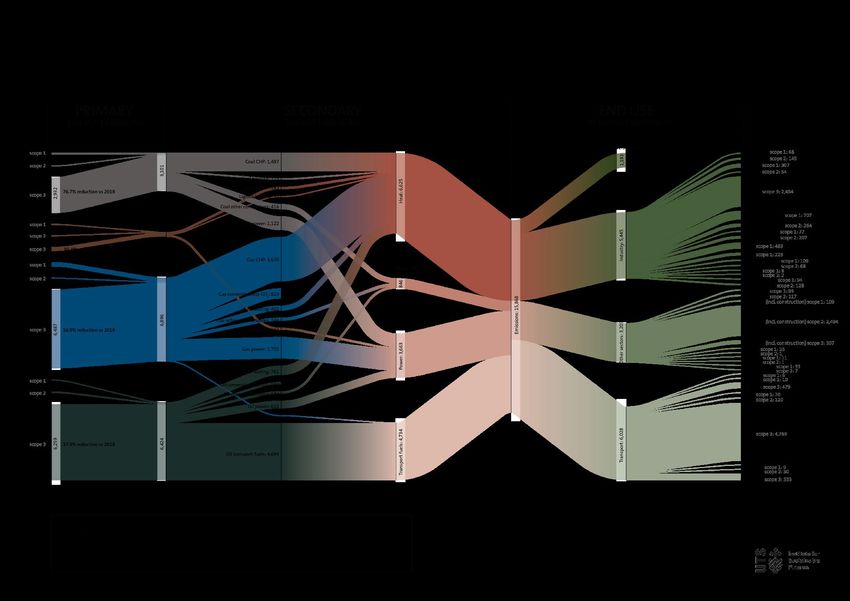
All calculated energy-related Scope 1, 2 and 3 emissions for the primary and secondary energy industry and for the analysed
industry sectors are shown in Figure 2 (next page). Detailed results for scope 1,2 and 3 emissions are in section 5.
3
IEA. (2020). World Energy Balances 2020. In IEA. IEA. https://www.iea.org/data-and-statistics?country=WORLD&fuel=Energy transition
indicators&indicator=TFCShareBySector
4 IEA. (2021). IEA World Energy Statistics and Balances. In IEA. https://doi.org/https://doi.org/10.1787/enestats-data-en
5 Meinshausen, M., & Dooley, K. (2019). Mitigation Scenarios for Non-energy GHG. In Sven Teske (Ed.), Achieving the Paris Climate Agreement Goals Global
and Regional 100% Renewable Energy Scenarios with Non-energy GHG Pathways for +1.5°C and +2°C. Springer Open. https://elib.dlr.de/126810/1/Teske
et al. - Achieving the Paris Climate Agreement Goals - Global and regional 100 percent renewable energy scenarios - 2019.pdf
Monday, 25 October 2021 EMBARGO TILL 2. NOVEMBER 2021 2AM CETSectorial Pathways for Industries – OneEarth Climate Model 2021 University of Technology Sydney
Institute for Sustainable Futures
Figure 2: ENERGY RELATED Scope 1, 2 and 3 for the primary and secondary energy industry and for the analysed industry sectors for 2030
Monday, 25 October 2021 EMBARGO TILL 2. NOVEMBER 2021 2AM CETSectorial Pathways for Industries – OneEarth Climate Model 2021 University of Technology Sydney
Institute for Sustainable Futures
3. OECM tackles the challenge of varying Industry Classification Systems
Investment decisions for achieving investment portfolio decarbonisation are highly complex processes. In November 2020,
the European Central Bank published a ‘Guide on climate-related and environmental risks’ which maps out a detailed
process to undertake ‘Climate Stress Tests’ for investment portfolios. To implement the Paris Climate Agreement for the
global finance industry, decarbonization targets and benchmarks for industry sectors are required. The estimation of the
carbon budget for specific industry sector based on an industry classification system requires a holistic approach and the
interconnection of all sectors and regions need to be considered. To estimate the carbon budget for a single industry sector
in an isolated ‘silo-approach’ based on current emission shares inevitably leads to inaccurate results because this approach
does not consider the possible technical developments and interaction with other industry sectors. Thus, the total of all sub-
concepts for certain industries exceeds the actual CO2 or responsibilities for CO2 reduction are shifted to other areas. So far,
decarbonisation pathways have been developed for countries, regions or communities, but less so for cross-industry
sectors.
Globally, there are three main industry classification systems. The ‘Nomenclature statistique des Activités économiques dans
la Communauté Européenne’ (NACE) is used in Europe, BICS-Bloomberg used in the Americas and the Global Industry
Classification System (GICS) is widely used globally as well. The classification varies, but the analysed 12 main industries are
classified similar – although with small variations. The OneEarth Climate Model (OECM) is an integrated assessment model
for climate and energy pathways with the focus on 1.5˚C scenarios (Teske e.al.2019) 6 and has been further developed to
reflect this need. In order to develop energy scenarios for industry sectors classified under the Global Industry Classification
Standard (GICS), the OECM had to improve the technology resolution significantly. Furthermore, the demand and supply
calculation had to be broken down to industry sectors to develop individual pathways. BICS, GICS, and NACE definitions had
to be matched.
What is the difference between OECM to the Net-Zero Pathway from the International Energy Agency (IEA NZ)
The OneEarth Climate Model (OECM) is an SSP 1 scenario as defined by the IPCC: “A scenario in which social, business and
technological innovations result in lower energy demand up to 2050 while living standards rise, especially in the global South.
A downsized energy system enables rapid decarbonization of energy supply. Afforestation is the only CDR option considered;
neither fossil fuels with CCS nor BECCS are used.” OECM avoids a carbon budget overshoot and expands ‘natural carbon
sinks’ (e.g. forest, mangroves & seaweed) to achieve negative emissions to compensate process emissions which are
currently un-avoidable (with currently available technologies). The relevant industry sectors are cement, steel, water
utilities and fossil fuels for non-energy use due process emissions un-related to energy use.
• Cumulative Energy related Carbon Dioxide emission until 2050: 400 Gt CO2.
• Overall cumulative negative emissions via natural carbon sinks: (-) 86 Gt CO2.
• The OECM include 50 GHG gases – including over 30 CFCs and HFCs as well as Black Carbon.
The energy pathway of IEA Net Zero by 2050 scenario classifies as an IPCC SSP2 scenario due to the use of technical
measures to remove CO2 after emissions: “A scenario with a broad focus on sustainability including energy intensity, human
development, economic convergence and international cooperation, as well as shifts towards sustainable and healthy
consumption patterns, low-carbon technology innovation, and well-managed land systems with limited societal acceptability
for BECCS.”
• The IEA Net Zero states that “(…) If today’s energy infrastructure was to be operated until the end of the typical lifetime
in a manner similar to the past cumulative energy‐related and industrial process CO2 emissions between 2020 and 2050
of just under 650 Gt CO2 . This is around 30% more than the remaining total CO2 budget consistent with limiting global
warming to 1.5 °C with a 50% probability.” The IEA identifies the cumulative global energy‐related and industrial
process CO2 emissions between 2020 and 2050 amount to just over 460 Gt in the NZE. Assuming parallel action to
address CO2 emissions from agriculture, forestry and other land use (AFOLU) over the period to 2050 would result in
around 40 Gt CO2 from land-use emissions (AFOLU). Thus, total CO2 emissions from all sources – some 500 Gt CO2 –
• The IEA Net-Zero scenario requires (-) 29/4 Gt CO2 direct air capture between 2020 and 2050 and (-) 89.5 Gt CO2 with
CC(U)S – including BECCS.
Reporting: The OneEarth Climate Model reports all GHG emissions separated in:
• Scope 1, 2 and 3 emissions (IEA NZ does not provide disaggregated Scope 1,2 and 3 emissions),
• Data for 12 industry sectors in line with the Global Industry Classification Standards (GICS, NACE and BICS),
• All data in regional breakdown: Global, OECD North America, OECD Europe (more regions are planned),
• With Key-Performance-Indicators (KPIs) like absolute carbon emissions, energy intensity and carbon intensity.
6Teske et. al. 2019, Teske, S.; Pregger, T.; Naegler, T.; Simon, S.; Pagenkopf, J.; van den Adel, B.; Deniz, Ö. Energy Scenario Results. In Achieving the Paris
Climate Agreement Goals: Global and Regional 100% Renewable Energy Scenarios with Non-Energy GHG Pathways for +1.5 °C and +2 °C; Teske, S., Ed.;
Springer International Publishing: New York, NY, USA, 2019
Monday, 25 October 2021 EMBARGO TILL 2. NOVEMBER 2021 2AM CETSectorial Pathways for Industries – OneEarth Climate Model 2021 University of Technology Sydney
Institute for Sustainable Futures
4. Conclusion and Recommendations
The One Earth Climate Model is an integrated assessment toll to develop truly science-based targets for all major global
industries in a granularity and with the KPIs needed to make informed investment decisions to credibly align with the net zero
objective in short-, medium-, and long-term. The key result of the OECM 1.5˚C cross-sectoral pathway development is, that it
is still possible to remain with the 1.5˚C limit if governments, industries and the financial sector act immediately. The
technology required to decarbonize energy supply with renewables is available, market ready and in most cases already
cost competitive. Energy efficiency measures needed to reduce energy demand have also been known for years and can be
introduced without delay. Finally, a part of the finance industry – such as the UN-convened Net-Zero Asset Owner Alliance –
is committed to implement carbon targets for investment portfolios. Policies and regulations, however, are required to
implement all measures in the necessary near-term in a rather short time frame.
Implementing short term targets for 2025 and 2030
The presented Scope 1, 2 and 3 emissions identify not only the quantity of GHG but also responsibilities to avoid them:
Scope 1 emissions are those which are controlled by the industries itself. A red alert for the industries and business to
implement technical financial and logistical measures to phase out emissions. For the energy intensive industry, the
majority of energy related emissions are from process heat generation and fuels used machinery are crucial as it relates
directly to the manufacturing process. Focus of the short-term action: increase renewable energy fuels, prepare for
electrification and the use of renewable generated hydrogen and synthetic fuels.
Scope 2 are mainly emissions from energy provided – usually electricity – from utilities. Thus, power utilities are in the very
centre of responsible industries: They need to provide the quantity of renewable electricity required for the increased
usage of electricity for process heat and transport vehicles. If power utilities fail to upscale their renewable electricity
generation, almost all of the analysed industries will miss their targets.
Scope 3 are emissions that arise from the use of a product or technical equipment. Thus, the industry is responsible to
change product design – so the automobile industry e.g. needs to stop production of cars with internal combustion engines
and provide electric vehicles instead. While the consumer will have to reduce the use of e.g. fossil fuelled car in the
meantime. Those are only simplified examples to make this research more accessible.
Monday, 25 October 2021 EMBARGO TILL 2. NOVEMBER 2021 2AM CETSectorial Pathways for Industries – OneEarth Climate Model 2021 University of Technology Sydney
Institute for Sustainable Futures
5. Overview – Key results by sector
Table 2 shows Scope 1,2 and 3 emissions of the primary and secondary energy industry. Scope 1 emissions are those related
to exploration, extraction and refineries for fossil fuels. Scope 2 are emissions from electricity used for those services. The
OECM assumes the global average electricity generation carbon intensity for each calculated year according to the OECM
power scenario which achieves 100% renewables by 2050. Scope 3 emissions are those, that arise from the use of fossil
fuels by industry or consumers.
Table 2: Global Scope 1,2 and 3 emissions for the primary and secondary energy industry
Subsector Unit 2019 2025 2030 2050
Global Projection
Total Energy, Gas, Oil & Coal Sector -
Energy Sector - Scope 1: Total CO2 equivalent [Mt CO2 eq./a] 4,527 2,744 1,961 254
Change to 2019 [%] -39% -57% -94%
Energy Sector - Scope 2: Total CO2 equivalent [Mt CO2 eq./a] 487 324 219 35
Change to 2019 [%] -33% -55% -93%
Energy Sector - Scope 3: Total CO2 equivalent [Mt CO2 eq./a] 33,827 23,874 16,222 463
Change to 2019 [%] -29% -52% -99%
Total Utilities Sector
Utilities - Scope 1: Total CO2 equivalent [Mt CO2 eq./a] 1,986 1,364 1,150 496
Change to 2019 [%] -31% -42% -75%
Utilities - Scope 2: Total CO2 equivalent [Mt CO2 eq./a] 287 226 179 9
Change to 2019 [%] -21% -38% -97%
Utilities - Scope 3: Total CO2 equivalent [Mt CO2 eq./a] 21,356 15,840 11,447 478
Change to 2019 [%] -26% -46% -98%
Table 3 provides the ‘Scope-emissions’ for the transport sector – excluding rail which is part of the transport industry sector
under the industry classification system. Scope 1 emissions arise from vehicle manufacturing and – as far as documented in
the energy statistic – operation of the transport services. However, the data availability is scarce on the global level. Scope 2
emissions are those from electricity used – either directly or for the production of hydrogen or synthetic fuels used for
operating vehicles, planes or ships. Specific emissions from airport and single airline offices cannot be assessed on a global
level, those emissions are under commercial buildings. Scope 3 emissions are the ‘classic’ emissions from driving a car or
using a plane for consumers. The OECM deliberately includes electricity emissions for e.g. electric car under Scope 2
emissions as car manufacturer today include charging infrastructure in their value chain and are therefore responsible.
Table 3: Global Scope 1,2 and 3 emissions for the transport sector
Total Transport Sector 2019 2025 2030 2050
Aviation - Transport - Scope 1: Total CO2 equivalent [Mt CO2 eq./a] 16 10 6 0
Change to 2019 [%] -39% -62% -100%
Aviation - Transport - Scope 2: Total CO2 equivalent [Mt CO2 eq./a] 0.0 5.9 10.4 0.0
Change to 2019 [%] 0% 0% 0%
Aviation - Transport - Scope 3: Total CO2 equivalent [Mt CO2 eq./a] 936.1 578.0 479.4 0.0
Change to 2019 [%] -38% -49% -100%
Navigation - Transport - Scope 1: Total CO2 equivalent [Mt CO2 eq./a] 23 14 9 0
Change to 2019 [%] -38% -61% -100%
Navigation - Transport - Scope 2: Total CO2 equivalent [Mt CO2 eq./a] 1.7 4.2 29.9 0.0
Change to 2019 [%] 0% 0% 0%
Navigation - Transport - Scope 3: Total CO2 equivalent [Mt CO2 eq./a] 793.8 747.3 533.4 0.0
Change to 2019 [%] -6% -33% -100%
Road - Transport - Scope 1: Total CO2 equivalent [Mt CO2 eq./a] 183 111 70 0
Change to 2019 [%] -39% -62% -100%
Road - Transport - Scope 2: Total CO2 equivalent [Mt CO2 eq./a] 34.5 157.8 120.3 0.0
Change to 2019 [%] 0% 0% 0%
Road - Transport - Scope 3: Total CO2 equivalent [Mt CO2 eq./a] 7223.4 6010.9 4769.2 0.0
Change to 2019 [%] -17% -34% -100%
Transport - Scope 1: Total CO2 equivalent [mio t CO2e] 223 136 85 0
Change to 2019 [%] -38% -61% -100%
Transport - Scope 2: Total CO2 equivalent [mio t CO2e] 36.2 167.8 160.6 0.0
Change to 2019 [%]
Transport - Scope 3: Total CO2 equivalent [mio t CO2e] 8,0006 7,336 5,728 0
Change to 2019 [%] -18% -35% -100%
Monday, 25 October 2021 EMBARGO TILL 2. NOVEMBER 2021 2AM CETSectorial Pathways for Industries – OneEarth Climate Model 2021 University of Technology Sydney
Institute for Sustainable Futures
Table 4 shows emissions for services. Under the energy statistic of the International Energy Agency (IEA), water utilities,
agriculture, forestry, fisheries and building are under the category ‘other sectors’, while food processing, tobacco and wood
& wood products are under ‘industry’. The sector ‘Agriculture, Food and Tobacco’ is the sum of energy-related emissions
from farms and machinery and from the energy-emissions caused by food processing and packaging. Scope 3 are mainly
emissions from land use and from meat & dairy production. This is similar for forestry and wood – almost all Sope 3
emissions are from land-use change. As re-forestation is a vital part of the OECM to achieve ‘negative emissions’ forestry
will grow carbon-negative.
Table 4: Global Scope 1,2 and 3 emissions for the ‘other sectors as defined in the IEA statistics
Subsector Unit 2019 2025 2030 2050
Residential & Commercial Buildings and Construction [estimated] Projection
Water Utilities
Water Utilities - Scope 1: Total CO2 equivalent [Mt CO2 eq./a] 77 53 33 0
Variation compared to 2019 [%] -32% -57% -100%
Water Utilities - Scope 2: Total CO2 equivalent [Mt CO2 eq./a] 27 14 7 0
Variation compared to 2019 [%] -47% -74% -100%
Water Utilities - Scope 3: Total CO2 equivalent [Mt CO2 eq./a] 830 881 925 1,125
Variation compared to 2019 [%] 6% 11% 35%
Fishery
Fishing Industry - Scope 1: Total CO2 equivalent [Mt CO2 eq./a] 29 28 25 0
Variation compared to 2019 [%] -4% -15% -100%
Fishing Industry - Scope 2: Total CO2 equivalent [Mt CO2 eq./a] 4 3 1 0
Variation compared to 2019 [%] -32% -63% -100%
Fishing Industry - Scope 3: Total CO2 equivalent [Mt CO2 eq./a] 250 239 227 178
Variation compared to 2019 [%] -4% -9% -29%
Agriculture, Food & Tobacco
Agriculture, Food Processing &Tobacco - Scope 1: Total CO2 equivalent [Mt CO2 eq./a] 355 272 184 0
Variation compared to 2019 [%] -24% -48% -100%
Agriculture, Food Processing & Tobacco - Scope 2: Total CO2 equivalent [Mt CO2 eq./a] 975 632 326 0
Variation compared to 2019 [%] -35% -67% -100%
Agriculture, Food Processing & Tobacco - Scope 3: Total CO2 equivalent [Mt CO2 eq./a] 8,826 6,310 3,774 2,867
Variation compared to 2019 [%] -29% -57% -68%
Forestry & Wood
Forestry, Wood Products - Scope 1: Total CO2 equivalent [Mt CO2 eq./a] 196 155 105 0
Variation compared to 2019 [%] -21% -47% -100%
Forestry, Wood Products - Scope 2: Total CO2 equivalent [Mt CO2 eq./a] 492 259 128 0
Variation compared to 2019 [%] -47% -74% -100%
Forestry, Wood Products - Scope 3: Total CO2 equivalent [Mt CO2 eq./a] 663 326 -127 -232
Variation compared to 2019 [%] -51% -119% -135%
Fishery emissions on include the operation of ships, fish farming, the cooling chain and fish product processing. The majority
of water utility emissions are from water pumping, water filtering and cleaning processes and – for saltwater – desalination.
The Scope 3 emissions are due to methane and nitrous oxide (N2O) from sewers or biological wastewater treatment and
sludge.
Monday, 25 October 2021 EMBARGO TILL 2. NOVEMBER 2021 2AM CETSectorial Pathways for Industries – OneEarth Climate Model 2021 University of Technology Sydney
Institute for Sustainable Futures
The Table 5 provides the emissions by the chemical industry and further broken down to 5 sub-sectors which are calculated
based on GDP shares and energy intensities typical for those industries. The energy demand data for e.g. the
pharmaceutical industry is not available and the calculation is based on market shares and available statistics. However, the
energy demand and therefore the emissions are estimations and require further research. The publication of the
methodology in the scientific literature is planned for late 2021/early 2022.
Table 5: Global Scope 1,2 and 3 emissions for the Chemical and Textile & Leather industry
Subsector Unit 2019 2025 2030 2050
Chemical Industries
Scope 1: Total direct emissions in Carbon dioxide equivalent [Mt CO2 eq./a] 1,257 994 707 0
Variation compared to 2019 [%] -21% -44% -100%
Scope 2: Emissions - Electricity generation [Mt CO2 eq./a] 761 499 264 0
Variation compared to 2019 [%] -34% -65% -100%
Scope 3: Emissions [Mt CO2 eq./a] 2,520 1,852 1,220 682
Variation compared to 2019 [%] -27% -52% -73%
Chemical Industries – Subsectors
Pharmaceutical Industry - Scope 1" [Mt CO2 eq./a] 230 181 129 0
Pharmaceutical Industry - Scope 2" [Mt CO2 eq./a] 202 133 71 0
Pharmaceutical Industry - Scope 3" [Mt CO2 eq./a] 0 0 0 0
Agricultural Chemicals - Scope 1" [Mt CO2 eq./a] 270 213 151 0
Agricultural Chemicals - Scope 2" [Mt CO2 eq./a] 111 73 39 0
Agricultural Chemicals - Scope 3" [Mt CO2 eq./a] 0 0 0 0
Inorganic Chemicals and Consumer Products - Scope 1" [Mt CO2 eq./a] 229 181 128 0
Inorganic Chemicals and Consumer Products - Scope 2" [Mt CO2 eq./a] 205 134 71 0
Inorganic Chemicals and Consumer Products - Scope 3" [Mt CO2 eq./a] 0 0 0 0
Manufactured Fibres & Synthetic Rubber - Scope 1" [Mt CO2 eq./a] 301 237 169 0
Manufactured Fibres & Synthetic Rubber - Scope 2" [Mt CO2 eq./a] 39 25 13 0
Manufactured Fibres & Synthetic Rubber - Scope 3" [Mt CO2 eq./a] 0 0 0 0
Bulk Petrochemicals & Intermediates, Plastic Resins - Scope 1" [Mt CO2 eq./a] 229 181 129 0
Bulk Petrochemicals & Intermediates, Plastic Resins - Scope 2" [Mt CO2 eq./a] 205 133 70 0
Bulk Petrochemicals & Intermediates, Plastic Resins - Scope 3" [Mt CO2 eq./a] 0 0 0 0
Textile & Leather Industries
Scope 1: Total direct emissions in Carbon dioxide equivalent [Mt CO2 eq./a] 178 151 109 0
Change to 2019 [%] -15% -39% -100%
Scope 2: Emissions - Electricity generation [Mt CO2 eq./a] 181 127 68 0
Change to 2019 [%] -30% -62% -100%
Scope 3: Emissions [Mt CO2 eq./a] 38 30 24 20
Change to 2019 [%] -23% -37% -48%
Table 6: Global Scope 1,2 and 3 emissions for energy intensive materials industries
Subsector Unit 2019 2025 2030 2050
Aluminium Industry
Scope 1: Total direct emissions in Carbon dioxide equivalent [Mt CO2 eq./a] 401 337 308 270
Change to 2019 [%] -16% -23% -33%
Scope 2: Electricity generation for aluminium production - emissions from
[Mt CO2 eq./a] 522 305 145 0
electricity generation
Change to 2019 [%] -42% -72% -100%
Scope 3: Emissions [Mt CO2 eq./a] 72 47 15 18
Change to 2019s -35% -79% -75%
Total Materials / Steel
Scope 1: Total direct emissions in Carbon dioxide equivalent [Mt CO2 eq./a] 1,073 762 489 0
Change to 2019 [%] -29% -54% -100%
Scope 2: Electricity generation for steel production [Mt CO2 eq./a] 645 459 223 0
Change to 2019 [%] -29% -65% -100%
Scope 3: Emissions in Carbon dioxide equivalent [Mt CO2 eq./a] 1,980 1,757 1,219 216
Change to 2019 [%] 0% -11% -38% -89%
Cement Industry
Total Materials / Cement
Scope 1: Total direct emissions in Carbon dioxide equivalent [Mt CO2 eq./a] 1,731 1,609 1,389 734
Change to 2019 [%] -7% -20% -58%
Scope 2: Emissions - Electricity generation for cement production [Mt CO2 eq./a] 248 116 54 0
Change to 2019 [%] -53% -78% -100%
Scope 3: Emissions [Mt CO2 eq./a] 8,239 5,110 2,494 0
Change to 2019 [%] -38% -70% -100%
Monday, 25 October 2021 EMBARGO TILL 2. NOVEMBER 2021 2AM CETSectorial Pathways for Industries – OneEarth Climate Model 2021 University of Technology Sydney
Institute for Sustainable Futures
The energy intensive cement, steel and aluminium industries are shown in Table 6. While scope 1 and 2 emissions are
basically energy-related emissions for fossil fuel-based generation of electricity and process heat, scope 3 emissions are
process emissions. For the aluminium industry it is tetrafluoromethane, used for certain production processes in aluminium
smelters especially in China (Nature 2021) 7. Both the steel and cement industry have process and not energy related
emissions. While the steel industry could avoid them by using hydrogen-based steel, there is no technical option yet to
avoid the process emissions of the cement industry. The OECM assumes that there are still process emissions in 2050, and
that nature-based carbon sinks – such as from re-forestation – and not CCS is used to compensate them. The OECM does
not factor in any emission compensation for energy-related emissions as an energy supply based on 100% renewable
energy that provides all energy needs by 2050 is calculated for the supply scenarios.
Finally, Table 7 shows the emissions from the buildings sector which includes construction. The calculation is based on a
separate research project under the leadership of the Central European University (Uerge-Vorsatz et.al. 2021) 8. The results
of that research were integrated into the OECM. The scientific documentation is due to be published in November 2021.
Table 7: Global Scope 1,2 and 3 emissions for buildings
Subsector Unit 2019 2025 2030 2050
Residential & Commercial Buildings and Construction
Residential Buildings - Scope 1: Total CO2 equivalent [Mt CO2 eq./a] 83 52 34 0
Change to 2019 [%] -38% -60% -100%
Residential Buildings - Scope 2: Total CO2 equivalent [Mt CO2 eq./a] 3,132 1,855 793 0
Change to 2019 [%] -41% -75% -100%
Residential Buildings - Scope 3: Total CO2 equivalent [Mt CO2 eq./a] 1,120 1,023 860 428
Change to 2019 [%] -9% -23% -62%
Commercial Buildings - Scope 1: Total CO2 equivalent [Mt CO2 eq./a] 45 30 21 0
Change to 2019 [%] -35% -54% -100%
Commercial Buildings - Scope 2: Total CO2 equivalent [Mt CO2 eq./a] 5,107 3,255 1,700 0
Change to 2019 [%] -36% -67% -100%
Commercial Buildings - Scope 3: Total CO2 equivalent [Mt CO2 eq./a] 611 586 529 305
Change to 2019 [%] -4% -13% -50%
Construction Buildings - Scope 1: Total CO2 equivalent [Mt CO2 eq./a] 128 81 54 0
Change to 2019 [%] -37% -58% -100%
Construction Buildings - Scope 2: Total CO2 equivalent [Mt CO2 eq./a] 63 36 20 0
Change to 2019 [%] -43% -69% -100%
Buildings - Scope 1: Total CO2 equivalent [Mt CO2 eq./a] 128 81 54 0
Change to 2019 [%] -37% -58% -100%
Buildings - Scope 2: Total CO2 equivalent [Mt CO2 eq./a] 8,239 5,110 2,494 0
Change to 2019 [%] -38% -70% -100%
Buildings - Scope 3: Total CO2 equivalent [Mt CO2 eq./a] 1,690 1,959 1,609 885
Change to 2019 [%] 16% -5% -48%
7 Nature, research highlights, 18 August 2021, What’s the mystery source of two potent greenhouse gases? The trail leads to Asia,
https://www.nature.com/articles/d41586-021-02231-0
8 Uerge-Vorsatz et.al. 2021, paper accepted to be published, exact reference no available yet
Monday, 25 October 2021 EMBARGO TILL 2. NOVEMBER 2021 2AM CETSectorial Pathways for Industries – OneEarth Climate Model 2021 University of Technology Sydney
Institute for Sustainable Futures
Annex
Overview – Differences OECM vs IEA NZ
IEA Net Zero Scenario OECM – Energy pathway
Aside from projects already committed as of 2021, no new oil or gas Existing oil and gas fields and coal mines are phased out at an average
fields, or coal mines or mine extensions should be approved for annual decrease rate of at least 8.5%, 3.5% and 9.5% respectively.
development after 2021. New fossil fuel projects cannot go ahead.
Fossil fuel use falls from almost 80% of global energy supply in 2021 to Fossil fuels will account for just under 8% of total energy supply in 2050 (for
just over 20% in 2050. CC(U)S is used after 2030 for coal, gas and bio non-energy use only).
energy fueled plants.
The pathway includes providing electricity to around 785 million Likewise, the OECM will lead to a universal access to energy services for
people who currently lack access, and clean cooking solutions to 2.6 100% of the global population.
billion people. This leads to 100% access to energy services by 2050
No new final investment decisions should be taken for new unabated No new investment in fossil power plants after 2030, and coal power plants
coal plants, the least efficient coal plants should be phased out by -including combined-heat and power (CHP)- will be phased out in Europe
2030, and by 2040 any remaining coal plants should be retrofitted with and North America between 2030 and 2035.
CCUS.
Emissions reductions through to 2030 rely on existing technologies, Emissions reductions are almost completely driven by the shift to existing
but by 2050, 46% of emissions reductions come from technologies renewable energy technology, with some new technological development
that are currently at the demonstration or prototype phase. needed to assist the transition to electric vehicles, biofuels and hydrogen in
the industry and transport sectors.
Carbon Capture, Utilization and Storage (CCUS) will capture 7,600 Mt BECCS and CCUS are both excluded from the analysis due to their lack of
CO2 per year by 2050. 5,245 Mt of this will be from fossil fuels and commercial viability. Reforestation begins immediately, and deforestation
processes (including power, industry, and hydrogen production), 1,380 ends by 2030. Nature based carbon sinks (forests, mangroves and seaweed)
Mt from bioenergy (e.g., BECCS), and around 1,500 Mt will be from are used instead of CCS to compensate for process emissions.
DACS technologies. OECM: - 5 Gt CO2 by 2050 / -86 Gt CO2 (cumulative until 2100)
IEA : approx. -120 Gt until 2050 (cumulative) no data for 2100.
Hydrogen production will be scaled up to be used as fuel in sectors 7% of final energy use (2 EJ/a] will be supplied by renewable generated
such as shipping, air travel and heavy industry, with a total of 11 EJ/a hydrogen, mainly for industrial process heat by 2050.
produced by 2050.
Electricity will account for almost 50% of total energy consumption in Electricity will account for around 65% of total energy consumption in 2050.
2050, and total electricity generation will increase by 250% from 2021. Electricity generation will increase by 206% until 2050, based on 2020 levels.
IEA - Total global power generation in 2050: 72,000 TWh OECM: Total power generation in 2050: 53,500 (2020: 26,700 TWh)
Almost 90% of global electricity generation in 2050 comes from 100% of electricity generation will be from renewable energy. 100% of total
renewable energy. Solar and wind account for 70%. Two thirds of total energy supply will be from renewable energy, with solar accounting for one
energy supply in 2050 is from renewables, with solar accounting for third of global energy supply. Any remaining fossil fuels will only be used for
one fifth of total global energy supply. non-energy uses such as the petrochemicals industry.
Solar generation capacity is expected to increase 20-times between Solar generation is expected to increase by 23 times between 2020 and
now and 2050, and wind capacity by 11 times. 2050, and wind by 14.5 times.
This includes annual additions of 630 GW of solar and 290 GW of wind Solar and wind are expected to phase up by 500 GW for solar PV per annum
by 2030. between 2020-2030, and 350 MW wind per annum (of which 14% will be
offshore). This requires an increase of the current annual market volumes
(in GW/a) for both technologies
Annual rate of energy intensity improvements of around 4% per year While the rate differs per region, this report assumes a comparable global
to 2030. average rate of energy intensity improvements to the IEA.
Total global final energy demand in 2050 is around 17% less than Total global energy demand is 29% less than in 2020.
2020.
Bioenergy will be deployed for aviation, shipping, cooking, and Sustainable biomass will produce 85,000 PJ/a in 2050. It will primarily be
replacing natural gas with biomethane to provide heat and electricity. used for process heat and aviation.
Bioenergy will produce 102,000 PJ/a by 2050.
The biggest innovation opportunities are in the areas of advanced No reliance on “break-through” technologies such as BECCS or DACS, but
battery storage, hydrogen electrolysis and direct air capture and focused on technology that is already market ready, including technologies
storage (DACS). that may still evolve and fall in cost over time use to economies of scale.
Monday, 25 October 2021 EMBARGO TILL 2. NOVEMBER 2021 2AM CETYou can also read